 |
| About Bioline | All Journals | Testimonials | Membership | News |
|
||||||
|
||||||
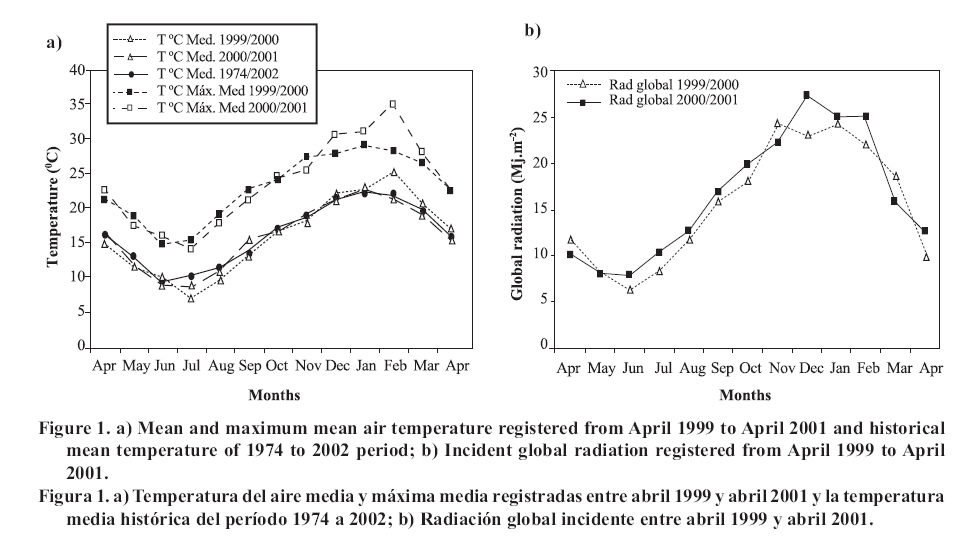
Agricultura Técnica, Vol. 67, No. 4, Oct-Dec, 2007 pp. 372-383 Research EFFECTS OF SHADE ON THE PERSISTENCE OF COOL-SEASON GRASSES TO FORM TURFGRASS Influencia de la sombra en la persistencia de especies mesotérmicas para formar céspedes ornamentales Teresa Silvana Caminos1* y Sergio José Estévez [1] [1] Universidad Nacional de Río Cuarto, Fac. Agronomía y Veterinaria, Dpto. Producción Vegetal.. Ruta Nac. N° 36, Km. 601, Río Cuarto, Córdoba, Argentina. E-mail: tcaminos@ayv.unrc.edu.ar. * Author for correspondence. Received: 21 September 2006. Code Number: at07045 ABSTRACT Cool season turfgrass have difficulties to grow and persist with good quality under shade in the summer. The objective of this study was to evaluate the ability and persistence of three cool season species suitable for turfgrass under different levels of shade, in the Province of Cordoba, Argentina (33°07' lat. S, 64°14' long. O). Density, cover, overall quality and dry weight of live and dead biomass were evaluated in Festuca rubra L., Poa trivialis L. and Agrostis stolonifera L.var. palustris (Huds.) Farw. growing under 0, 25, 50 and 80% light reduction. The shade was produced with black plastic shading mesh. The behaviour of the turf was modified over time, with the genotype and the level of shade in which it grew (p ≤ 0.001). In all the variables there were interactions between species × time (p ≤ 0.001); shade level × time (p ≤ 0.001) and species × shade level (p ≤ 0.05). None of the varieties of the studied grasses can be used as a single genotype to form turfgrass under full sunlight. Under 25% of shade, only A. stolonifera produced good quality turf as single species, surviving until the beginning of the second warm season. Under 50% of light reduction, A. stolonifera is the only species that persisted two years from its establishment, with very good quality in the first year and just acceptable in the second year. At 80% of shading, A. stolonifera and P. trivialis persisted until the second early summer with acceptable quality, but only A. stoloniferasurvived two warm seasons. Key words: turfgrass, light reduction, Festuca rubra, Poa trivialis, Agrostis stolonifera. RESUMEN Los céspedes de especies mesotérmicas presentan dificultades para crecer y persistir bajo sombra en el verano con calidad aceptable. El objetivo fue evaluar la aptitud y persistencia de tres especies mesotérmicas para formar céspedes como especie única, bajo diferentes niveles de sombra, en la Provincia de Córdoba, Argentina (33°07’ lat. S, 64°14’ long. O). Se evaluó densidad, cobertura, apariencia y peso seco de la biomasa aérea viva y muerta en Festuca rubra L., Poa trivialis L. y Agrostis stolonifera L.var. palustris (Huds.) Farw., con 0, 25, 50 y 80% de reducción lumínica usando mallas sombreadoras plásticas negras. El comportamiento del césped se modificó a lo largo del tiempo, según el genotipo evaluado y el nivel de luz en que creció (p ≤ 0,001). En todas las variables hubo interacción entre especie × tiempo (p ≤ 0,001); nivel de sombra × tiempo (p ≤ 0,001) y especie × nivel de sombra (p ≤ 0,05). Ninguna de las variedades de las especies estudiadas puede emplearse como genotipo único para formar céspedes bajo luz solar plena. Con sombras del 25%, sólo A. stolonifera produce cubiertas cespitosas de buena calidad, como especie única, persistiendo hasta el inicio de la segunda estación estival. Con 50% de sombra, A. stolonifera es la única especie que persiste dos años a partir de su implantación, con muy buena calidad durante el primer año y sólo aceptable en el segundo. Con 80% de sombra, A. stolonifera y P. trivialis persisten con calidad aceptable hasta el inicio de la segunda estación estival, pero sólo A. stolonifera puede sobrevivir durante dos veranos. Palabras clave: cubiertas cespitosas, reducción lumínica, Festuca rubra, Poa trivialis, Agrostis stolonifera. INTRODUCTIONTurfgrass represents a key component of green spaces and contributes to improvement in the quality of life of the population and a reduction of environmental problems. In most landscapes, turfgrass cover grows in association with trees, bushes and constructions, with shade being the main environmental factor that affects its quality (Bell et al., 2000). In the central southern region of Cordoba Province, turfgrass covers are based on warm-season grasses, such as Cynodon dactylon L., requiring autumn reseedings with cool season grasses to keep them green throughout the year. This management practice is often used in transitional climatic regions, because cool season grasses have restricted growth when summer temperatures exceed optimal levels for extended periods (Xu and Huang, 2000). Nevertheless, there are genotype differences, given that Agrostis stolonifera L.var. palustris (Huds.) Farw. is considered a species with greater tolerance to heat, while Poa trivialis L. and Festuca rubra L. are more sensitive to high temperatures (Turgeon, 1996). An alternative management strategy to that described above consists in the choice of cool season grasses, and/or their varieties, on the basis of two criteria: the search for genotypes that are more tolerant to conditions of radiation and high temperatures, and employment of genotypes that possess a good behavior under conditions of reduced light exposure. Such criteria pursue different objectives, the first seeks to respond to the need to produce persistent grass covers of good quality under direct sunlight; while the other seeks the same, but for environments where the intensity of light is reduced because of the effect of different components of the landscape that produce shade. The behavior of cool season grasses varies under different intensities of light, citing F. rubra, A. stolonifera and P. trivialis as those with the most tolerance to shade (Harivandi and Gibeault, 1997). Low light intensity produces morphophysiologic changes, such as a reduction in the number of tillers and the degree of cover, which mean a deterioration of visual quality (Bär et al., 1995; Gardner and Taylor, 2002; Tegg and Lane, 2004). Nevertheless, for Misha (1991) density and the degree of cover increases with some shading, but decreases with greater levels of shade. The reduction of light exposure also produces a lower quantity of total aerial biomass and dead material (Norton et al., 1990). In evaluations of turfgrass growing under shade (70%) and direct sunlight, Al-Mana (2000) found that A. stolonifera presented acceptable levels of quality during the two years of the study. The overall quality of all the grasses and their behavior were generally better in the winter and spring; during the summer all the species growing under shade survived, and continued growing in the second year, while those that grew under sunlight died. The objective of this study was to determine the aptitude and persistence of three cool season grasses to form covers as a single species, growing under different levels of shade. MATERIAL AND METHODS The study was carried out at the Universidad Nacional de Río Cuarto (UNRC), Córdoba Province, Argentina (33°07’ lat. S, 64°14’ long. O), in typical Hapludol soil, very fine sandy loam. The regional climate is temperate, sub-humid to semi-arid, with a dry season in the winter. The air temperatures (mean and mean maximum), the historic series of mean temperatures (1974 to 2002), and the incident global radiation global registered at the Agrometeorological Station of the Faculty of Agronomy and Veterinary Sciences, UNRC, during the period of evaluation (April 1999 to April 2001) are presented in Figure 1 a and b. The experimental design used was randomized blocks, with three replications, with a spatial arrangement of split plot. The levels of shade evaluated were: 0% (control or full sunlight), 25; 50; and 80% of shade, which were adjusted using black plastic shading nets with different mesh. The quantitative control of the light reduction produced by each net was done using a spectoradiometer (LiCor, model LI-1800, Lincoln, Nebraska, USA) and the values obtained are presented in Table 1. The species and varieties evaluated were: Festuca rubra L. cv. Pennturfgrass, Poa trivialis L. cv. Sabre and Agrostis stolonifera var. palustris (Huds.) Farw. cv. Penncross. The level of light intensity was assigned to the main plots and the species to the sub-plots. Table 1. Light intensity values in the range of Photosynthetic Active Radiation (400-700 nm), in µmoles m-2 s-1, percentage of light reduction under each of the nets and the differences from the nominal value of shade indicated by the manufacturer. Cuadro 1. Valores de intensidad lumínica en el rango de la Radiación Fotosintéticamente Activa (400-700 nm), en µmoles m-2 s-1, porcentaje de reducción de la luz debajo de cada una de las mallas y diferencia con el valor nominal de sombra indicado por el fabricante.
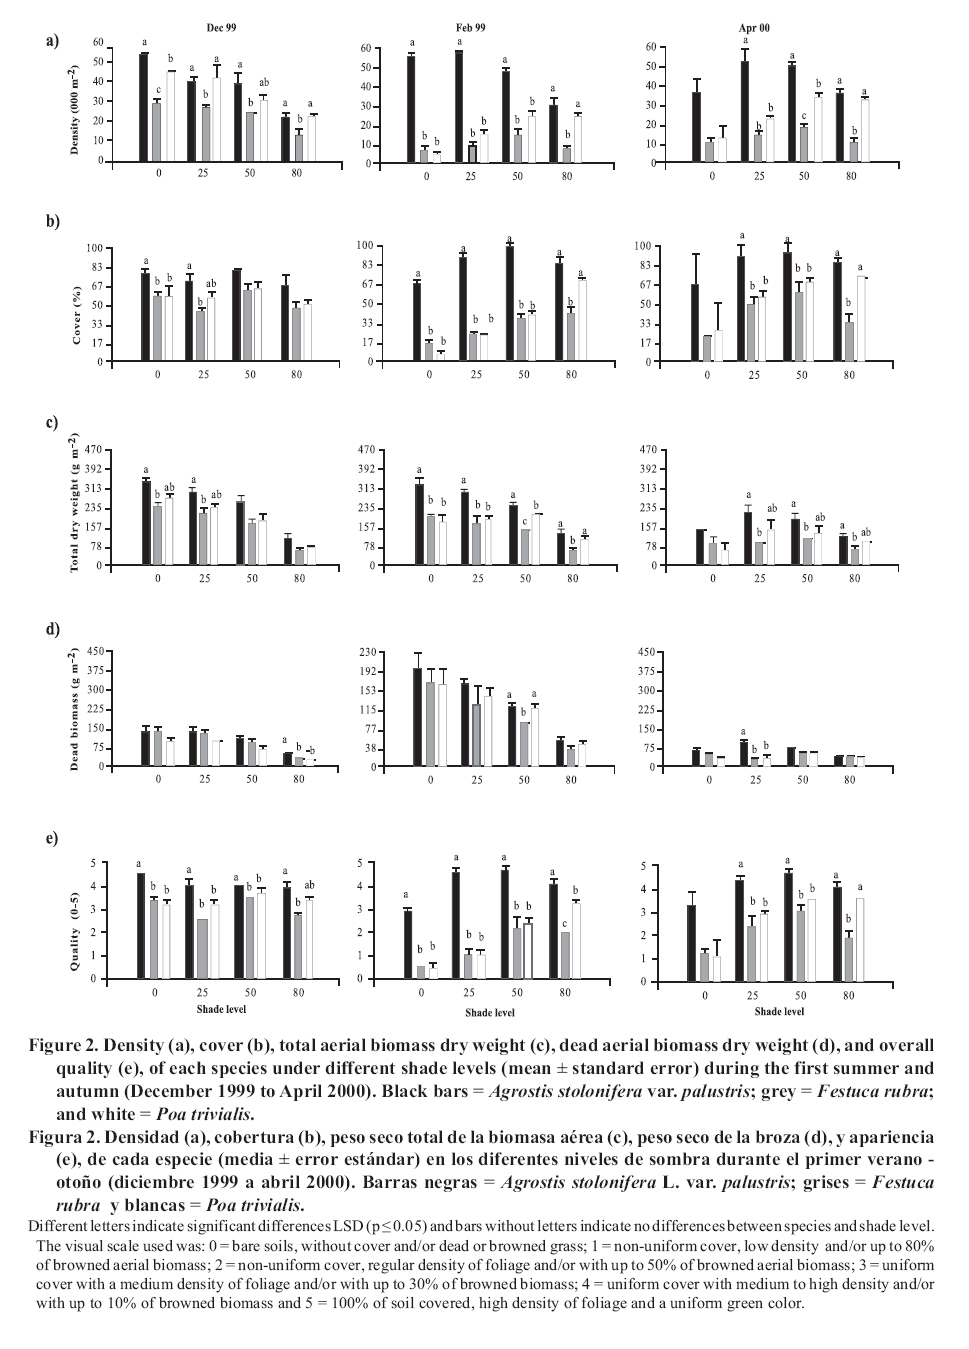
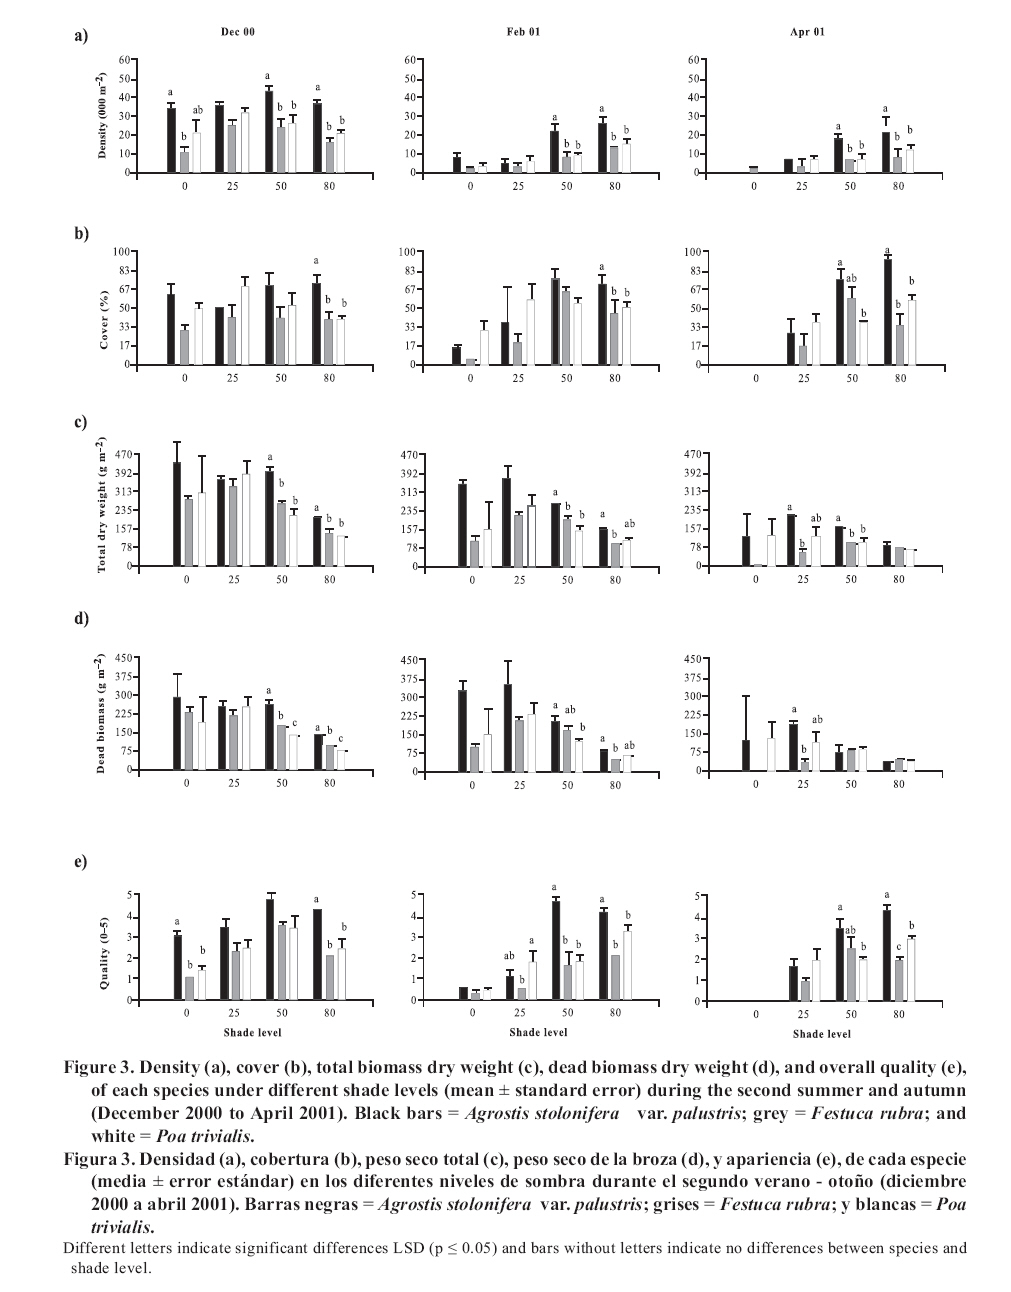
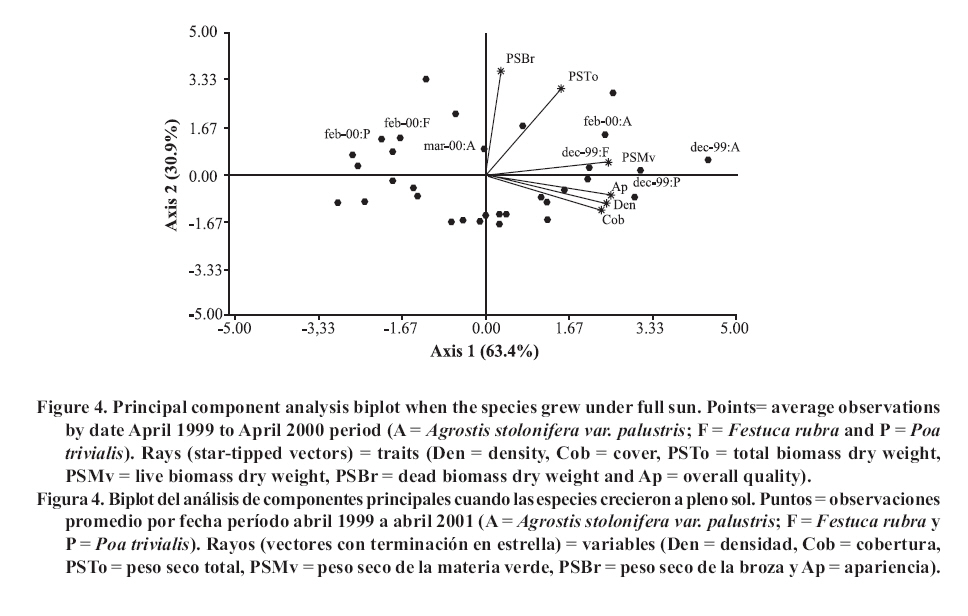
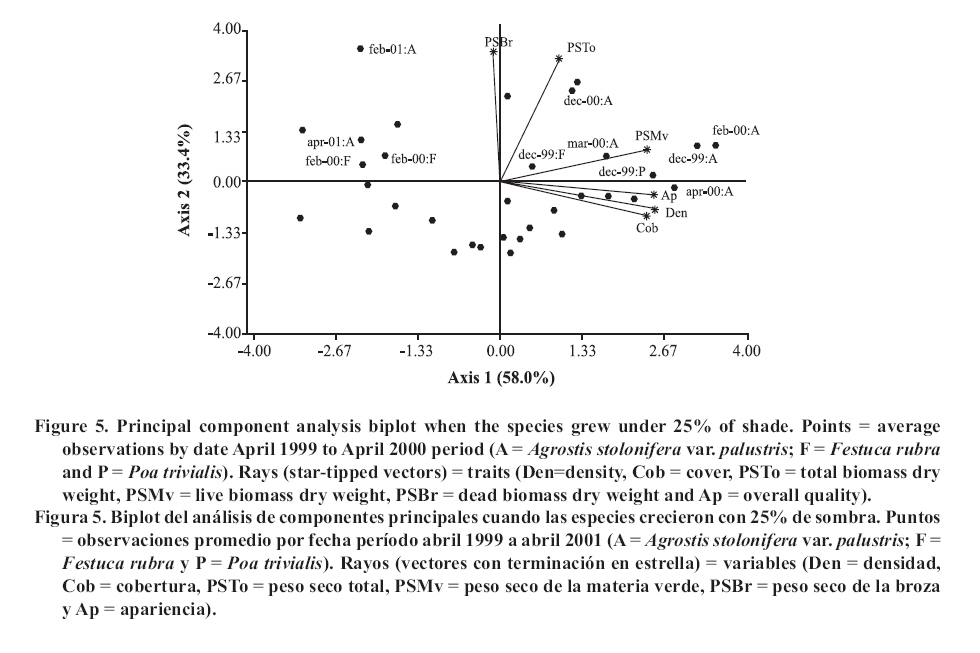
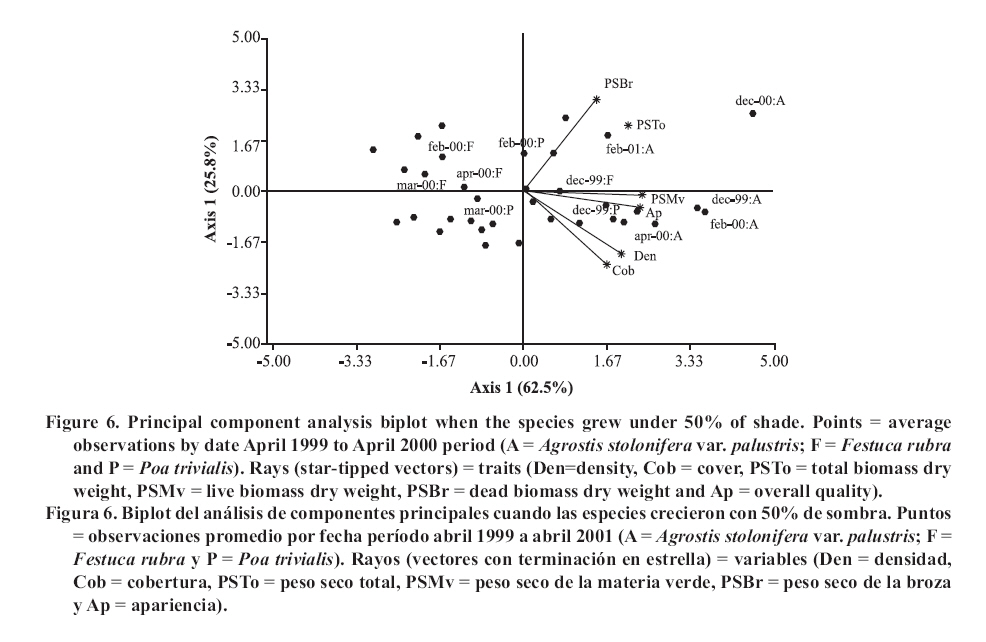
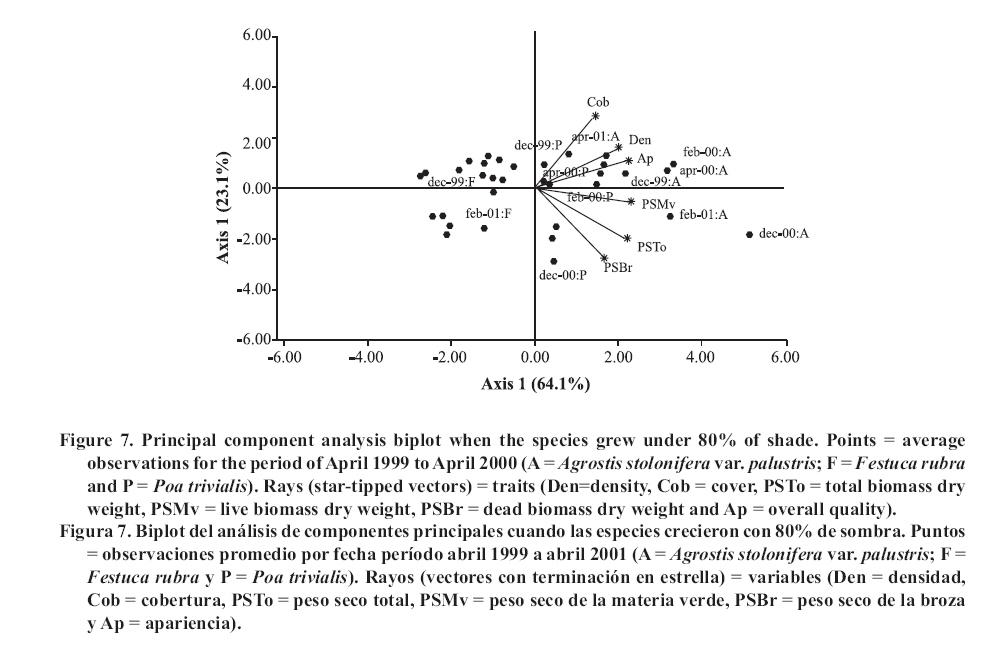
Seeding was done in April, 1999, with a density of 35,000 viable seeds m-2 on previously prepared and leveled soil. This density was the technically recommended level to achieve a good quality ornamental turfgrass or a sports field of medium competence. The observations were made monthly until April, 2001. Density was evaluated in the laboratory by counting the number of tillers of samples extracted with cylinders of 0.062 m in diameter and 0.07 m in height, following the methodology of Lush and Franz (1991). The aerial biomass was then cut, leaving a remnant of 0.05 m. The cut material was separated into live and dead matter (dead biomass), it was dried in a stove at 80°C and the dry weight was registered as: total aerial biomass (PSTo), green material (PSMv) and dead biomass (PSBr). Cover was determined in the field, as the percentage of soil covered by turfgrass, in accordance with the Point Quadrant method, described by Daget and Poissonet (1971). The visual quality or overall quality was determined using a qualitative scale of 0 to 5, which incorporated: percentage of soil cover, density and color of foliage (Horst et al., 1984), variables that were observed directly in each one of the plots. The scale used was: 0 = bare soils, without cover and/or dead or browned grass; 1 = non-uniform cover, low density and/or up to 80% of browned aerial biomass; 2 = non-uniform cover, regular density of foliage and/or with up to 50% of browned aerial biomass; 3 = uniform cover with a medium density of foliage and/or with up to 30% of browned biomass; 4 = uniform cover with medium to high density and/or with up to 10% of browned biomass and 5 = 100% of soil covered, high density of foliage and a uniform green color. In a complementary manner, air temperatures in full sunlight and under the shading nets were registered, taking 10 midday measurements during the months of December and January of both years. To determine if a turfgrass was of acceptable quality, minimal values were established for density, cover and overall quality, 20 000 tillers m-2, 70% and 3, respectively, which can correspond to an ornamental use. Management consisted of mowings to 5 cm of height with a motorized mower with a rotary type cutting system. The frequency was determined for each sub-plot applying the rule of the third, that is to say, they were cut each time that the turfgrass reached a height of 7.5 cm. (Turgeon, 1996). To establish the time and the quantity of water to apply in each treatment, the hydric capacity curve of the soil was calculated and its humidity content was monitored with a humidity meter Time Domain Reflectometry (TDR). Subsequently, for each level of shade and for each species, the necessary quantity of water to apply was calculated in order to maintain the humidity content between 40 and 80% of the field capacity. Three fertilizers applications were made, with N, P and K, in September, November and March of each year, considering the availability of nutrients in the soil, the requirements of the species and the levels of light studied (Beard, 1973). The data was submitted to repeated measurements analysis over time and were processed through the profile analysis. When the interactions double or triple among species, shade and date were significant, the differences between species were evaluated for each level of light in each one of the dates by means of the Fisher LSD test (p ≤ 0.05). As well, a multivariate analysis was made of the principle components for each level of light, which involved all of the variables evaluated. The analysis was made with the statistical software InfoStat (2006). RESULTS AND DISCUSSION In the profile analysis, the typical response of cool season grasses was observed, with growth peaks in spring and autumn and a reduction in the summer months. This pattern was followed by the three species during the two years and is reflected in a significant effect (p ≤ 0.001) of the time factor on the variables evaluated. The growth of the species was strongly affected by the genotype (p ≤ 0.001) and by the levels of light (p ≤ 0.001). For all the variables there was interaction among the level of light × time (p ≤ 0.001) and species × time (p ≤ 0.001), while species × level of light was significant (p ≤ 0.05) for density, cover, PSTo and overall quality. A triple interaction (species × level of light × time) was only registered for density (p ≤ 0.05). The range of optimal mean air temperatures for the growth of the aerial part of the cool season grasses is from 15 to 24°C (Beard, 1973). The thermal values remained within this range from September to April in the two years of the study, except in February of 2001, when they were higher (Figure 1 ). Nevertheless, between November and March of both years, the average maximum temperatures were higher than the optimal values, producing differential responses among the species. The evolution of the species under different treatments of shade levels during the summer-autumn period of each year (December to April), is presented in Figures 2 and 3 , given that this was the critical period for the survival of the species. Likewise, given the importance of dead aerial biomass in this period only the PSTo and PSBr are shown. During the first active growth period (June to December, 1999) all the species increased their density, which impliyed marked increases of PSTo, PSMv, cover and overall quality (only December 1999 is shown in Figure 2 ). In general, under the maximum light reduction (80%), the lowest values in the measured variable were observed, in accordance with what was found by Norton et al. (1990), Bär et al. (1995), Gardner and Taylor (2002) and Tegg and Lane (2004). Nevertheless, with intermediate levels of shade (25 and 50%) were observed increases in density and cover, similar to what was found by Misha (1991). Different letters indicate significant differences LSD (p ≤ 0.05) and bars without letters indicate no differences between species and shade level. The visual scale used was: 0 = bare soils, without cover and/or dead or browned grass; 1 = non-uniform cover, low density and/or up to 80% of browned aerial biomass; 2 = non-uniform cover, regular density of foliage and/or with up to 50% of browned aerial biomass; 3 = uniform cover with a medium density of foliage and/or with up to 30% of browned biomass; 4 = uniform cover with medium to high density and/or with up to 10% of browned biomass and 5 = 100% of soil covered, high density of foliage and a uniform green color. In the first summer, the maximum average temperatures were higher or close to 27°C (Figure 1 ), affecting the growth of all the species, mainly under full sunlight in the months of February to March, 2000, in accordance with what was found by Al-Mana (2000) and Xu and Huang (2000). This produced declines in density, cover, PSTo and overall quality, while the values of PSBr increased (Figure 2 ). Under shade, the genotype behavior depended on the level of light reduction in which it grew. In April, 2000 (Figure 2 ) the three species recovered in the light treatments and for the variables studied. During the second growth period (June to November, 2000, data not shown) density, cover, PSTo and overall quality of the species, maintained similar values to those reached in the autumn of the same year (April, 2000). At the beginning of the second summer (December 2000 in Figure 3 ), the three species began deteriorating, showing a reduction in the variables studied, except for PSBr, which increased to higher levels than those of the previous summer (Figure 2 c). This loss of aptitude was more pronounced in February and March, 2001, especially in the lower levels of shade (0 and 25% shade) when the maximum mean temperature values reached 35°C (Figure 1 ). Different letters indicate significant differences LSD (p ≤ 0.05) and bars without letters indicate no differences between species and shade level. In order to synthesize the behavior of the genotypes according to the level of shade in which they grew, a multivariate analysis was applied to all the variables registered during the two years of the study. As well, the aptitude of the genotypes to form quality turfgrass was determined, putting emphasis on the observed values of the variables of density, cover and overall quality. The behavior of the genotypes when they grow in full sunlight can be observed in the biplot generated by the multivariate analysis, whose first two axes explain 94% of the variability of the observations (Figure 4 ). Cover, density, overall quality and PSMv showed a high correlation that oscillated between 80 and 92%, obtaining the greatest values at the beginning of the first summer (December 1999) for the three species, as can be observed in axis one of the biplot. In accordance with these results and to what can be observed in Figure 2 a, b and e, until December, 1999 the density oscillated between 43 000 and 54 000 tillers m-2 for A. stolonifera, 30 000 and 45 000 tillers m-2 for P. trivialis and 30 000 tillers m-2 for F. rubra. This means a good evolution of cover, given that A. stolonifera covered more than 90% of the soil, while the other two species achieved acceptable values (70%). As a result, A. stolonifera had the best overall quality (4.5), while P. trivialis and F. rubra onlyachieved acceptable values of visual quality, which oscillated between 3.1 and 3.3. During the first summer, the three species experienced a notable deterioration, manifested in an increase of dead material (PSBr), which represented an important proportion of the PSTo, as can be observed in axis 2 of Figure 4 . With P. trivialis and F. rubra, this increase was appreciable since February, 2000, while with A. stolonifera, it occurred at the end of the summer, in March, 2000 (Figure 2 d). In accordance with what was reported by Al-Mana (2000), the marked reduction in density, cover and overall quality, produced the loss of aptitude to form turfgrass cover of all genotypes as a single species, although they showed a good autumn recovery, specially A. stolonifera (April, 2000, in Figure 2 ). When the species grew with 25% of shade, the behavior was different from what was described before. Density, cover, PSMv and overall quality showed a high positive correlation (75 to 89%) and increased in all the species until the beginning of the first summer (December 1999), but were maintained only until the end of the season only for A. stolonifera, which can be observed in axis 1 of Figure 5 , whose two axes explain the 91% of the variability of the observations. In accordance with what can be observed in Figure 2 a, b and e, until December, 1999, density in A. stolonifera and P. trivialis reached higher values (between 31 000 and 43 000 tillers m-2), with cover following a similar tendency (70 to 80%). Despite the similarities between the two species, A. stolonifera had a better overall quality, with values of 4, making it apt for good quality turfgrass, while P. trivialis, with a visual quality of 3.1, which can also be considered appropriate to form turfgrass cover, although of lower quality. The behavior of F. rubra was inferior and not acceptable, given that although it showed an adequate density (28 000 tillers m-2), the soil cover was lower than 50% and its overall quality was 2.5, which can be seen in Figure 5 . Under this condition of shade, the deterioration showed by the three species in the winter was less in comparison to the behavior under full sunlight, which coincides with what was observed by Misha (1991), although only A. stolonifera maintained higher acceptable values in the three variables. The density of this species decreased in March, 2000, but maintained high values (34 000 tillers m-2),cover was greater than 80% and it had an overall quality of 4.2, which indicates that it continues to be an apt species for good quality turf grass. P. trivialize and F. rubric, in contrast, beginning in February, 2000, showed very low values of density, cover and overall quality, so that PSBr increased, which makes them unacceptable as a single species (Figures 2 and 5 ). Beginning in autumn (April, 2000) A. stolonifera showed a good recovery in the three variables studied (50 000 tillers m-2; 85% cover and 4.5 overall quality), maintaining values similar to those during the active growth season (data not shown). Nevertheless, at the beginning of the second summer (December, 2000), this species began to show a deterioration in density, cover, PSMv and overall quality and an increase in PSBr, which was accentuated in February, 2001 (Figure 3 and 5 ), without observing an autumn recovery (April, 2001). This indicates that A. stolonifera showed aptitude as a single species, until April, 2000, with very good quality, becoming only acceptable until December of this year. With50% shade, the multivariate analysis explains 88% of the variability of the observations through its two primary axes. The correlation among the variables of density, cover, overall quality and PSMv oscillated between 65 and 89% (Figure 6 ). The behavior until the beginning of the first summer (December 1999) of all the genotypes was similar to that obtained under the levels of 0 and 25% shade. P. trivialis and F. rubra showed an increase of dead material (PSBr) during the first summer season (from February to April, 2000), as can be observed in axis 2 of Figure 6 and in Figure 2 d. A. stolonifera, nevertheless, persisted during both summers (February and April, 2000 and 2001), as is shown in axis 1 of the aforementioned figure. The values observed in Figure 2 a, b and e, during the first active growth period show that A. stolonifera and P. trivialis did not differentiate in terms of density. Nevertheless, the former showed a better evolution beginning in June (data not shown), with both species arriving to December, 1999 with 31 000 to 40 000 tillers m-2. Something similar occurred in cover, although genotypic differences were not observed, A. stolonifera arrived to cover more than 90% of the soil in December. This means better overall quality (4), a value equivalent to that registered under 25% of shade and full sunlight, which shows an aptitude to form good quality turfgrass cover. P. trivialis and F. rubra, with an overall quality of around 3.5 only obtained better visual quality than that observed under 25% shade, so that given its behavior up to December, 1999, it could be apt to form turfgrass of a lower quality than that of A. stolonifera. During the first summer and autumn (February to April 2000), only A. stolonifera showed a good performance to form quality turfgrass at this level of shade. Density was similar to or greater than that observed in December 1999 (between 40 000 and 50 000 tillers m-2) and cover oscillated between 80 and 100%. This produced an excellent overall quality, with values that oscillated between 4 and 4.7, so that this species maintains conditions to form turfgrass as a single species of very good quality. This tendency was maintained during the second growth season, from autumn to spring of 2000 (data not shown). At the beginning of the second summer (December, 2000), as can be observed in Figure 3 a, b and e, the density, cover and overall quality values of A. stolonifera were reduced (42 000 tillers m-2, 75% and 4, respectively), but remained above the threshold for turfgrass of good quality. The deterioration was more marked from February to April de 2001, but without compromising its aptitude to form quality turfgrass as a single species. Under the maximum density of shade (80%), the two primary axes of the biplot (Figure 7 ) explained 87% of the variability of the observations, with correlation values among density, cover and overall quality that varied between 63 and 77%. Only P. trivialis and A. stolonifera obtained acceptable values for all the variables during the first growth period and the following summer (December 1999 to April, 2000). The good behavior of these two species in the summer season can be observed in axis 1 of Figure 7 . In contrast, F. rubra declined markedly beginning in December, 1999, which would indicate the negative effect of high temperatures and low light intensities on this species. As shown in Figure 3 a, b and e, A. stolonifera and P. trivialis arrived to December, 1999 with values for density of acceptable quality to form turfgrass (23 000 tillers m-2), while cover oscillated between 50 and 70%. As a result of this, overall quality was better in December for A. stolonifera, although it did not differentiate itself from P. trivialis, with values that oscillated between 3.3 and 3.8; similar to those observed under 25 and 50% of shade. During the summer and autumn (February to April, 2000) A. stolonifera and P. trivialis, continued with acceptable values of density (between 20 000 and 35 000 tillers m-2), cover between 70 and 80% and overall quality that oscillated between 3.1 and 4. This means that both genotypes showed an aptitude to form quality turfgrass cover as a single species during the first growth cycle. In the second growth period, until December, 2000 (data not shown), the density and overall quality values reached in the previous autumn were maintained. In the summer and autumn of the second year (February to April 2001) this genotype presented density values of 28 000 tillers m-2, 70 to 95% of cover and 4 of overall quality (Figure 3 a, b and e). These qualities were also observed in axis 1 of Figure 7 , which allowed A. stolonifera to continue forming quality turfgrass cover as a single species. P. trivialis, in contrast, showed a marked decline in the three variables that determine quality beginning in December 2000, losing its aptitude as a single species in the second summer since the seeding (Figure 7 ). In summary, under full sunlight and with the management practices employed in this study, none of the genotypes showed an aptitude to be used as a single species. On the contrary, under shade only A. stolonifera and P. trivialis showed acceptable values for their election as turfgrass covers with quality and differential genotypic responses. A. stolonifera, stood out as the best single species under the three levels of shade tested. Growing with 25% of shade, it persisted with very good quality during the first summer, maintained acceptable values during the second active growth period, but showed a marked deterioration at the beginning of the second summer season. Under 50 and 80% of shade, the behavior de A. stolonifera was better, given that it could survive during the two summers of the study, a response similar to that found by Al-Mana (2000). Nevertheless, the quality produced under those two levels of shade was different, given that during the second summer season, the values of the measured attributes were only acceptable. P. trivialis, in contrast, survived as a single species in denser shade (80%) during the first summer. This response corresponds to the aptitude of both species with regard to their greater tolerance to shade, to which is added the lower susceptibility of A. stolonifera to the higher temperatures of the summers in the region of the study. This is consistent with measurements of air temperature taken in December and January of both years, under the medium-shaded nets used and the reported reductions of 8.0, 5.0 and 2.8°C for the 80, 50 and 25% of shade, respectively. CONCLUSIONS The results obtained allowed to conclude:
LITERATURE CITED
Copyright 2007 - Instituto de Investigaciones Agropecuarias, INIA (Chile). The following images related to this document are available:Photo images[at07045f5.jpg] [at07045f3.jpg] [at07045f2.jpg] [at07045f7.jpg] [at07045f6.jpg] [at07045f4.jpg] [at07045f1.jpg] |
| |||||||||