 |
| About Bioline | All Journals | Testimonials | Membership | News |
|
||||||
|
||||||
Australasian Biotechnology, Volume 9 Number 3, July/August
1999, pp. 151-158
Ten Trends in Australian Biotech Lyndal Thorburn, Advance Consulting & Evaluation, PO Box 629 Queanbeyan NSW 2620 Code Number:AU99010 This paper reports on major trends among dedicated biotech companies (DBCs) in Australia between biotech's first decade 1979-1988, and its second, 1989-1998. Over this period the number of dedicated biotechnology companies (DBCs) has more than doubled, and there has been a marked shift towards firms operating in human therapeutics. The proportion of firms delivering services (rather than products) and undertaking R&D as their main activity has also increased. A higher proportion of firms are now located in the smaller capital cities and at the same time a small number of firms have established in Europe and North America. Melbourne remains the centre of employment. Centres of research activity are concentrated in Canberra followed by Melbourne, Brisbane and Sydney. Patterns of ultimate ownership have remained stable. There has been an increase in access to venture capital at startup but firms remain small. Government policies need to address the issues raised by these trends. Introduction Interest in biotechnology in Australia has never been higher. In its last budget, the Australian Government announced it would provide $17.6m over two years to establish an office of biotechnology in the industry portfolio, and a statutory Office of the Gene Technology Regulator within the health portfolio (Minchin 1999). Several State governments have also initiated surveys of biotechnology and are developing policies to support local industry. In the last year, the NSW Innovation Council released a report on biotechnology (NSW Innovation Council 1998), the Committee for Melbourne has commissioned a study of Melbourne's biotechnology capabilities (Boston Consulting Group 1998), the Queensland government has announced almost $200m funding for biotechnology and establishment of a biotechnology advisory council (Moore 1998; Australian R&D Review 1999) and the SA government is examining the feasibility of a number of initiatives. This year the Department of Industry Science and Resources and the Australian Biotechnology Association finalised a directory of some 200 organisations involved in biotechnology in Australia. This CD directory was distributed free of charge at BIO, the world's largest biotechnology conference, in May 1999. Australia sent its largest delegation ever to BIO and the Australian display was extremely successful. Given this level of interest, it is timely to compare Australia's biotechnology industry now with the industry as it was at the end of the last decade. This paper reports on major trends among dedicated biotech companies (DBCs) in Australia in the last ten years, using 1998 and 1988 for comparison. The data have been extracted from Advance Consulting and Evaluation's database of biotechnology firms, supplemented by the recently released CD and a short survey distributed to 90 DBCs during August 1999. The Number Of Dedicated Biotech Companies Has More Than Doubled Approximately 200 DBCs are known to have been established in Australia since 1966. Of these 160 were operating at the end of 1998 (Table 1). Firms are defined as "not operating" if they have been taken over by another firm and have ceased to trade under the same name, or they have ceased to undertake R&D or trade products and services. Those established in 1999 have also been excluded from the analysis, as has the one firm established pre 1969. Table 1:-Trends in Biotech Startups
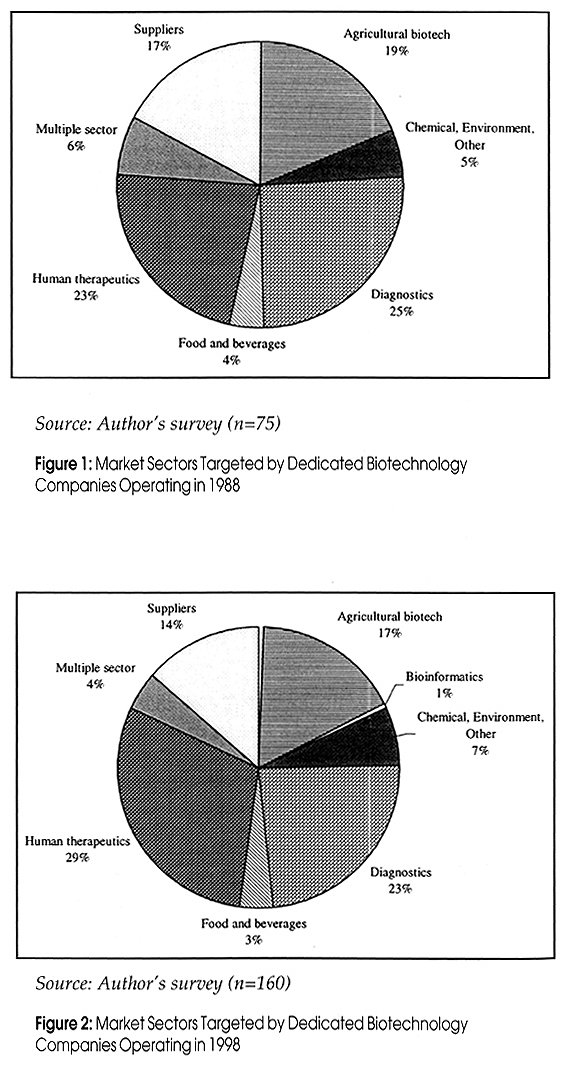
Source: Database plus Department of Industry Science and Resources (1999). Rates of Both Corporate and Research Spinoffs are Rising As can be seen from table 1 the start-up rate has been rising. These rates reflect a general rise in startup rates as well as a rise in corporate spinoffs (new firms established as subsidiaries of existing companies) from 20% of startups in 1978-1988 to 32% in 1988-1998. This is a good sign as a shift towards corporate founders occurred before the US boom in biotech in the late eighties (Dibner 1988). Research spinoffs (new firms spinning out from research institutions) have also been increasing, from 32% of new startups in 1978-1988 to 49% of startups from 1989-1998. The overlap between the sets of figures is due to an increase in the number of industry-university joint ventures as generators of new firms. Survival rates are also high although this may also reflect a low rate of takeover activity in the Australian market as well as gaps in the data set. Average Company Size has Also Doubled The August 1999 survey obtained employment data for 132 DBCs alive in 1998 and 14 DBCs alive in 1988. The 1998 firms employed a total of 3642 people of which 60% were employed by DBCs headquartered in Victoria. These DBCs each employed an average of 27 staff. The 14 firms which provided data for 1988 employed 132 staff, giving an average size of 15 staff in that year. Markets Have Shifted Towards Therapeutics In this period the markets targeted by DBCs have shifted towards human therapeutics, with a total of 29% of DBCs aiming at this sector as their main market in 1998, compared with 23% in 1988 (Figure 1, Figure 2). Multiple sector firms also operate in human therapeutics but put equal effort into other sectors such as veterinary therapeutics (classed as agricultural biotechnology) and sometimes molecular biologicals (classed as suppliers). Firms operating in chemical, environment and other areas (e.g. waste management, industrial enzymes, mining) have also increased to 7% of the total population. At the same time the percentage of firms in diagnostic products/services has fallen slightly from 25% to 23%. These diagnostic applications include food and environment markets (see below) as well as diagnosis of human diseases. Suppliers of molecular biologicals have also decreased in relative significance, from 18% to 14% of the total number of firms, as have agricultural biotech firms, from 19% to 17% of the total. The percentage of the market occupied by food and beverage DBCs has remained relatively constant. Bioinformatics firms have appeared only in the last two years. Figure 1: Market Sectors Targeted by Dedicated Biotechnology Companies Operating in 1988 Figure 2: Market Sectors Targeted by Dedicated Biotechnology Companies Operating in 1998 Activity Has Shifted Towards Services and RAD This change in sector focus has been accompanied by a significant shift towards services and R&D as major activities (Table 2). In 1988, three quarters of firms were primarily manufacturers and 17% were primarily undertaking R&D. Only 3% were primarily service deliverers. By 1998 the proportion of manufacturers had declined to 51% and the proportion of firms primarily providing services had risen to 15%. The latter is probably associated with a move into diagnostic services, for example genetic analysis (e.g. DNA typing), environmental analysis (e.g. water-based microbes) and food analysis (e.g. detection of genetically modified organisms). Table 2:- Comparison of Major DBC Activities in 1988 and 1998
In addition there has been an increase in the proportion of firms in R&D phase. This is most likely associated with the rise in both firm formation rate and the shift towards therapeutics markets, which have a longer lead-time. DBCs are Establishing in Smaller Capital Cities or Are Moving Offshore As the DBCs themselves have been growing in number, there has been a shift in operating location of new firms from the major States (i.e. NSW and Victoria) towards WA, Queensland and the ACT. (Table 3). NSW's share has dropped slightly from 36% of total DBCs to 32% of the total, and there has been a similar trend in Victoria where 24% of DBCs were located in 1998 compared to 28% ten years ago. SA has remained stable at around 10% of the total, while Queensland's share of DBC's has risen slightly to 14%. There has been a small rise in the number of ACT firms in the ACT but this does not reflect firm formation. Of the 6 new firms created by ACT research institutions in the past decade, three have been established elsewhere - one in Sydney, one in Melbourne and one overseas (see below). The biggest proportional rise in the number of new firms has been in WA whose share of the total population of DBC's has risen from 9% to over 15%. This is due to bursts of company formation in 1994 and 1998, primarily in human therapeutics (1994) and food/beverages and diagnostic services (1998). In the main these firms have been established as subsidiaries of larger firms or spinoffs from research institutions, rather than stand-alone entities. They also appear to be largely independent of government incentives towards establishment of biotech firms, although it may be too early to detect the impact of recent policy changes. This change of regional distribution within Australia has been accompanied by a shift off shore by a small number of firms. This may be primarily a response to shortage of investment capital for technology-based firms. Lack of finance has been identified as a major promoter of alliances in biotechnology (Hagedoorn 1990). In Australia's case the process of seeking finance sometimes leads to listing on NASDAQ, the US-based technology stock exchange. This may be accompanied by restructuring where a U.S. firm is established as the headquarters and R&D is performed in a wholly-owned Australian subsidiary. Progen and Forbio, both originally set up in Queensland, are now NASDAQ listed, as is NSW's Novogen. Cortecs International, established in WA, is listed on the London Stock Exchange. Crop Design, set up by the ANU, is located in Belgium and Ag-Gene was incorporated in the UK, although it operates in Australia. Both Cortecs and ForBio have also moved their main operations overseas. ForBio will be analysed in more detail as a case study of both the risks and rewards of this type of development. Table 3:- Change in Location of DBCs, 1988 and 1998
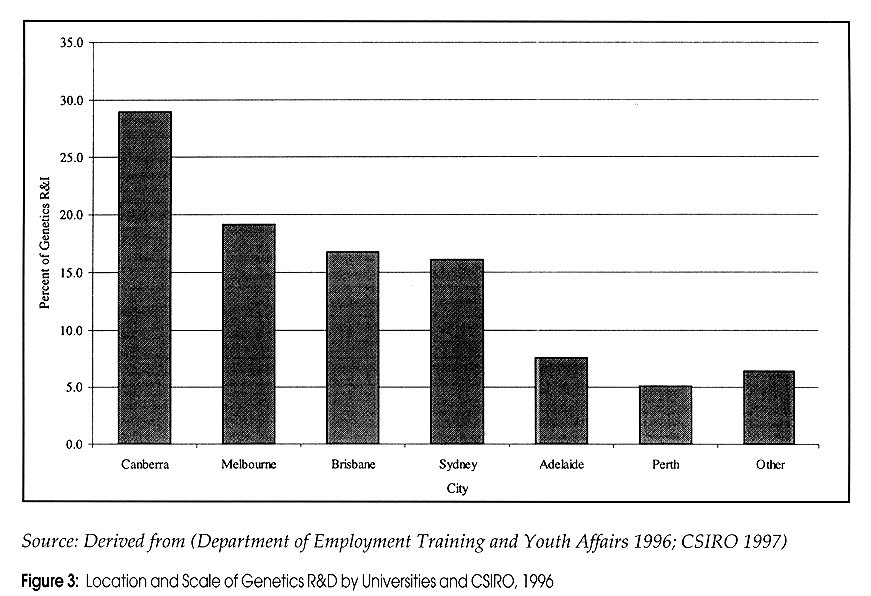
ForBio was established in 1994 and was listed on the Australian Stock Exchange in 1995 (Morgan Stockbroking Limited 1995). By 1997 it had a total turnover of $37 million and had established twelve subsidiaries, joint ventures and licensing arrangements covering production, marketing and R&D. These subsidiaries were located in Australia, Malaysia, USA, UK and Europe. In mid-1998 ForBio announced it would establish ForBio Inc. as the holding group for ForBio companies world-wide and would list on NASDAQ (ForBio Ltd 1998). The intention was for ForBio Ltd to de-list in Australia and, after restructuring, become a subsidiary of the new U.S. parent. Such a move would have allowed it to operate in the large U.S. market as a U.S. firm, to access incentives provided by the U.S. government and, more importantly, U.S.-based venture capital. All this has come unstuck, however, and ForBio has now been placed under administration (The Australian 1999).* Its problems stem largely from its complex structure, which could not be restructured in time for its NASDAQ listing, according to newspaper reports. Locations of New Firms are Not Well-Matched to Research Centres It is difficult to measure public sector R&D in biotechnology as it is a broad field and the available classification systems do not identify biotechnology separately. One approach is to use Field of Research (FOR) data. FOR is an international hierarchical classification scheme based on major basic and applied research disciplines (CSIRO 1994). It has one class, "Genetics" (Class 080200), which is clearly biotechnology-related but does not exclusively cover the field. Cross-referencing of these data with Australian Research Grants funding reports and NHMRC data (Australian Research Council 1996, NHMRC 1999) reveals that about 90% of university biotech R&D is classified as genetics, so FOR data will underestimate the true levels of research. Activities of other institutions can be estimated by key word searches ("genetics", "gene", "biotechnology" etc) of grant funding. Such analyses reveal that about $170m was spent on genetics research by these institutions in 1996 (Table 4). The data also show that 35% of funding for which the purpose is known was spent on agriculture and that 28% was spent on therapeutics. Funding for "unknown" purposes was largely directed towards basic research. Universities and CSIRO perform 80% of this research. Their research effort in genetics is greatest in Canberra, followed by Melbourne, Brisbane and Sydney (Figure 3). This ranking remains the same even after the activities of medical research institutes are added in. These perform $18m of genetics R&D per year, of which under half is in Melbourne (NHMRC 1999). Universities and CSIRO in Canberra and Melbourne alone perform almost half the public-sector-funded genetics R&D in Australia, concentrating on therapeutics and agriculture respectively. Thus, while Sydney and Melbourne host the most biotech firms, institutions in Canberra perform the most genetics R&D. *Editor's note: see our story on p144 this issue Table 4: Summary of Public Sector R&D in Genetics, 1996
Source: Derived from apportioning activity from CSIRO (1997); Australian Institute of Marine Science (1998); NHMRC (1999) and RDC Annual Reports over genetics data in Department of Employment Training and Youth Affairs (1996). University and CSIRO data also include overheads so figures for MRIs, hospitals & state departments have been adjusted so are comparable in coverage. The Percentage of Australian Ownership Is Stable The proportion of Australian ownership trends (as distinct from operational location) has remained relatively stable at 84% of DBC's. The percentage of stand-alone firms, ie private firms owned by a small number of individual shareholders has fallen from 42% of the total in 1988 to 32% of the total in 1998 (Table 5). This has been countered by a rise in the percentage of firms who are subsidiaries of an Australian firm or organisations, from 43% of the total in 1988 to 52% of the total in 1998( this includes Australian Stock Exchange listed firms). Both trends are related to the rise in the number of research/corporate spinoffs, discussed above. Overseas ownership has remained correspondingly stable over the decade at 16% of the total. In 1998 8% of DBCs were subsidiaries of North American (primarily US) companies compared to 60% in 1988. Proportions of European-owned (primarily German) subsidiaries remained stable, as did proportions of Asian (mainly Japanese) subsidiaries. Figure 3:- Location and Scale of Genetics R&D by Universities and CSIRO, 1996 Table 5: Ultimate Ownership of Dedicated Biotechnology Companies, 1988 and 1998
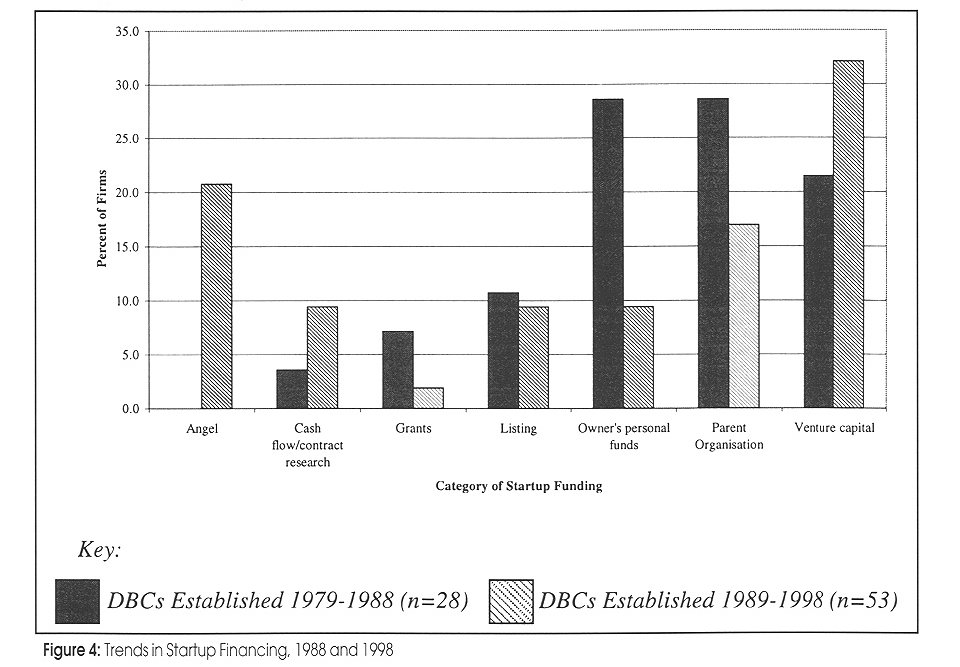
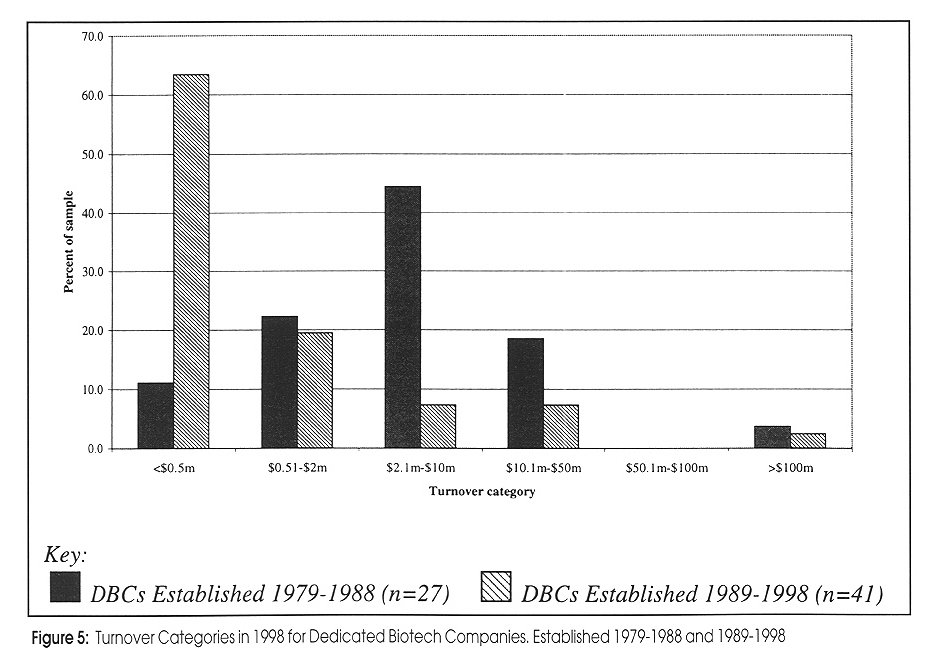
Source of startup funds is known for 28 (37%) of the 75 firms operating in 1988 and established 1979-1988, and 53 (51%) of the 104 firms operating in 1998 and established 1989-1998 (i.e. excluding DBCs operating in 1998 but established before 1989). Access to both formal and informal ("angel") venture capital appears to have increased over the period, perhaps reflecting the shift towards therapeutics as this market needs longer lead times and higher levels of early funding (Figure 4). Figure 4:- Trends in Startup Financing, 1988 and 1998 The percentage of DBCs receiving support from parent organisations on startup has decreased, despite the rising proportions of corporate/research spinoffs. Such organisations may be helping spinoffs to obtain venture finance rather than provide seed money to their offspring, as research spinoffs are more likely to be recipients if formal venture capital (but not angel funding) than non-spinoffs. On the other hand perhaps research spinoffs present a more attractive proposition for venture investors. But Turnover Remains Low Survey respondents were asked to indicate their current turnover within set ranges. These results were then analysed according to the decade when the respondent was established. It is interesting to note that only two DBCs (AMRAD Ltd started in 1987 and CSL Ltd, created by privatising a government laboratory in 1994) have grown to a turnover greater than $100m (Figure 5). Both these firms had considerable government assistance on startup. Figure 5:- Turnover Categories in 1998 for Dedicated Biotech Companies. Established 1979-1988 and 1989-1998 In the older group the most frequent turnover (44%) lies in the range $2.1m-$10m, while 18% have a turnover from $10.1m-$50m. At least one firm is known to have reached greater than $50m turnover and has since fallen back into a lower category. The younger group of DBCs has a lower turnover overall, with 63% of the sample falling in the range <$0.5m. This is to be expected, given the long lead times of biotech product development. Conclusion There have been some significant shifts in the composition of the dedicated biotech firms in the past decade. The main difference is a shift towards therapeutics, which has been accompanied by greater use of formal and informal venture funding in start-up stages. The other shift in activity is towards services, reflecting a broader market for biotechnology outputs. While these trends auger well for the Australian industry, the apparent tendency for firms to move overseas (or even establish overseas) threatens these developments, as jobs will be drawn out of Australia. Even when firms retain R&D in Australia if the main operation is elsewhere then there is less opportunity for Australian managers and technicians to gain experience in running global biotech firms. In addition the apparent mismatch between the main centres of genetic research (Canberra, Melbourne) and the location of the most new firms (Sydney, Melbourne and Perth) may be a problem, given the reliance of biotech firms on the research system and the importance of local links in development of vibrant regional clusters (Kenney 1986; Haug 1995). Government policy initiatives must address this issue if commercial biotechnology is to grow as much in the next ten years as it has in the last ten. References Australian Institute of Marine Science (1998): Annual Report 1997-1998. AIMS, 7 September 1998, Townsville. Australian R&D Review (1999): Queensland Makes Play for Biotechnology. Australian R&D Review. May 1999: 20. Australian Research Council (1996): Report on Research Funding Programs 1996: Volume 2 Grants and Fellowships Awarded. Department of Employment, Education, Training and Youth Affairs,1996, Canberra. Boston Consulting Group (1998): Biotechnology Study - Phase 1 Presentation Executive Sub-committee. Committee for Melbourne, Consultancy Report 10 March 1998, Melbourne. CSIRO (1994): CSIRO Research Classification 1994: Guidelines for Classifying CSIRO Research by Socioeconomic Objective, Field of Research and Type of Activity. CSIRO Corporate Planning Office,February, 1994, Canberra. CSIRO (1997): Expenditure by Field of Research (Group Level), by Division, CSIRO, 1996/97. Internal Working Document: Excel Spreadsheet. Department of Employment Training and Youth Affairs (1996): Source of Funds for R&D, Higher Education Institutions, 1996, Field of Research 080200 (Genetics, Molecular Biology and Biotechnology). Australian Bureau of Statistics,1996, Canberra. Department of Industry Science and Resources (1999): Australian Biotechnology Directory 1999. Canberra, Department Department of Industry Science and Resources and the Australian Biotechnology Association. Dibner, M.D. (1988): Biotechnology Guide USA - Companies , Data and Analysis in (Ed.) Biotechnology Guide USA - Companies, Data and Analysis. New York, Stockton Press. 1: 101-374. ForBio Ltd (1998): ForBio Flexible with NASDAQ Float. Press Release. Brisbane, ForBio Ltd: 1. Hagedoorn, J. (1990): Inter-firm Partnerships and Co-operative Strategies in Core Technologies in Freeman, C and Soete, L (Ed.) New Explorations in the Economics of Technical Change. London, Pinter Publishers: 3. Haug, P. (1995): Formation of Biotechnology Firms in the Greater Seattle Region: an Empirical Investigation of Entrepreneurial, Financial and Educational Perspectives. Environment and Planning A 27: 249-267. Kenney, M. (1986): Biotechnology: The University-Industrial Complex. New York, Yale University Press. Minchin, S.t.H.N. (1999): Science and Technology Budget Statement 1999-2000. Department of industry Science and Resources,Budget paper May 1999, Canberra. Moore, J. (1998): Governments Fund $50 Million Science Centre at UQ. Canberra, Office of the Minister for Industry, Science and Tourism: 2. Morgan Stockbroking Limited (1995): ForBio Limited Prospectus and Information Memorandum. Morgan Stockbroking Limited,September 1995, Brisbane. NHMRC (1999): Grants Management System Report on Genetics Research Projects, 1996. NHMRC, Overall comprehensive report prepared February 1999, Canberra. NSW Innovation Council (1998): Biotechnology in NSW; Opportunities and Challenges. NSW Department of State and Regional Development, August 1998, Sydney. The Australian (1999): ForBio Suspended, Friday August 20 1999, p21, Business Section. Thorburn, L. (1998): Innovation by Australian Biotechnology Companies. Australasian Biotechnology 8(4). Thorburn, L. (1999): Global-Local Relationships in Biotechnology: a Case Study of Australia's Dedicated Biotechnology Companies and Their Innovation Networks. Biological Sciences. Sydney, Macquarie University: 440. Copyright 1999 Australian Biotechnology Association Ltd. The following images related to this document are available:Photo images[au99010b.jpg] [au99010c.jpg] [au99010a.jpg] [au99010d.jpg] | |||||||||||||||||||||||||||||||||||||||||||||||||||||||||||||||||||||||||||||||||||||||||||||||||||||||||||||||||||||||||||||||||||||||||||||||||||||||||||||||||||||||||||||||||||||||||||||||||||||||||||||||||||||||||||
| |||||||||
