 |
| About Bioline | All Journals | Testimonials | Membership | News |
|
||||||
|
||||||
Australasian Biotechnology, Volume 9 Number 3, July/August
1999, pp. 159-166
Applications of Flow Cytometry to Microbiology
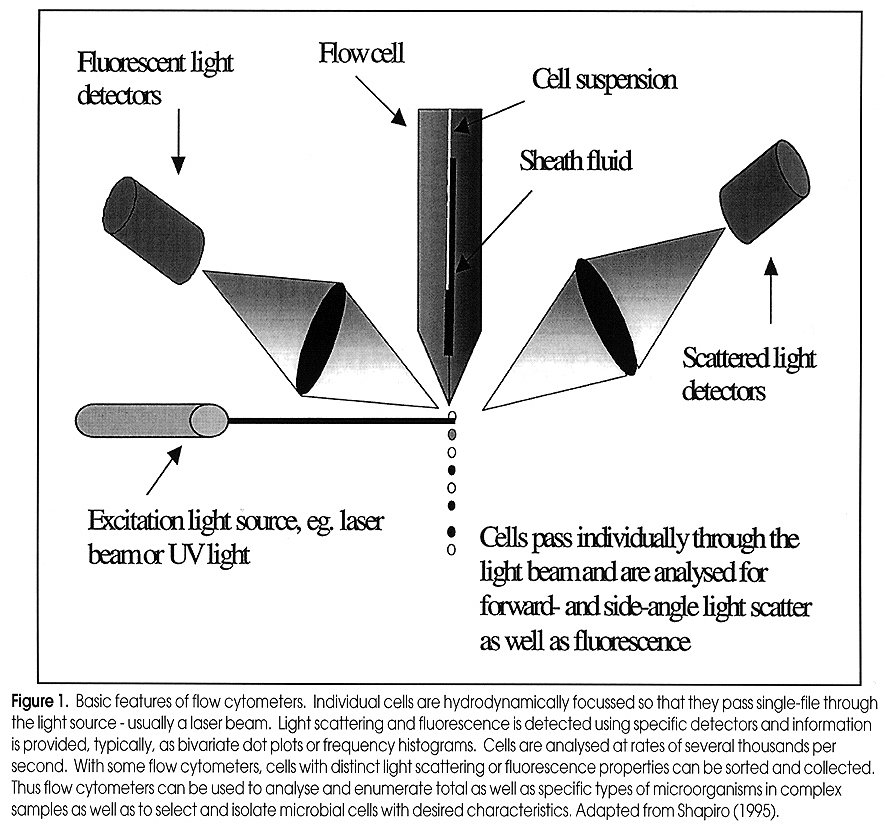
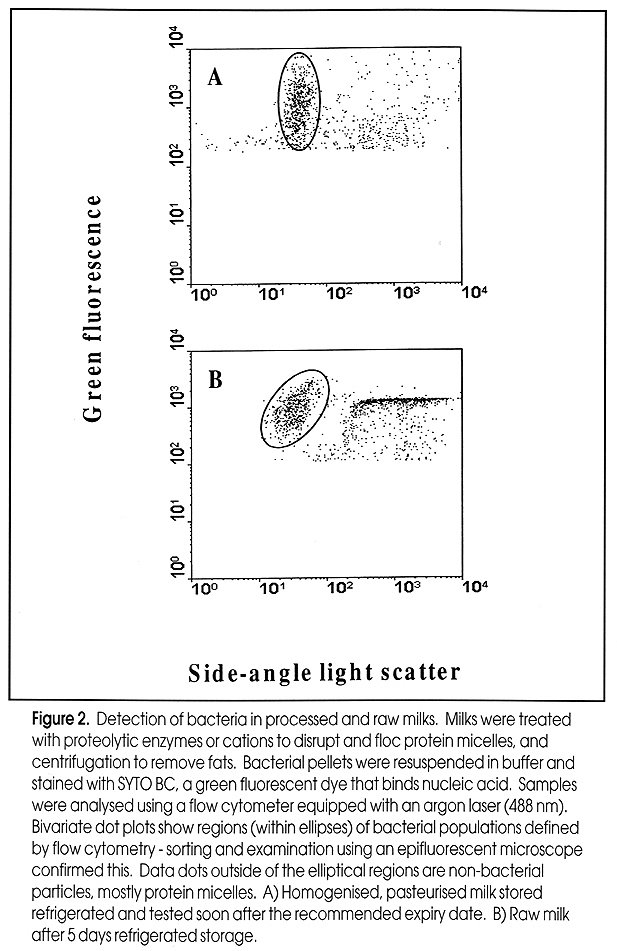
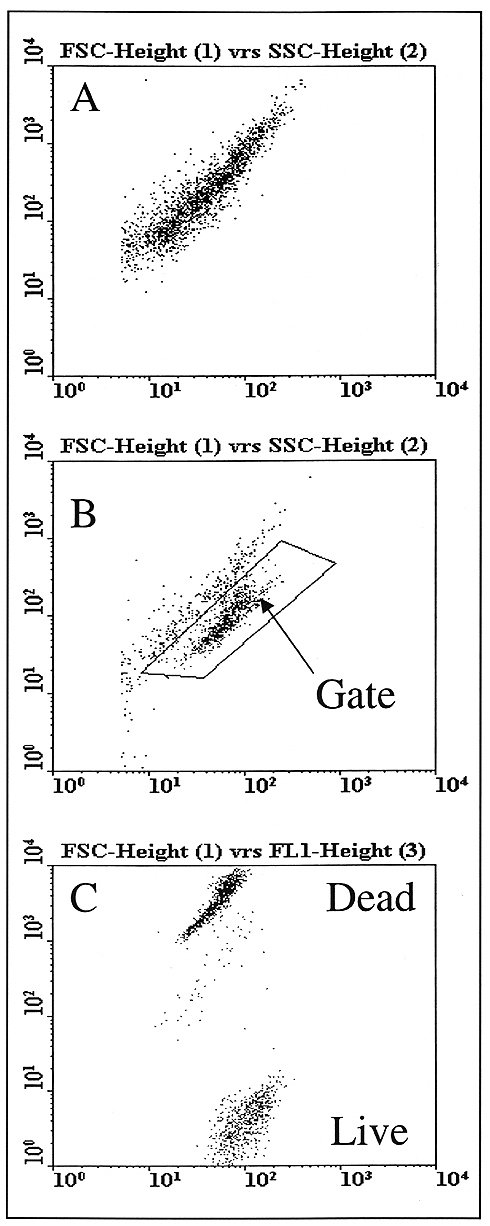
of Food and Beverage Industries Paul Attfield, Thusitha Gunasekera, Andrew Boyd, Dan Deere+ and Duncan Veal, Australian Environmental Flow Cytometry Group, Department of Biological Sciences, Macquarie University, Sydney, NSW 2109, Australia Correspondence to: P. Attfield, phone: +61 (0)2 9850 8156; Fax: +61 (0)2 9850 8253; E-mail: pattfiel@rna.bio.mq.edu .au; Web page: www.bio.mq.edu/au/flowgird< /A> +Current address: Dr. D. Deere, South East Water Ltd., P.O. Box 1382, Moorabbin, VIC 3189. Code Number:AU99011 Flow cytometry is a technology that allows analysis of individual cells within pure and mixed populations. Analytical rates can be up to several thousands of cells or particles per second. By combining flow cytometry with a range of fluorescent physiological and/ or molecular probes, it is possible to detect and enumerate specific cell types and/ or their activities in complex systems such as environmental, pathological and food samples. This article overviews recent developments in application of flow cytometry to food and beverage microbiology. With ongoing improvements in both cytometer instrumentation and probes for analysing microorganisms in different types of samples, it is evident that this technology promises to make a major contribution to fundamental and applied aspects of food and beverage microbiology in the coming years. The Basics of Flow Cytometry Basic features of flow cytometers are shown in Fig. 1. The reader is referred to Shapiro (1995) for detailed description of the theory and design of flow cytometers. The basis of the flow is a jet of isotonic sheath fluid that is about 100 µm in diameter and which travels at about 20 Km per h. Samples to be analysed are injected into the flow stream at a controlled rate, typically between 10 and 60 µl per min - although rates of up to 200 µl per min have been used. The slower moving sample is hydrodynamically focussed at the centre of the rapid flow stream, creating a laminar flow of cells that move single file into the cytometer. Figure 1: Basic features of flow cytometers. Individual cells are hydrodynamically focussed so that they pass single-file through the light source - usually laser beam. Light scattering and fluorescence is detected using specific detectors and information is provided, typically, as bivariate dot plots or frequency histograms. Cells are anlaysed at rates of several thousands per second. With some flow cytometers, cells with distinct light scattering or fluorescence properties can be sorted and collected. Thus flow cytometers can be used to analyse and enumerate total as well as specific types of micro-organisms in complex samples as well as to select and isolate microbial cells with desired characteristics. Adapted from Shapiro (1995) The cytometer consists of a light source and a series of detectors. As cells pass single file through a focussed light beam that is directed at right-angles to the flow stream, various detectors measure how much light is scattered and how much fluorescence at various wavelengths is emitted by individuals (Fig. 1). Light sources used commonly emit either UV, blue (argon laser, 488 nm) or green (helium-neon laser, 544 nm) light. The detectors vary in type and arrangement but typically flow cytometers measure light scattering at a narrow angle (forward scatter, FSC), light scattering at a wide angle (side scatter, SSC) and light emitted at wavelengths longer than that emitted by the light source, i.e. fluorescence. Fluorescence of cells is channeled to specific detectors. Many flow cytometers will measure fluorescence in green (FL1), orange (FL2) and red (FL3) wavelength ranges. However some flow cytometers measure only three parameters whilst others measure up to seven parameters, depending on light sources and detector types employed. For each cell the amount of light reaching the FSC, SSC and FL detectors is recorded and displayed by a computer, most commonly as dot plots or event-frequency histograms. Parameters can be measured on linear or logarithmic scales and are presented as arbitrary units. Manipulation of instrument settings through computer control allows specific cell populations (and individuals) to be defined in-run. Regions can then be created allowing for statistical analysis of sub-populations or the gating of populations for greater resolution and cell sorting. Gating permits the combination of more than two parameters for defining cell populations, and involves displaying or not displaying data on one bivariate plot depending on the values of data from the same samples, but different parameters on other bivariate plots. If microbial cells are being detected in a background of non-microbial particles, it is possible to gate the cytometer to ignore the light scattering and fluorescence properties of background events and to only display those properties exclusive to microbial cells. In this way the flow cytometrist can analyse total and specific microorganisms within complex mixed systems that contain other types of particles. This allows detection and enumeration of microbial cell types. Moreover, it is possible with some flow cytometers to capture specifically the microorganisms of interest, often in a viable state, by using fluorescence activated cell sorting (FACS). This technique relies on gating of the population of interest and its physical isolation by the cytometer. Sorted microorganisms may be further analysed by microscopy or cultured in pure form. Detecting Microorganisms and Microbial Activities by Flow Cytometry In most cases discrimination of target cell types from other cells and particles is achieved using fluorescent labels. These are numerous and this overview will only discuss some examples. The reader is referred to Shapiro (1995) and Haugland (1996) for further information on the enormous breadth of fluorescent probes available for cells. For obtaining total counts, generic dye stains can be used to distinguish cells from non-cells. The most commonly used generic stains are those that bind to nucleic acids. These include acridine orange, which binds to DNA and RNA, and diamidinophenylindole (DAPI) and Hoechst dyes that bind to DNA. These dyes diffuse into live and dead cells. The use of DAPI and Hoechst dyes is restricted to flow cytometers that employ UV light sources. Acridine orange is also problematic in that it binds to non-cell particles giving a high background staining and hence a more difficult detection of microbes in samples. Limitations of the foregoing dyes have been overcome by the advent of other dyes such as the SYTO nucleic acid stains (Haugland, 1996). These are cell permeant, bind to DNA and RNA, exhibit low background staining and are excitable at wavelengths emitted by lasers that are commonly used in flow cytometers. If cells can be fixed and permeabilised prior to staining and analysis, a wider choice of nucleic acid stains is available. These include propidium iodide and ethidium iodide which emit at red wavelengths, but which are both excluded from live cells. SYTOX dye behaves similarly but emits at the green wavelength. Generic dyes can also be used to discriminate cells in different physiological states. The most common application is the determination of viability, which can be assessed through mechanisms of dye exclusion, membrane potential, enzyme activity and respiratory activity. Viable cells have intact membranes that exclude dyes such as propidium iodide and SYTOX. However, if membrane integrity is lost these dyes enter the cell and concentrate in nucleic acids within the cells. Thus permeable, non-viable cells become fluorescent. Other types of dyes concentrate in, or are excluded from, cells depending on the trans-membrane potential (more negative inside the cell). Cationic dyes such as rhodamine 123 concentrate in live cells, whereas anionic dyes such as those of the oxonol group are excluded. Thus dyes can be chosen to give positive or negative staining depending on the membrane potential of cells. Also, dyes that are excited at the same wavelength, but which fluoresce at different wavelengths can be used in combination to dual stain cells. In this way it is possible to combine a "live" cell staining with "dead cell" staining to increase confidence in the assay. Detection of enzyme activity is another means of determining presence and "health" of microbial cells. Many esterified fluorochromes remain non-fluorescent until cleaved by intracellular enzymes. The most commonly used are based on fluorescein diacetate, which is cleaved to release fluorescein. Fluorescein diffuses readily across membranes resulting in loss of fluorescence intensity from active cells and increase in non specific staining of dead cells and non-cellular particles. Therefore, esterase substrate dyes that have high intracellular retention have been developed (Haugland, 1996). These include carboxyfluorescein diacetate and chloromethyl fluorescein diacetate. Using these derivatives, live cells are detected by a combination of functional internal enzyme and intact membrane. The reliance of the method on two viable cell parameters increases the confidence of this approach. Moreover the dependence on enzyme activity for fluorescence means that these dyes are less prone to non-specific binding and fluorescence than, for example, the nucleic acid binding dyes such as propidium iodide. To identify specific cells, molecular labels are used that selectively target a desired cell according to its distinctive biochemical, molecular genetic or structural properties. Such properties include enzyme activities, epitopes and nucleic acid sequences. Immunological label methods are useful for flow cytometric detection, enumeration and purification of specific microorganisms. These procedures involve conjugation of fluorochromes to antibodies. Most commonly, fluorescein isothiocyanate (FITC, green), phycoerythrin (PE orange) are used for fluorescent labeling of antibodies for application in flow cytometers equipped with a 488 nm argon laser (Haugland, 1996). Due to the potential sensitivity of flow cytometry and cell sorting it should be possible to detect very low numbers of specific microbes, whether they be healthy or damaged, without the need for enrichment procedures that often can take several days using standard culturing methods. Fluorescent in situ hybridisation (FISH) targeting of DNA sequences that code for ribosomal RNA of prokaryotes or eukaryotes, or specific sequences for particular genera offers an alternative approach where suitable antibodies may not be available for microbial detection. This method employs oligonucleotide sequences carrying fluorochromes such as FITC and CY3 (orange) (Haugland, 1996). Design of oligonucleotide sequences used for FISH relies on knowledge of the sequences of ribosomal RNA (rRNA) genes, which have been used as a basis for phylogenetic classification of microorganisms (Amann et al., 1995). Because rRNA content of cells is correlated with growth rate and activity, FISH is a useful indicator of the presence of viable microorgansims (Wallner et al., 1993). Examples of Flow Cytometry Applications in Food and Beverage Microbiology Routine microbiological surveillance is essential to ensure safety and quality of foods and beverages. Current practices rely heavily on microscopic analyses and counting, or manual inspection of media to detect visible microbial growth. Viable counts, turbidometry or most probable number techniques are commonly used to enumerate active bacteria from raw materials, production and experimental samples (Vasavada, 1993). These techniques were developed, in principle, over a century ago. The reliance on a period of incubation (typically between one day and several weeks) for growth of organisms to achieve detectable levels means these methods are at best slow and laborious. Moreover, for various reasons bacteria can become unresponsive to culturing methods. For example, health risks arise from failure to monitor waterborne pathogens because most species of pathogenic bacteria including Salmonella enteritidis, Vibrio cholerae, and V. vulnificus (Roszak et al., 1984; Colwell et al., 1985; Oliver et al., 1991), quickly enter viable but non-culturable states upon release into water or exposure to low temperature, thereby avoiding detection by standard means. Even where rapid detection methods do exist (e.g. ELISA and PCR), they often require time-consuming steps for selection and enrichment of specific microbes in order for confirmatory testing. Alternatively, non-direct methods have been applied, such as ATPase-dependent bioluminescence and dye reduction assays. However, it is doubtful whether these methods are completely reliable and accurate as they are subject to interference from non-microbial factors, e.g. contamination with molecules and activities derived from other biological materials in samples (Griffiths, 1993; Muir, 1996). Also, a major limitation of many of the rapid methods in microbiology is the lack of, or limited ability to enumerate/ quantify microorganisms. Flow cytometry coupled with different staining methods offers opportunities for rapid (minutes to hours) and diverse microbiological analysis of samples. As described above, there are various tools for detecting, enumerating and isolating total, viable, viable but non-culturable and specific microorganisms from pure or mixed cultures in non-particulate and particulate fluid samples. The following are some of the examples where flow cytometry has been demonstrated to be of potential value to food and beverage microbiology. Milk and dairy products Biological monitoring of raw milk involves analysis of somatic and microbial cells, and is essential for milk and dairy quality assurance (in-process and end-product). It impacts on issues of shelf life and safety of dairy products as well as on the determination of the type of product for which raw milk is to be used (Muir, 1996). A high biological count in raw milk alerts the dairy processor to possible problems with product safety (Sørhaug and Stepaniak, 1997). Currently direct microscopic counts or automated instruments are applied to somatic cell counts in raw milks. Detection and enumeration of microbial contaminants still relies heavily on conventional culture methods such as plate counts and most probable numbers, or application of indirect methods such as bioluminescence and redox staining. These methods are either time consuming or do not provide complete quality and safety assurance (Vasavada, 1993). Currently there is no single technology or instrument that can be applied to somatic and microbial cell analyses or enumeration and differentiation of microbial contaminants in raw milk. Flow cytometry offers the possibility for single-instrument, rapid analyses of these parameters. Increased speed of the analysis reduces the storage period and finally the holding cost. Although flow cytometry offers faster analysis of samples, this technology has not been used until recently for detection of bacteria or somatic cells in dairy industry. This may be mainly due to the fact that flow-cytometric analysis of bacteria in milk is subject to certain difficulties, particularly optimisation of instrument set-up, resolution limit of flow cytometers (Donnelly and Baigent, 1986), and difficulty of staining bacteria in the presence of fat and protein micelles in milk (McClelland and Pinder, 1994). Nevertheless, automatic flow cytometry-based methods have been applied to analysis of raw milk (Suhren and Walte, 1998), although the specialised type of instrument (Bactoscan-FC) and analytical method used is limited to total bacterial counts. In fact, flow cytometers offer much greater potential for detecting and enumerating total and sub-groups of microorganisms present in raw and processed milks. For example, we have developed a rapid (<1 h) method using flow cytometry, which can be used to detect bacteria in processed milk as well as raw milk (Fig 2). This assay involves enzymatic clearing of milk proteins and physical removal of fat from the sample prior to staining and analysis by flow cytometry. The flow cytometry assay correlated very strongly (R2 =>0.98) with standard plate counts and direct microscopic counts across a range 103 to 108 bacterial cells per mL of milk (Gunasekera et al., manuscript in preparation). Using the developed method it was possible to enumerate bacteria at levels below the cutoff point (<5 x10⁴ per mL) for good quality raw milk (Hubble, 1997). We have also found this flow cytometry based assay is suitable for monitoring the growth of bacteria in homogenised, pasteurised milk and flavored milk drinks (unpublished data). Thus there is potential for flow cytometry to be used as a predictive method for shelf life. Others have shown that by applying fluorescent antibody technology, it is possible to detect low numbers of specific microorganisms such as pathogens (Pinder and McClelland, 1994; Clarke and Pinder, 1998). The ability to use a single instrument for numerous rapid microbiological assay procedures has obvious advantages for the dairy industry. Figure 2: Detection of bacteria in processed and raw milks. Milks were treated with proteolytic enzymes or cations to disrupt and floc protein micelles, and centrifugation to remove fats. Bacterial pellets were resuspended in buffer and stained with SYTO BC, a green fluorescent dye that binds nucleic acid. Samples were analysed using a flow cytometer equipped with an argon laser (488 nm). Buvariate dot plots show regions (within ellipses) of bacterial populations defined by flow cytometry - sorting and examination using an epifluorescent microscope confirmed this. Data dots outside of the elliptical regions are non-bacterial particles, mostly protein micelles. A) Homogenised, pasteurised milk stored refrigerated and tested soon after the recommended expiry date. B) Raw milk after 5 days refrigerated storage. Contamination of fermented milk products by yeasts and moulds is a concern for product shelf life and safety. Standard testing methods involve plating of samples and culturing for a minimum of 2 days (Laplace-Builhé et al., 1993). This does not allow fast release of short-shelf life products. Experiments involving artificial contamination of cottage cheese and buttermilk yoghurt with vegetative yeast cells and mould spores showed that flow cytometry could detect contamination at <5 counts per gram of sample, which is way below the level of 100 counts per gram, considered to be significant (Laplace-Builhé et al., 1993). Growth of yeasts in yoghurt stored at 30oC (storage trial conditions) could be followed accurately by flow cytometry indicating that this technology can be used as a predictive tool for product shelf life (Laplace-Builhé et al., 1993; Mulard, 1995). Microbial contamination is not the only aspect of dairy microbiology where flow cytometry can be useful. For example, it has been demonstrated that flow cytometry methods can be used to detect variation in viability and growth rates of yoghurt starter cultures during industrial fermentation (Laplace-Builhé et al., 1993). The flow cytometry method correlated more closely with direct microscopic counting than plate culturing and counting. Flow cytometry is in fact more rapid and objective than microscopy and methylene blue staining (the standard method for direct viability counting). Furthermore, the methylene blue method is known to overestimate viability when injured or stressed cells are being assayed, and the flow cytometry methods appear to be more accurate in these circumstances. This is important given that dairy starter cultures may be lyophilised or frozen prior to inoculations. Frozen vegetables The aim of food preservation methods such as freezing is to limit physico-chemical changes that occur during storage of foods. In vegetable products, natural bacterial flora can become responsible for spoilage. Inhibition or decrease in viable numbers of microorganisms is one important aim of freezing. During production of frozen vegetables, procedures for washing and blanching are employed to minimise bacterial activity. For the most part counting of bacteria takes up to 48 h post sampling, which means that it is difficult to monitor processing in real time. By applying flow cytometry methods it is possible to provide within 30 min, accurate bacterial counts within the specification range of 1 to 5 x 10⁵ organisms per gram for frozen vegetables, and to monitor efficiencies of blanching processes (Laplace-Builhé et al., 1993). This should allow verification of process efficiency in real time. Soft drinks and fruit juices Preliminary work by Pettipher (1991) using a ChemFlow system that determines viable target cells (microorganisms) by a combination of flow cytometry and fluorogenic substrates, indicated that yeasts could be detected at levels as low as 50 per mL in lemonade, 6.3 x 10³ per mL in orange juice and 1.4 x 10⁴ per mL in tomato juice. Assay times were less than one hour. Varying limits of detection for different soft drinks and fruit juices are likely to result from factors such as variable particulate nature of drinks (e.g. orange juice and tomato juice contain fibrous materials whereas lemonade does not). Also, background colour and potential autofluorescence of materials, and physico-chemical properties such as acidity, osmotic pressure and ionic strength affect staining. Mulard (1995) reported the development of a simultaneous labelling technique for yeasts and bacteria in ultra-high temperature treated fruit juices. It was claimed that the system developed is capable of detecting a contamination of three yeasts or bacteria per L pack of fruit juice after a 48 h incubation at 30oC. A contamination of one yeast per mL was detected after 24 h incubation. These studies indicate the potential for application of flow cytometry-based methods in microbiological analysis of soft drinks and juices both in retrospective testing of products from production sites and ultimately for in-line testing of samples during manufacture. Yeast fermentation industries Industries such as baking, brewing, winemaking and distilling rely on strong fermentative activity of yeasts (mostly Saccharomyces spp.). It is important to be able to predict the fermentative activity of a batch of yeast as this parameter will have major impact on process efficiency. For example, the production of beer involves fermentation of brewer's wort by specific yeast strains. Often the yeast biomass will be saved after a fermentation and re-inoculated (repitched) into fresh wort. Repitching of yeast biomass can occur for several cycles and is an important economic saving for the brewery (Reed and Nagodawithana, 1991). In order to carry out repitching efficiently, it is important to know the viability and vitality (fermentative activity) of the yeast biomass. Viability is traditionally assayed in breweries using methylene blue dye exclusion and microscopy, but this procedure is tedious to perform, operator-dependent and has long been known to be reliable only if the culture is highly viable (Pierce, 1970). Unreliability of the method is a concern for example, if yeast for repitching is falsely predicted to be highly viable, because the subsequent fermentation will not proceed with economic efficiency. Flow cytometry offers an alternative rapid and operator independent method for assaying yeast viability (Deere et al., 1998). Fig. 3 shows the distinction of yeast cells from other matter in brewer's wort, and the ability to determine viability of the individual yeast. Flow cytometry can assay tens-of-thousands of yeast cells within 5 min whereas the microscopic method can only assay a few hundred cells. Thus, it is possible to obtain more reliable data on yeast for repitching using flow cytometry than it is using methylene blue and microscopy. Others have also shown the potential for flow cytometry to determine viability and predict performance of yeasts for beer, wine and cider fermentations (Bruetschy et al., 1994; Jespersen and Jakobsen, 1994; Dinsdale et al., 1995). Figure 3: Discrimination of yeast cells from wort particles, and rapid assay of yeast viability using flow cytometry. Yeast cells scatter light differently from other particles in wort and so are separable on light scatter characteristics alone. Yeast cells that are "live" exclude oxonol and do not fluoresce significantly in the green channel (FL1). Damaged or dead (non-vital) cells lose their membrane potential and are stained with the dye leading to marked green fluorescence. A) Light scattering of brewer's wort with no yeast. B) Light scattering of brewer's wort with yeast added. The region defining yest prticles is defined by the polygon and used to gate the flow cytometer for fluorescence analyses. This means that the flow cytometer only presents data on particles falling within the gated region. C) Green fluorescence characteristics of gated yeast particles, showing clear separation of live (low fluorescence ) and dead (high fluorescence ) yeasts. Determination of cell viability does not automatically indicate vitality or high level physiological activity (fermentative power) of yeasts. Therefore brewers attempt to predict vitality of pitching yeast. Traditionally this involves measurement of fermentation products (CO2 and ethanol), assay of glycogen levels or of ergosterol content of yeast biomass (Boulton, 1996). However, none of these tests accurately predicts vitality and all involve relatively long processes when compared with flow cytometric analyses. Flow cytometry in combination with suitable fluorescent dyes that measure physiological fitness or vitality of yeast have been used to measure in-process brewing performance of yeast (Breeuwer et al., 1994; Edwards, 1996). This gives the brewer the opportunity for real time measurement of yeast parameters such as membrane potential, permeability and esterase functions prior to pitching and during brewing. Another potential area for application of flow cytometry is the determination of microbial contaminants of beer. Lactic acid bacteria are potential spoilage organisms and rapid detection at low levels is required in order to facilitate decision making in beer packaging and transport. Whilst there are no current examples of flow cytometric detection of bacteria in beer, we envisage that it would be possible to develop methods for this. For example it may be possible to apply FISH technology to beer, to allow detection of bacterial ribosomal RNA sequences. Similar technology could also be applied to detection of wild yeasts using distinctive ribosomal RNA sequences not found in brewing strains of yeast (Bertin et al., 1990). Modification of yeast strains for industrial applications most commonly involves sexual mating or fusion. These both rely on mixing of two or more different strains, time for formation of hybrid strains, and subsequent selection of the hybrids from the mixture of parental or original cells. A major obstacle to the success of these classical genetic approaches, is the fact that industrial yeast strains do not contain convenient phenotypic markers that allow for easy selection. To circumvent this problem we have used cell tracking dyes and flow cytometry with cell sorting to select rare hybrid yeast cells from amongst a mixed population of parental cells (Bell et al., 1998). We stained one parent type fluorescent green and another type fluorescent orange using dyes that bind to cells without causing inhibitory effects or without leaking from one cell to another. Using this approach we were able to isolate 50 hybrids from a background of 2 x 10⁶ mixed parental yeast cells. Prospects Flow cytometry is coming of age as a technology for microbiologists. Continuing improvements in cytometer instrumentation and in the available range of fluorescent dyes and molecular probes are making it possible to determine (qualitatively and quantitatively) the identities, viability, specific functional activities and overall physiology of microbes. Advances in the range of fluorogenic substrates available for differentiating microbial species, plus combination of fluorescent tagging with specific genome sequence, allow for highly accurate and sensitive detection of microorganisms in food and beverage samples - including those that are non-culturable but which have potential for spoilage or pathogenicity. Moreover, application of flow cytometry-based cell biology methods will assist in determination of traits that are important for functionality of microorganisms in processed food and beverage manufacture. Coupled with cell sorting technology it is possible to use flow cytometry for selecting and isolating novel strains for industrial applications. The technology therefore has tremendous potential for aspects of food and beverage quality, safety and production efficiencies. References
Copyright 1999 Australian Biotechnology Association Ltd. The following images related to this document are available:Photo images[au99011a.jpg] [au99011c.jpg] [au99011b.jpg] |
| |||||||||
