 |
| About Bioline | All Journals | Testimonials | Membership | News |
|
||||||
|
||||||
Purification of the restriction endonuclease sac I, free of Sac II and sac III contaminants Raysa Vazquez, Jose Brito and Maribel Guerra Division of Industrial Biotechnology, Center for Genetic Engineering and Biotechnology, P.O. Box 6162, Havana, Cuba. Recibido en marzo de 1995. Aprobado en septiembre de 1995
Code Number: BA96005
Size of Files:
Text: 19.5K
Graphics: Line Drawing (gif) - 11K
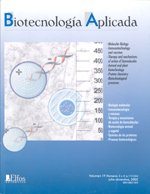
Photographs (jpg) - 225.8K ABSTRACT The restriction endonuclease Sac I was isolated from Streptomyces achromogenes and was purified to homogeneity, until no contaminant nuclease activities were detected. On the basis of ion exchange chromatography (Q-Sepharose and phosphocellulose P-11), Sac I can be obtained with a high level of purity and used in molecular cloning. The practical utitlity of Sac I enzyme is given by a high stability, high yield, easy handling of producing cells, and the ability to recognize new sequences, such as GAGCTC. The molecular weight (MW) of this enzyme was estimated by High Performance Liquid Chromatography and SDS polyacrylamide gel electrophoresis, being of about 50 kDa approximately. According to the results obtained from the accelerated stability study, the enzyme preparation is stable for at least 20 months. Key words: Restriction endonucleases, purification, Sac I RESUMEN La enzima de restriccion Sac I se aislo del microorganismo Streptomyces achromogenes y se purifico a homogenidad, libre de nucleasas contaminantes. Empleando la cromatografia de intercambio ionico (Q-sefarosa y fosfocelulosa P-11), la Sac I pudo ser purificada con alto grado de pureza y usada en experimentos de clonaje. La utilidad practica de esta enzima es su gran estabilidad, alto rendimiento, facil manipulacion de las celulas productoras y la habilidad de reconocer secuencias, tales como GAGCTC. El peso molecular de esta enzima se estimo por cromatografia liquida de alta resolucion y por electroforesis en geles de acrilamida, siendo de alrededor de 50 kDa. La preparacion enzimatica fue estable al menos 20 meses, según el ensayo de estabilidad acelerado. Palabras claves: Endonucleasas de restriccion, purificacion, Sac I Introduction Restriction endonucleases are enzymes, isolated chiefly from prokaryotes, that recognize specific nucleotide sequences within doublestranded DNA and cleaves it at these sites. These socalled restriction endonucleases facilitate the specific fragmentation of doublestranded DNA and are very useful for DNA sequence analysis (1). These enzymes can be classified into three groups. TypeI and type III enzymes carry a modification (methylation) and an ATPrequiring restriction (cleavage) activity within the same protein. Both types of enzymes identify unmethylated sequences in substrate DNA, but type1 enzymes cleave randomly, whereas typeIII enzymes cut DNA at specific sites. TypeII restriction/modification systems consist of a separate restriction endonuclease and a modification methylase. In the last 20 years, a great number of typeII restriction enzymes have been isolated, many of them useful in molecular cloning. These enzymes cut DNA within or near their particular recognition sequences, which are typically four to six nucleotides long with two axis of symmetry. Among these enzymes, Sac I is isolated from Streptomyces achromogenes. This microorganism produces two other restriction enzymes, Sac II and Sac III. Sac I recognizes the hexanucleotide sequence 5'...GAGCT[down arrow]C...3' and cleaves it at the position marked by the arrow (2). A restriction enzyme preparation must be invariably free of any undesirable nuclease, and must also be stable (3). The accelerated degradation assay is the most widely used method for predicting the stability of a biological product (4). The objective of the assay is to use the fitted Arrhenius equation in order to predict the degradation rate of the restriction endonuclease at the temperature at which it is commonly stored. A high level of stability is essential in any biological standard and this is also desirable in restriction endonucleases. The Sac I enzyme is commercially available, but its purification has not yet been reported. Here, we report the purification and partial characterization of the specific endonuclease Sac I involved in a restrictionmodification system (5, 6). Materials and Methods Strains Streptomyces achromogenes strain ATCC 12767 was grown at 28 oC in a 50 liter fermenter, ATCC medium # 5 [0,33 g/L of Yeast extract, 0,33/L g of LabLemco, 0,67 g/L of Tryptone and 3,33 g/L of Glucose] and the growth was stopped at the stationary phase. lambdaDNA lambdaDNA was purified in our laboratory from the CSH45 strain, (Cold Spring Harbor Collection), according to the procedure of Silhavy et al., 1984 (7). Plasmid DNA Plasmid pCB121 was constructed in our laboratory (the plasmid is a pUC18 derivative, not cleaved by Sac I enzyme). Oligonucleotides DNAs were synthesized at CIGB (Havana, Cuba); deoxynucleoside triphosphates (dNTPs) were from Boehringer. [ganma-32P] ATP was purchased from Amersham. Enzymes T4 DNA Ligase was purified in our laboratory (8). Chemicals Q Sepharose Fast Flow was purchased from Pharmacia (Sweden); Phosphocellulose P11 was purchased from Whatman (England); Agarose was from Sigma Ltd (USA), and TSK3 000 SW was from Toyo Soda (Japan). The other chemicals were purchased from Merck, Sigma, and B.D.H. Chemicals Ltd. Purification of Sac I S. achromogenes cells (80 g) were thawed and resuspended in two volumes of buffer Q [10 mM Tris HCl pH 8; 0,1 mM EDTA; 10 mM 2mercaptoethanol; 5 % glycerol, and 0,02 mM benzamidine and 0,02 mM PMSF]. Then, the cells were disrupted by explosive decompression in a French press. As a result, a crude lysate, free of debris, was obtained by centrifugation at 40 000 rpm for 1 h, at 4 C. Proteins were later precipitated with (NH4)2SO4 at 40 % saturation. The precipitate was collected by centrifugation and redissolved in a Q buffer (about 30 mL) and dialyzed against a Q buffer during 12 h, at 4 C. The sample was applied to an 80 mL QSepharose Fast Flow column, equilibrated with the same buffer. After washing with ten column volumes, bound proteins were eluted with a linear gradient combining pH and ionic strength of 100 mM NaCl pH 8650 mM NaCl pH 7,4 (400 mL), at a flow rate of 80 mL/h. The Sac I activity was pooled and dialyzed against buffer PC [10 mM KH2PO4 pH 7,5; 0,1 mM EDTA; 7 mM 2mercaptoethanol; 5 % glycerol] during 12 h, at 4 C. This pool was applied to a 36 mL phosphocellulose P11 column, which had been previously equilibrated with the PC buffer. The column was then washed with ten column volumes of the PC buffer. A linear gradient from 0 to 1M NaCl was developed in PC buffer and applied to the column. The active enzyme Sac I eluted at about 400 mM NaCl. The fractions containing the activity were pooled and the final preparation of the enzyme was concentrated against PEG 20 000, and then dialyzed against the storage buffer [20 mM Tris HCl pH 8; 150 mM KCl; 0,1 mM EDTA; 1 mM DTT; 50 % glycerol, and bovine serum albumin to a final concentration of 500 microg/mL]. A 7,5 x 600 mm column of TSK3 000 SW, previously calibrated with several proteins of known molecular weight (bovine serum albumin 67 kDa; ovalbumin 43 kDa, trypsinogen 21 kDa and ribonuclease A 18 kDa), was used to estimate the molecular weight of the native protein. To do this, the column was equilibrated in buffer A [10 mM TrisHCl pH 7,2; 0,1 mM EDTA; 10 mM 2mercaptoethanol and 150 mM NaCl]. Assay for restriction enzyme activity To quantify the enzyme activity at each step of the purification process, the standard technique of separating the cleaved DNA fragments by agarose gel electrophoresis was used, aliquots of 1 microL from each fraction were added to 20 microL of reaction mixtures containing the specific buffer and 1 microg of lambdaDNA. After incubation for 1 h at 37 oC, the reactions were terminated by the addition of 2 microL of a solution containing 0,05 M Na2EDTA (pH 8), 15 % glycerol, and 0,02 % bromphenol blue. Samples were submitted to electrophoresis on slab gels consisting of 1,4 % agarose in Tris acetate and 0,5 microg/mL ethidium bromide. The resulting DNAbanding pattern was visualized by ethidium bromide fluorescence under shortwave ultraviolet light. Thus, one unit of the enzyme was defined as the amount required to completely digest 1 microg of lambdaDNA in 1 h, at 37 C. Assays for the presence of contaminating nucleases In addition to the assay to measure the activity of the restriction enzymes,the following assays are performed throughout the purification process to determine in which chromatographic fractions exonucleases and nonspecific endonucleases are located. The careful assessment at each step of the ratios of the activities enables pooling of the maximum restriction endonuclease activity and the minimum of contaminating activities. Assay for Nonspecific Endonuclease A sample, usually of 5 microL, is incubated with 1 microg of pCB121 plasmid for 6 h, in the standard restriction endonuclease assay buffer, in a volume of 0,02 mL. Therefore the cleavage of a single phosphodiester bond in the DNA by a contaminating endonuclease is detected by converting the DNA form I to the DNA form II. Assay for Exonuclease Contaminations Different amounts of Sac I (35, 25 and 15 units) were incubated (usually 3 h) with 100 fmoles of an oligodeoxyribonucleotide (oligo 40 mer), labeled at the 5' end with [ganma-32P] ATP, in the standard assay buffer in a volume of 100 microL at 37 C. The reactions were then analyzed by proteins electrophoresis. Assay for phosphatase The test for phosphatase activity was carried out as follows: Different amounts of Sac I (20 to 100 units) were incubated for 20 min at 37 C with 5 pmoles of [ganma-32P] ATP. After the incubation period, 1 microL of the reaction mixture was analyzed by thin layer chromatography in a polyethylenimine cellulose paper, which was developed with K2HPO4 750 mM pH 3,5. Under these conditions, it is possible to detect 106 units of phosphatase activity by one unit of Sac I enzyme. Accelerated stability study of the restriction enzyme Sac I This assay was carried out to predict a quantitative decrease of enzymatic activity in time. The test involves the incubation of the enzyme at different temperatures (4 oC, 15 oC, 25 oC and 37 oC). The measurement of the relative rates of degradation (decrease of enzymatic activity in time) was done essentially as described in Materials and Methods (Assay for Restriction Enzyme Activity), and the fitting of the Arrhenius equation was made in order to relate the degradation rate at high temperatures to the slow degradation rate at low temperatures (4). Other methods To estimate the molecular weight of the Sac I, 20 microg of the pure enzyme were analyzed onto 12,5 % SDSPAGE (10). After PAGE, the gels were stained with Coomassie blue. The protein concentration was quantified by the Coomassie blue method (11) using BSA as a standard. Results and Discussion Purification of the Restriction Endonuclease Sac I. The restriction endonuclease Sac I was purified 143fold with an overall yield of 16 % and a specific activity of 26 666 U/mg (Table 1). This already largescale purification scheme could easily be further scaled up. A major problem found with the purification of the Sac I enzyme was the presence of Sac II and Sac III in the final preparation. After (NH4)2SO4 precipitation, the Sac II and Sac III activities were removed, with only the Sac I activity remaining in the precipitate (Figure 1). The QSepharose column was used in order to increase the flow rate. Elution of the enzyme from Q Sepharose required about 400650 mM NaCl. After this step, pure Sac I was obtained, although, traces of nonspecific nucleases still remained . Table 1. Purification of the Sac I restriction endonuclease. A summary.
Purification  Total U   Protein  Total P. Spec.act.  Yield  Purif.
step            (U)     (mg/mL)    (mg)    (U/mg)     (%)   fact.
------------------------------------------------------------------
Crude         500000      53,7    2,685    186,0      100   1,00
extract

Ammon.        400000      26,0    1 040    385,0       80   2,00
sulfate

Q-seph        150000       3,2       96   1562,2       30   1,83

P-11           80000       1,5        3   26 666       16  143,36
The best purification was achieved on phosphocellulose. In this case, the enzyme was eluted from this column at about 450 mM NaCL, and a removal of most of the nonspecific nucleases after this step was also obtained. The Sac I enzyme appeared as a narrow peak of activity.
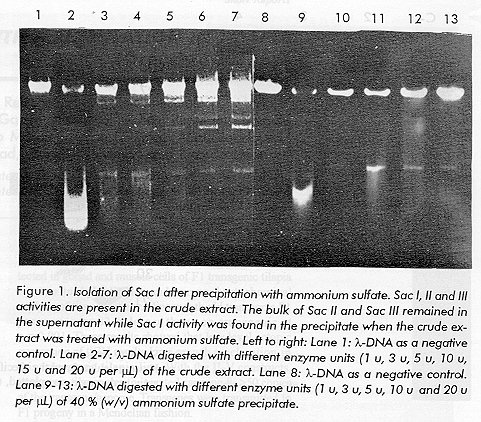
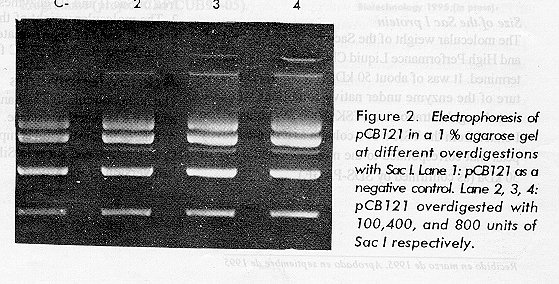
The results on Figure 2 show no evidence of nonspecific endonuclease activity, even with an 800fold overdigestion of the pUC18 plasmid. The integrity of the oligonucleotide demonstrates that there was no nuclease activity present in the preparation (Figure 3). The preparation was also free from phosphatases (data not shown). Our final product, with a specific activity of about 26 666 U/mg of protein, was free from nonspecific nucleases.
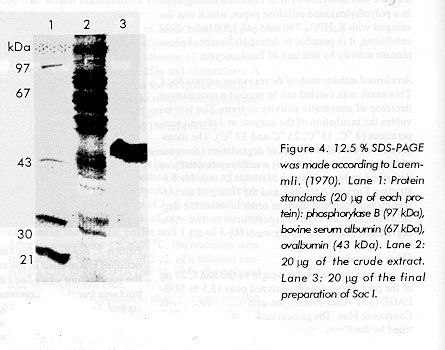
Figure 3. Nuclease test of Sac I preparation using [g32P] ATP labeled oligonucleotide l-DNA (1mg). Lane1: Oligonucleotide as a negative control. Lane 2: Oligonucleotide with 15 units of Sac I. Lane 3: Oligonucleotide with 25 units of SacI. Lane 4: Oligonucleotide with 35 units of Sac I. Comparison of the detection levels by SDSPAGE with the quantity of protein sample applied, indicates that the final preparation was highly pure. Batches of Sac I purified according to this procedure have been used successfully in our laboratory for cloning purposes (data not shown). Size of the Sac I protein The molecular weight of the Sac I by using SDSPAGE and High Performance Liquid Chromatography was determined. It was of about 50 kDa (Figure 4). The structure of the enzyme under native conditions was estimated by gel filtration on a TSK 3 000 SW column. Sac I eluted from the TSK 3 000 column as a single activity peak that corresponded to the monomer with a size of 50 kDa (as confirmed by SDSPAGE).
Stability study K was calculated and the specific rate of the enzymatic activity decrease was plotted, using log K against the absolute reciprocal temperature. As a result, the enzyme Sac I was stable at 20 oC for at least 20 months (Figure 5). The activity of enzyme was rechecked, and the data were conformed.
Conclusions
The authors would like to thank G. Reyes and J. Madrazo for the technical assistance. They also wish to thank, A. Suarez for the helpful computer program and Diana CruzBustillo and Ricardo Silva for revising the English version of the article.
The following images related to this document are available:Photo images[ba96005a.jpg] [ba96005c.jpg] [ba96005d.jpg] [ba96005b.jpg]Line drawing images[ba96005e.gif] |
| |||||||||