 |
| About Bioline | All Journals | Testimonials | Membership | News |
|
||||||
|
||||||
Biokemistri, Vol. 21, No. 2, Dec, 2009, pp. 85-93 Association Between Blood Pressure and some other Cardiovascular Disease Risk Factors in a Lean Black Population Chukwunonso E.C.C. EJIKE,*1,2 Chidiebere E. UGWU2,3 and Lawrence U.S. EZEANYIKA2,3 1Department
of Biochemistry, Michael Okpara University of Agriculture, Umudike, PMB 7267,
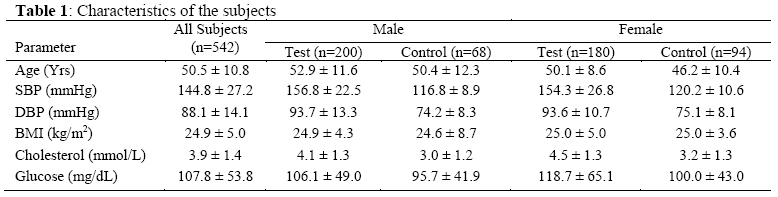
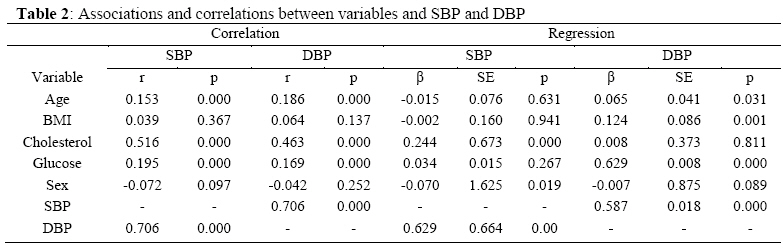
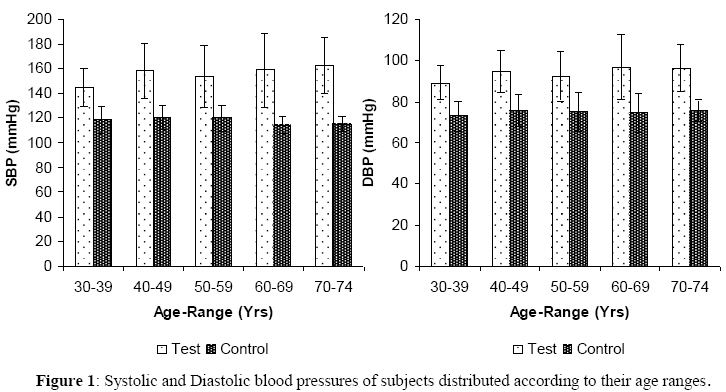
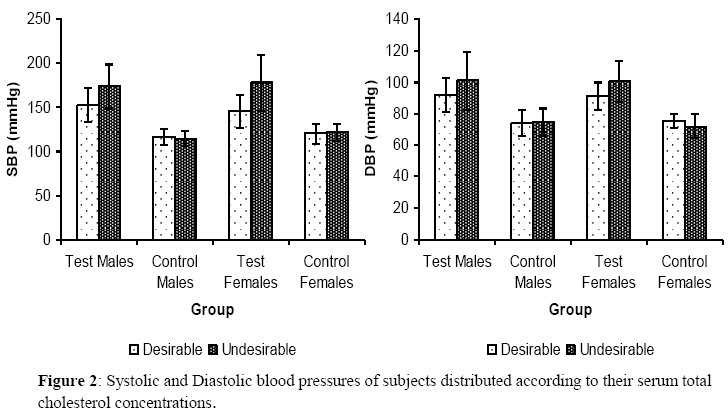
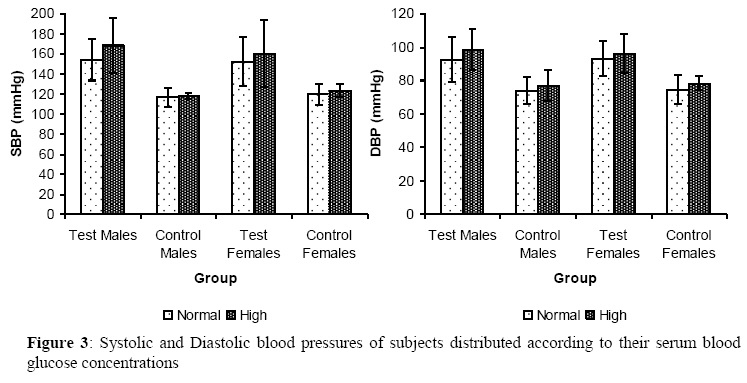
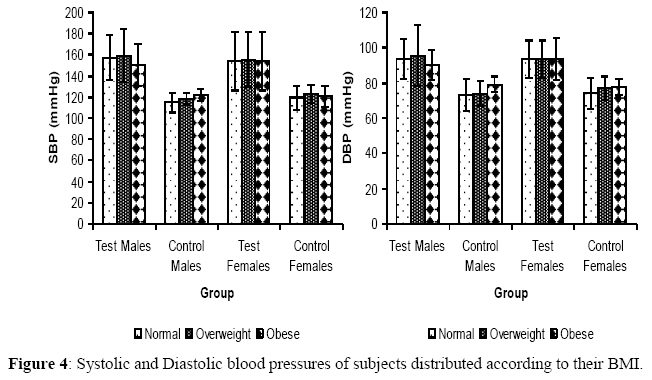
Umuahia, Nigeria Received November 20, 2009 Code Number: bk09012 Abstract Blood pressures, serum total cholesterol levels, blood glucose levels, anthropometric parameters and ages of five hundred and thirty eight adult Nigerians, living in two localities were measured using standard protocol. The mean age of the subjects was 50.5 ± 10.8 years while their mean body mass index (BMI) was 24.9 ± 5.0 kg/m2. Hypertensive subjects who had desirable serum total cholesterol levels had lower systolic blood pressure (SBP) (152.33 ± 19.55 mmHg, for males, and 145.60 ± 18.64 mmHg, for females) compared to those who had undesirable serum total cholesterol levels (174.02 ± 24.93 mmHg, for males, and 177.65 ± 31.11 mmHg, for females). For normotensive subjects, serum total cholesterol status did not significantly affect SBP. SBP in the hypertensive subjects was highest in the overweight group (159.17 ± 25.31 mmHg) and lowest in the obese group (150.69 ± 20.14 mmHg). In normotensive subjects, SBP did not change markedly between the BMI groups. Data on the effects of age and blood glucose levels are presented. Risk factors for hypertension may not affect individuals with and without the disorder linearly. The underlying mechanistic processes that link changes in these risk factors to their physiological consequences for blood pressure elevation and regulation deserve more attention Keywords: blood glucose, blood pressure, body mass index, serum total cholesterol *To whom correspondence should be addressed. E-mail:nonsoejikeecc@yahoo.com, ejike.nonso@mouau.edu.ng Tel: +2348036066777 INTRODUCTION The prevalence of cardiovascular diseases is increasing steeply in the developing world and may be related to the rapidly aging population, changing lifestyles and nutrition transition in those regions of the world1. Blood pressure (BP) is generally accepted to have a role in accelerating atherosclerosis of the blood vessels and thereby influencing cardiovascular disease2. Prospective cohort studies have demonstrated a strong association between blood pressure and stroke, ischaemic heart disease, renal disease and other cardiovascular diseases3-7. Globally high BP is estimated to cause 7.1 million deaths, about 13% of the total8. However, high blood pressure is still largely ignored as a public health problem in many developing countries9, despite the fact that such countries are increasingly faced with the double burden of hypertension and other cardiovascular diseases, along with infection and malnutrition8,10. Since developing countries cannot afford the high cost of treating hypertension and its sequelea in large portions of their population, appropriate preventive measures should be put in place to control risk factor levels in the general population and in individuals at risk11. Correlations between body mass index (BMI) and BP have been shown in Caucasian 12,13, African 14,15 and Asian 16,17 populations. Elevated BP has also been linked to serum total cholesterol levels and blood glucose levels 18-20. In fact, a lot has documented on the correlates of blood pressure and its co-morbid conditions. However, whether the risk factors – age, gender, BMI, serum total cholesterol concentration and blood glucose concentration – affect hypertensive individuals and normotensive individuals alike, has not been given appropriate attention, especially in lean populations of Africa. This study investigates our hypothesis that these risk factors affect individuals with and without hypertension disproportionately. SUBJECTS AND METHODS Nigerian men and women aged 30-74 years were studied. The participants were from Anyigba (Kogi state) and Nsukka (Enugu state) – both states are geographically neighbours with Kogi bordering Enugu to the North Anyigba and Nsukka are host towns to the Kogi State University and the University of Nigeria, respectively. The study was advertised locally in the two towns and those who indicated interest and gave an informed consent were allowed to participate in the study. Participants had their blood pressure measured using a digital blood pressure monitor (Omron model HEM-741 CINT, Omron Healthcare Inc., Illinois, USA) between 8am and 10am. Three separate readings were taken (after a two minutes interval each) per individual (in a sitting position after an initial ten minutes rest) per day, and the average of the second and third readings recorded. Subjects who had a mean systolic blood pressure (SBP) ≥ 140mmHg and/or a mean diastolic blood pressure (DBP) ≥ 90 mmHg were re-evaluated on a different day, and those who consistently had SBP/DBP ≥ 140/90 mmHg, or who reported using antihypertensive medication were classified as hypertensives (tests)21. While those with a mean SBP and DBP <140 and <90 respectively were classified as normotensives (controls). Measurement of weight and height were taken, with subjects dressed in light clothing and the BMI calculated [weight (kg)/ height (m)2]. Subjects were grouped as thin (BMI<18,5), normal (18.5 ≤ BMI ≤ 24.9), overweight (25 ≤ BMI ≤ 29.9) and obese (BMI ≥ 30) 22,23. Fasting blood samples (2ml) were drawn from each participant using a 4ml syringe, and transferred into clean sample containers. A drop of whole blood was removed from each container immediately and used for the measurement of whole blood glucose, using a glucometre (Accu-Chek Advantage, Roche Diagnostics, Mannheim, Germany). The glucometre was calibrated using standard test strips and solutions supplied by the manufacturer. Blood samples were allowed to stand at ambient temperature until clotting took place. The serum was separated completely by centrifugation for 5 minutes. From the serum, the total cholesterol concentration was measured by the method of Allain et al 24. Subjects were grouped as having desirable serum total cholesterol if they had values <5.17mmol/L, and as having undesirable serum total cholesterol if they had values ≥5.17mmol/L25. Subjects who had a fasting blood glucose level of >115mg/dL were classified as having high blood glucose levels while those who had blood glucose levels ≤115mg/dL were classified as having normal blood glucose levels25. None of the participants presented with hypoglyceamia. Age at last birthday as reported by each participant, was recorded. From that, they were grouped in age-ranges of ten years each (except for the last age-range) starting from 30-39years. The study protocol was prepared in accordance with the Helsinki Declaration and was approved by the Board of the Department of Biochemistry, Kogi State University, Anyigba. Statistical analysis Descriptive statistics was done to get the characteristics of the subjects, represented as means ± standard deviations. Differences between means were checked for significance using the one way ANOVA and multiple comparison tests. The Pearson’s product moment correlation was used to assess correlations between variables. Multivariate linear regression models were used to examine the association between the variables and both SBP and DBP. Differences between means, and associations/correlations were significant at p<0.05. Analyses were performed using SPSS for windows version 11.0 (SPSS Inc, Chicago, IL). RESULTS A total of five hundred and forty two (542) subjects participated in the study. The characteristics of the studied population are shown in Table 1. SBP correlated positively with age, DBP, serum total cholesterol concentration and blood glucose concentration. DBP apart from correlating with SBP also correlated with the same parameters as SBP, as shown in Table 2. The linear regression model (R2 = 0.55) however showed that only DBP and serum total cholesterol concentration contributed (positively) to the increase in SBP; while SBP, age and serum total cholesterol concentration contributed positively) to the increase in DBP (Table 2). Grouping the subjects into test and control groups and according to their age-ranges showed that SBP increased with age in the hypertensive group (from 144.9 ± 15.1 mmHg for those aged 30-39 years, to 162.7 ± 22.9 mmHg for those aged 70-74 years) (Figure 1). In the test group, the differences in the mean SBP values of those aged 30-39 years compared to the others were significant (p<0.05). For the control group, the differences in the mean SBP values of any age-range compared to that of any other age-range was not significant (p>0.05). DBP like SBP increased with age in the hypertensive group (from 89.2 ± 8.4 mmHg for those aged 30-39 years to 96.3 ± 11.4 mmHg for those aged 70-74 years. Comparing between the mean DBP values for the test group showed that the differences between the values for those aged 30-39 years and any other group (excluding 50-59 years) were significant (p<0.05). In the control group, the differences in the mean DBP values for any age-range compared to any other age-range were not significant (p>0.05). Grouping the subjects along serum total cholesterol lines (for both sexes) in the hypertensive and normotensive subjects showed that in both male and female hypertensive subjects, those who had undesirable serum total cholesterol levels had higher SBP (Figure 2). For normotensive males and females, SBP did not change appreciably with change in serum total cholesterol status. DBP in both the hypertensive and normotensive subjects followed the trend described for SBP. Figure 3 shows the blood pressures of the subjects grouped according to their blood glucose levels. Those with high blood glucose level in the hypertensive group had higher SBP than those with normal blood glucose level, especially in male subjects. For the normotensive subjects, SBP values oscillated around 118mmHg for both males and females irrespective of their blood glucose grouping. DBP however was higher in those with high blood glucose level, irrespective of sex, and in both hypertensive and normotensive subjects. Comparing the SBP values between the two blood glucose groups among the hypertensive subjects showed that the differences (within each sex) was significant (p<0.05). DBP gave similar results. The differences in the mean ages of hypertensive subjects with normal blood glucose concentrations and those with high blood glucose concentrations (within the sexes) showed no significance (p>0.05). The same was the case with the normotensives. Finally, classifying the subjects on the basis of their BMI showed that both SBP and DBP were higher in the higher BMI groups of the normotensives but not the hypertensives (Figure 4). In normotensive subjects, the changes in mean SBP and DBP for both males and females, with respect to the three BMI groups were not significant (p>0.05). The same was the case in the hypertensive subjects, except for the differences between the mean DBP of overweight hypertensives compared to the obese ones, which was significant (p<0.05). There was no significant (p>0.05) difference in the mean ages of hypertensive subjects who had normal BMI and the others (within the sexes). The same trend was observed for the normotensive subjects. DISCUSSION Taken holistically, our data show that increases in age, serum total cholesterol level and blood glucose level resulted in increases in both systolic and diastolic blood pressures. The effects of age and blood glucose were weak (r<0.2), while the effects of serum total cholesterol was stronger (r>0.5). The regression analysis however show that only serum cholesterol contributed significantly to both SBP and DBP while age contributed significantly to only DBP. This disagrees with the findings of some researchers reporting an association between BP and BMI14,15,26, but agrees with others who reported associations between BP and serum total cholesterol, and age18-20. Splitting the subjects up along lines of BP status gave clearer insights into the role of the studied variables in BP elevations. Among hypertensive subjects, both SBP and DBP increased marginally with age. While among normotensive subjects, SBP dropped from age 60-69, but DBP kept increasing with age, though slightly. Increase in BP was steeper in subjects with hypertension as against those with normal BP. Age apparently is a factor affecting blood pressure elevation. However other modifiable factors centering round nutrition and lifestyle, which may be exacerbated with age, may be more important than age as risk factors for BP27-30. Increase in age beyond 40-49 years, did not significantly increase BP in the population we studied. This disagrees with researchers who have reported an age-related increase in BP even beyond 50 years of age31,32. Other factors not assayed in this study may be responsible for this discrepancy. Among subjects with high BP, having undesirable cholesterol concentration significantly increased both systolic and diastolic blood pressures. But serum cholesterol concentration had little or no effect on the SBP and DBP of subjects with normal BP. The exact mechanisms, by which cholesterol results in elevated BP, accelerate atherosclerosis and influence cardiovascular diseases are unclear. It has been suggested that cholesterol, particularly low density lipoprotein (LDL) cholesterol which accounts for about 60% of total cholesterol in circulation is taken up by macrophages. At high (undesirable) levels of cholesterol, macrophages take up more cholesterol than they can metabolize and then become ‘foam cells’. These cells play important roles in atheromatous plaque formation and the subsequent narrowing of blood vessel walls33,34. It appears serum cholesterol levels may be a risk factor for elevated BP only in subjects already hypertensive. The reason for this disproportionate response of BP to serum cholesterol levels is not clear to us. Hypertensive subjects who had high blood glucose levels had higher SBP and DBP than those with normal blood glucose levels. The differences were wider in the male than in the female subjects. However, in subjects with normal BP, the differences in the SBP and DBP of the two blood glucose sub-sets were both negligible and insignificant. Sustained blood glucose elevation could lead to diabetes mellitus which often follows obesity (from imbalances in energy intake and expenditure) and may result in altered insulin response/sensitivity35. Insulin-resistant persons have reduced cholesterol absorption, but elevated endogenous synthesis36. This interrelationship may explain the atherogenic effects of glucose. It may also explain our observation that blood glucose levels affected BP in the same manner as serum total cholesterol, in this study. BMI is widely said to correlate with BP14,15,26. Our study shows that among subjects with hypertension, SBP was lowest in the obese males while that of the females differed very negligibly with increasing BMI. The same trend was noticed for DBP. However, among the control subjects, BP increased with increasing BMI, though not significantly. Interpreting data on BMI is rather difficult. For most people, BMI provides a good measure of obesity, but does not provide actual information on body composition – the proportions of muscle, bone, fat and other tissues that make up a person’s total body weight37. Increasing weight has been shown to increase salt retention38, reduce physical activity39 and lead to insulin resistance15. These are hypothesized to be the aspects of the major mechanisms by which increasing BMI influences BP. BMI may therefore be a proxy for other causal exposures. Our data shows that in the studied population, which is lean (average BMI 24.9), increasing BMI did not result in significant increases in BP. Other factors like genetics, diet, hormonal changes, physical activity, sodium metabolism, which the present study could not assess may be at play in the population. The regression models explained 55% of the studied variables (R2 = 0.53) leaving an unexplained 45%. It would appear from our data that BMI could be some cause of worry (from the point of high BP) only to those with normal blood pressures. Blood pressure increased (though not significantly) with age in both hypertensive and normotensive subjects. Elevations in serum total cholesterol and blood glucose levels increased BP significantly only in hypertensive subjects. Increases in BMI however increased BP marginally in normotensive, but not hypertensive subjects. These results therefore support our hypothesis that risk factors for hypertension and cardiovascular diseases affect hypertensive and normotensive individuals disproportionately. This study may be limited by sampling bias, as possibly those who knew they were hypertensive and were already managing it presented themselves for the study. This may explain the reason we had more hypertensive participants than normotensive ones. Our sample size is also not very large, warranting not just a careful interpretation of the data, but also testing the results in larger samples. BP values in our study may be lower than they would have been if we used mercury manometers. Automated devices tend to give lower BP values compared to mercury devices40. Nevertheless, the rigorous method we adopted for BP measurements per test subject make this study very informative of the population we studied. We have taken the investigation into the relationship between BP and some other cardiovascular risk factors and our results have important clinical and public health implications. We therefore suggest that the underlying mechanistic processes that link changes in these variables to their physiological consequences for BP elevation and regulation deserve more attention. REFERENCES
© 2009 Nigerian Society for Experimental Biology. The following images related to this document are available:Photo images[bk09012t1.jpg] [bk09012f4.jpg] [bk09012f3.jpg] [bk09012f2.jpg] [bk09012f1.jpg] [bk09012t2.jpg] |
| |||||||||
