 |
| About Bioline | All Journals | Testimonials | Membership | News |
|
||||||
|
||||||
Biokemistri, Vol. 23, No. 2, June, 2011, pp. 73-80 Determination of some heavy metals concentration in the tissues of Tilapia and Catfishes U. Sani Department
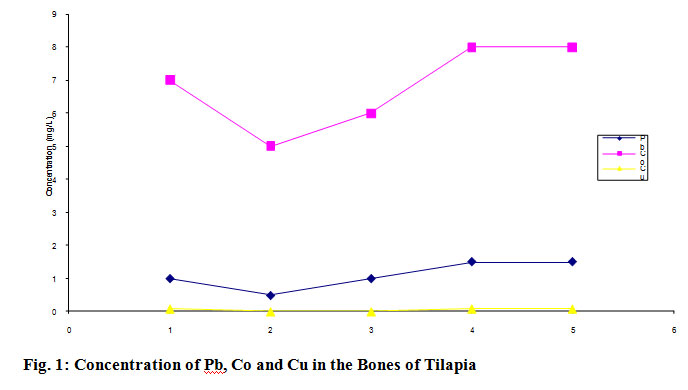
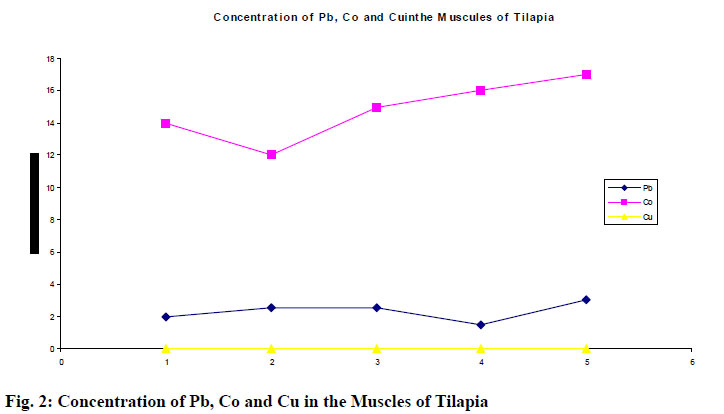
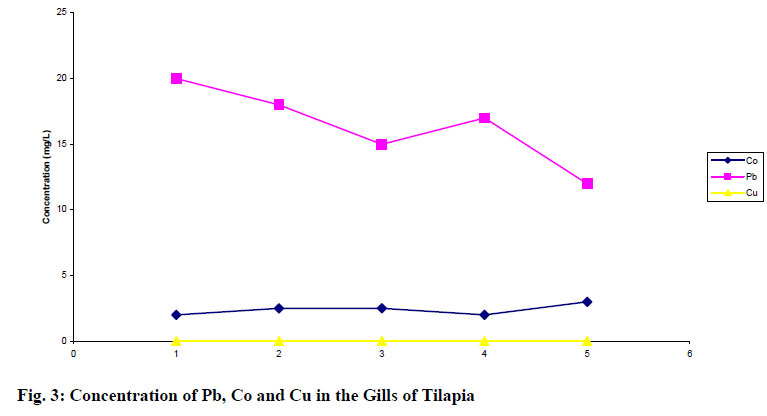
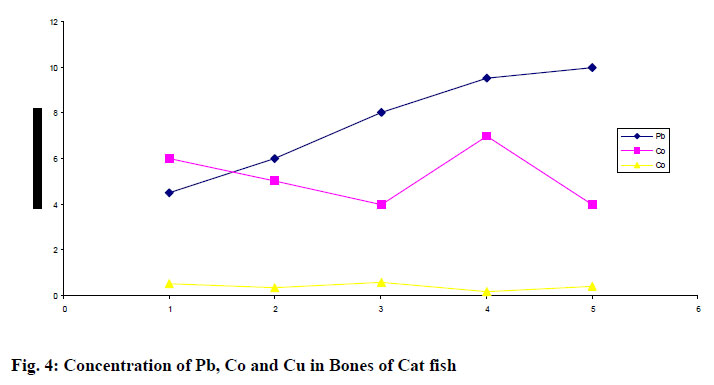
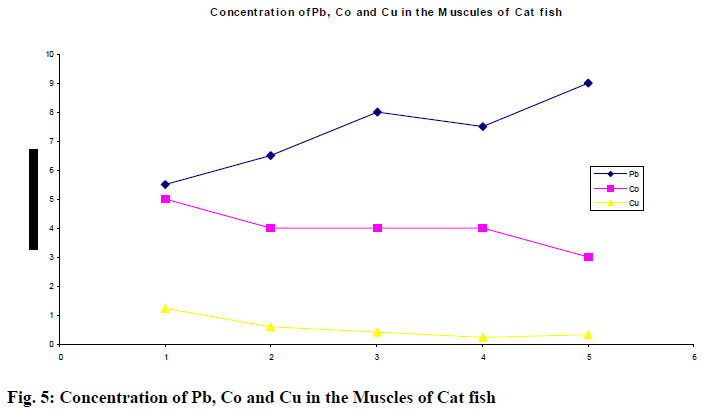
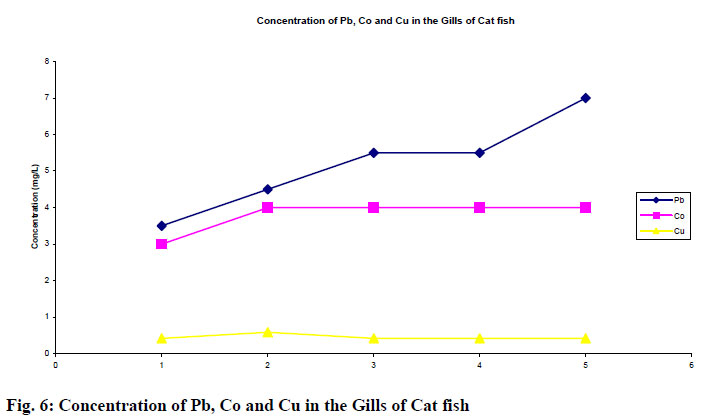
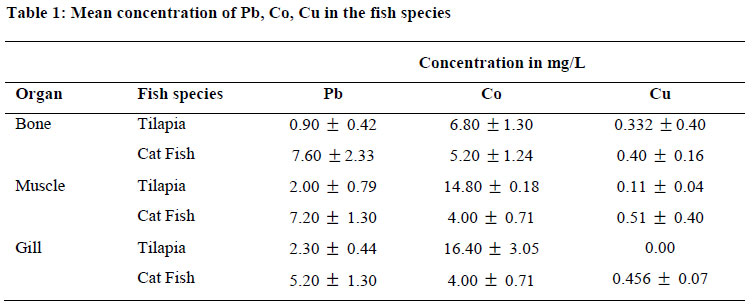
of Pure and Industrial Chemistry, Bayero University, Kano, P.M.B. 3011, Kano, Nigeria (Received April 11, 2011; Accepted May 19, 2011) Code Number: bk11010 ABSTRACT Lead (Pb), Cobalt (Co), and Copper (Cu) concentrations were determined in bone, muscle and gill of two fish species (tilapia fish and cat-fish) collected from Tiga dam Kano, Nigeria during October, 2010. The mean concentrations of the heavy metals varied depending on the type of the tissue and fish species. Generally cat-fish showed the highest level of Pb (7.60 ± 2.33 mg/L) and Cu (0.506 ± 0.4 mg/L) metals in the bone and muscle tissues respectively. Cobalt (Co) showed the highest concentration in tilapia fish. In tilapia fish, the concentration of copper in the gills was not detected. In cat-fish, the bone recorded the lowest level of cobalt (5.20 ± 1.24mg/L) while the gills recorded the lowest level. The concentration of copper (0.506 ± 0.40mg/L) was maximum in the muscle and lowest in the bone of cat fish. In cat fish, Pb showed higher level (7.60± 2.033mg/L) in the bone and least in the gills. In tilapia fish, cobalt recorded higher concentration in gills and least in bones. And also Pb has higher concentration in the gills (2.30 ± 0.44mg/L) and lowest ( 0.90 ± 0.42mg/L) in bone of tilapia fish. Keywords: Tilapia, Catfish, Heavy metals, Environmental pollution. Introduction The term heavy metals refer to any metallic chemical element that has relatively high density greater than 5g/cm3 and is toxic or poisonous at low concentrations. Examples of heavy metals include Mercury (Hg), Cadmium (Cd), Arsenic (As), Chromium (Cr) and Lead (Pb). They are natural components of the earths crust. They cannot be degraded or destroyed. To a small extent they enter our bodies via food, drinking water and air. Heavy metals poisoning could result for instance, from drinking water contamination (e.g. lead pipes), high ambient air concentrations near emission sources, or intake via food chain. They can enter a water supply by industrial land consumer waste or even from acidic rain breaking down soils and releasing metals into streams, lakes, rivers and ground water. (Mance, 1987). The contamination of fresh water with a wide range of pollutants has become a matter of great concern over the last few decades. Heavy metals are natural trace components of the aquatic environment, but rather their levels have increased due to domestic, industrial, mining and agricultural activities (Leland et al., 1978; Mance 1987; Kalay and Canli, 2000). Discharge of heavy metals into river or any aquatic environment can change both aquatic species diversity and ecosystem due to their toxicity and accumulative behaviour (Health, 1987; Allen, 1995). Aquatic organisms such as fish and shell fish accumulate metals to concentrations many times higher than present in water or sediment (Olaifa et al; 2004, Gumgum et al; 1994). They can take up metals concentrated at different levels in their different body organs (Khaled, 2004) certain environmental conditions such as salinity, pH, water accumulation in the living organisms up to toxic concentrations and cause ecological damage (Guven et al., 1999). Thus heavy metals acquired through the food chain as a result of pollution are potential chemical hazards, threatening consumers. At low levels, some heavy metals such as copper, cobalt, zinc, iron and manganese are essential for enzymatic activity and many biological processes. Other metals, such as cadmium, mercury and lead have not known essential role in living organisms and are toxic even at low concentrations. The essential metals also become toxic at high concentrations (Bryan, 1976). Studies carried out on fish have shown that heavy metals may have toxic effects, altering physiological activities and biochemical parameters both in tissues and in blood of fish (Larsson et al, 1985). The consequence of heavy metals pollution can be hazardous to man through his food. Therefore it is important to monitor heavy metal in aquatic environment (water sediment and biota). The use of water in agriculture is growing due to water scarcity, population growth and urbanization which all lead to the generation of yet more waste water in urban areas. However waste water irrigation posses several threats to the environment through contamination by nutrients, heavy metals and salts. Increases loads of heavy metals in waste water may increases the risk of ground water contamination (Stagnitti et al; 1999) The major anthropogenic sources of heavy metals include waste water, run-off from roads and industrial wastes from mining, manufacturing and metal finishing plants. (Alloway, 1990) they may also be leached from soils and rocks in contacts with water. The massive disposal of quantities of metal waste at land fills can lead to metal pollution of ground and surface water (Sawyer and Parkin, 1994). The aim of this work is to determine and compare the concentration of heavy metals (Co. Pb, and Cu) in tilapia and cat fish in Tiga dam Kano state, Nigeria. The high level of pollution caused by heavy metals and their threat they pose to consumers and public health cannot be over emphasized. So, this work as will create awareness on the harmful effect of heavy metals consumption and suggest ways by which pollution by heavy metals can be reduced. Materials and Methods Chemicals of analytical grade (Analar ) were used and distillated water was used in the preparation of the sample and standard solutions. All the apparatus/glass wares used were carefully washed with detergents and rinsed with distilled water. Preparation of lead (II) nitrate standard solution Lead nitrate (1.598g) was weighed and dissolved in little amount of distilled water and 2.0cm3 of nitrate acid in a beaker and the solution was transferred and rinsed into 1dm3 of volumetric flask and was made up to the mark with distilled water. This was equivalent to 1000mg/L lead nitrate stock solution. Working standards of 1.0, 2.0, 4.0, 6.0, 8.0 and 10.0mg/dm3 were prepared from a 100mg/dm3 stock solution obtained by diluting 10cm3 of the original stock solution in 100cm3 volumetric flask by the corresponding 1.0, 2.0, 4.0, 6.0, 8.0 and 10.0cm3 in 100cm3 volumetric flask. Preparation of Cobalt (II) Nitrate Standard Solution Cobalt nitrate salt (4.937g) was weighed and dissolved in little amount of distilled water and 2.0cm3 of nitric acid in a beaker and the solution was transferred and rinsed the beaker with distilled water into 1dm3 volumetric flask and was made up to the mark with distilled water. This was equivalent to 1000mg/dm3 of cobalt nitrate stock solution. Working standard 1.0, 2.0, 4.0, 6.0, 8.0 and 10.0mg/dm3 were prepared from a 100mg/dm3 stock solution obtained by diluting 10cm3 of the original stock solution in 100cm3 volumetric flask up of the mark by the corresponding 1.0, 2.0, 4.0, 6.0, 8.0 and 10.0cm3 in 100 cm3 volumetric flask. Preparation of Copper (II) Nitrate Standard Solution Copper (II) nitrate salt (3.518g) was weighed and dissolved in little amount of distilled water and 2.0 cm3 of nitric acid in a beaker and the solution was transferred and rinsed with distilled water into 1 dm3 volumetric flask and was made up to the mark with distilled water. This equivalent to 1000mg/ dm3 copper (II) nitrate stock solution. Working standard of 1.0, 2.0, 4.0, 6.0, 8.0 and 10.0mg/dm3 were prepared from a 100mg/dm3 stock solution obtained by diluting 10cm3 of the original stock solution in a 100cm3 volumetric flask up to the mark by the corresponding 1.0, 2.0, 4.0, 6.0, 8.0 and 10.0cm3 in 100cm3 volumetric flask. Sampling /Sample Preparation Two fish species namely Tilapia (Measuring 22.46 ± 0.103cm and weighing 225.12 ± 122.08g) and cat fish (Clarias lazera) measuring 31.80 ± 1.68cm and weighing 244.94 ± 250.26g) were brought from Tiga dam during October, 2010 from the local; fisher men of the area. Fish were brought to the laboratory and dissected with clean stainless steel instruments on the same day. The tissue from 5 fish individuals of the same species were pooled to make 3 sub-samples. Muscle, bone and gills organs were dried in an oven at 105°C until reaching a constant weight. Tissues were homogenized and grinded into a powder. 0.1g of each dry tissue were weighed out, transferred into 100cm3 pyrex beaker. 5cm3 of concentrated nitric acid was added and the beaker with its content was placed in a hot plate and heated at 40°C. After heating for 15 minutes another 5cm3 of concentrated nitric acid and 10cm3 of concentrated sulphuric acid were added and the temperature of the plate was gradually increased to 100°C. The solution was set aside after 20 minutes of heating, cool and digest was diluted with 10cm3 of distilled water. The resulting solution was boiled until all the tissues were dissolved. And again set to cool. The digests was transferred into 100cm3 volumetric flask and made up to the mark with distilled water. The digests were kept in plastic bottles and later; the heavy metal concentrations were determined using Alpha 4 atomic absorption spectrophotometer. Results The results obtained for the determination of lead, cobalt and copper concentrations in the organs (bone, gill and muscle) of tilapia are presented in Figs. 1, 2 and 3. For cat fish, the results are as presented in Figs. 4, 5 and 6. Mean concentration (mg/L) of the heavy metals (Pb, Co and Cu) in the two fish species are presented in Table 1. Discussion Table 1 shows that in tilapia, the distribution pattern in the concentration of lead in the organs follows the order Bone < muscle < gill. This shows that the gill recorded the highest lead concentration with mean and associate standard deviation value of 2.30 ± 0.44 mg/L, while the bone recorded the lowest concentration of lead with mean and standard deviation value of 0.9 ± 0.42 mg/L. In cat fish, the reverse was the case in the concentration of lead with tilapia fish. The distribution pattern for the concentration of lead in the organs was as follows: Gill < muscle < bone. The bone recorded the highest concentration of lead in the mean and standard deviation value of 7.60 ± 2.33 while the gill recorded the lowest concentration of lead with mean and standard deviation value of 5.20 ± 1.30. Cobalt recorded the highest concentration in the gill of tilapia with mean and standard deviation value of 16.40 ± 3.05 mg/L when compared with the other organs of the same tilapia species. In other way, bone had the lowest concentration of 6.80 ± 1.30 mg/L mean and standard deviation. The distribution pattern is as follows: bone < muscle < gill. In cat-fish, the distribution pattern for the cobalt concentration is as follows: Muscle < gill < bone. It was observed that the mean and standard deviation of muscle and gill were the same value. Bone had the highest cobalt concentration with mean and standard deviation of 6.80 ± 1.30mg/L while the muscle which recorded the same concentration with gill has the smallest cobalt concentration. Comparing the two fish species (tilapia and cat-fishes), the concentration of cobalt in tilapia is greater that than of cat-fish, most especially in the gill of tilapia fish. In tilapia fish, the bone organ had the highest concentration of copper with mean and standard deviation of 0.332 ± 0.04mg/L. the concentration of copper in the gill of the tilapia was not detected hence the mean and standard deviation were recorded zero (0), the next to it was the muscle with mean and standard deviation value of 0.0166 ± 0.04. The distribution pattern for the concentration becomes gill< muscle < bone. In cat-fish, the concentration of copper in the organs of the fish were more appreciated to those in the tilapia fish. The muscle was known to have the highest copper concentration of 0.506 ± 0.40 mg/L mean and standard deviation value. The bone recorded the lowest concentration of 0.40 ± 0.0.16 mg/L mean and standard deviation. The distribution pattern of the copper concentration in the increasing order is as follows: bone < gill < muscle. Generally, the study reveals that, the bone of cat-fish recorded the highest lead level concentration (7.60 ± 2.33mg/L equivalent to 0.338 ± 0.21mg/g wet weight). In the similar way gill of tilapia recorded the highest cobalt level concentration (16.40 ± 3.05 mg/L equivalent to 0.073 ± 0.276mg/g wet weight) mean and standard deviation. Muscle of cat-fish recorded the highest concentration (0.506 ±0.40mg/L equivalent to 0.002 ± 0.025 mg/g wet weight) mean and standard deviation. The lowest lead level concentration was found in the bone of tilapia fish with mean and standard deviation of 0.90 ± 0.42mg/L equivalent to 0.004 ± 0.038 mg/g wet weight). The lowest value of cobalt concentration can be found in muscle and gill of cat-fish with mean and standard deviation (4.00 ± 0.71mg/L equivalent to 0.016 ± 0.045mg/g wet weight). Conclusion The levels of heavy metals in fish vary in various species and different aquatic environment (Canli and Atli, 2003).Consequently, it can be concluded that the levels of heavy metals in the organs of the two fish species are at acceptable levels. Only the lead level in bone (7.60 ± 2.330 mg/L), muscle 7.20 ± 1.30mg/L), gill (5.20 ±1.30 mg/L) in cat-fish and cobalt level in muscle (14.80 ± 1.92mg/L), gill (16.40 ± 3.05 mg/L) in tilapia fish were higher that the acceptable value for human consumption designated by FAO, 1983. Accumulation of heavy metals in fish viscera and other organs may be considered as an important warning signal for fish health and human consumption. The present study shows that precaution measures need to be taken in order to prevent future heavy metal pollution. References
Copyright © 2011 Klobex Academic Publishers The following images related to this document are available:Photo images[bk11010f6.jpg] [bk11010f4.jpg] [bk11010t1.jpg] [bk11010f3.jpg] [bk11010f2.jpg] [bk11010f1.jpg] [bk11010f5.jpg] |
| |||||||||