 |
| About Bioline | All Journals | Testimonials | Membership | News |
|
||||||
|
||||||
Journal of Culture Collections, Volume 3, 2000-2002, pp. 66-71
AN OPTIMISED METHOD FOR INVESTIGATION OF THE YEAST VIABILITY BY MEANS OF FLUORESCENT MICROSCOPY Maria Nikolova1*, Irena Savova1 and Minko Marinov2 1National Bank for Industrial Microorganisms
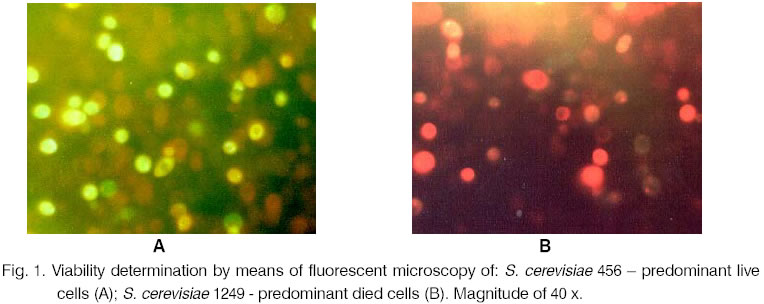
and Cell Cultures, P. O. Box 239, 1113 Sofia, Bulgaria; Code Number: cc02010 SummaryBased on the fluorescent microscopy the viability of a number of yeast strains was investigated. A double staining procedure with fluorescein diacetate and ethidium bromide was carried out. This method is fast, sensitive and very suitable for determination of yeast viability. It can be applied for ascomycetes as well as for basidiomycetes and imperfect fungi. IntroductionThe dominating approaches for re-search on yeasts and other important for the biotechnology microorganisms include quantitative cytochemical investigations. By applying fluorescent microscopic methods the content and the stages of DNA-synthesis, the content of RNA, proteins, amino acids and some enzymes, the dynamic changes in the quantitative parameters can be studied [2, 4, 8, 9]. In the food processing industry these methods are applied for quick detection of yeasts in fermented dairy products or bacteria in frozen vegetables [1, 10]. The investigation of the viability of the stored strains is the main activity of every microbial bank. In the cases when quick estimation of the cell viability is necessary the introduction of the fluorescent microscope improves the selective differentiation between dead and live cells. As a fluorochromium substrate the fluorescein diacetate (FDA) is used for staining live eukaryotes. It belongs to the group of the fluorochromes, which fluorescent as a result of the cell metabolism. The non-fluorescent FDA molecules pass undisturbed through the cell membranes and undergo hydrolysis by the cell esterases [1, 11, 13, 14]. This way FDA stains cells characterised by esterase activity and intact cell membranes, i.e. viable cells. The reaction results in the formation of a fluorescent substance - fluorescein (FRC). FRC penetrates into the live cells and remains in their cytoplasm but it diffuses out through the cell membrane of the dead cells. This effect is a result of the differences in the cell wall permeability for non-polar (FDA) and polar (FRC) compounds. Contrary to some dyes, which remain attached to certain organic or inorganic cell substrates, FDA does not stain dead cells. Many authors use this kind of staining as a test for determination of the cell vitality. The results are detected on a fluorescent microscope, spectrophotometer [13] or by the method of flow cytometry [1]. We applied the double staining procedure, which combined FDA together with a fluorochrome for staining the dead cells. The ethidium bromide (EB) or 2,7-diamino-10-ethyl-9-phenylphenanthrinum bromide bonds specifically to the molecules of RNA and DNA. As a result from the bonding the stain produces a fluorescent peak. Edidin [3], Le Pecq and Paoletti [7] proved that the complex nucleic acid-EB was formed only in the areas where base pairs exist. The dye actually intercalates between the base pairs. In concentration of 1 mg/ml EB slowly penetrates into the intact cells. In the damaged ones it enters quickly and produces bright red fluorescence. These properties of EB make it very suitable for staining dead cells in combination with FDA. Takasugi [12] uses FDA together with EB for investigation of the viability of mammal cells. Kenet et. al. [5] apply propidium iodide (an EB analog) for studying yeast and bacterial cells. The present paper aims at the investigation of the application of the fluorescent method, which combines FDA and EB for microscopic determination of the cell viability of yeasts. Materials and MethodsMicroorganisms. 32 yeast strains from the collection of the National Bank for Industrial Microorganisms and Cell Cultures (NBIMCC) were investigated. They were representatives of the three main taxonomic groups: Ascomycotina, Basidiomycotina and Deuteromycotina. The groups included species from 18 genera: Saccharomyces, Kluyveromyces, Pichia, Torulaspora, Debaryomyces, Schwanniomyces, Candida, Rhodotorula, Sporobolomyces, etc. The research was performed with three-day cultures on beer agar in their exponential phase and with lyophilizates, which had been re-hydrated for half an hour in physiological solution [6]. Chemicals. FDA was prepared in acetone in concentration of 5 mg/ml and stored at –20°C. EB was prepared in phosphate buffer, pH 7.4, in concentration of 50 mg/ml. Before being used the FDA solution was diluted 1:2.5 and mixed with EB solution in equal proportions [5]. Cell viability determination. Cell suspensions in concentration of 3.0 x 10⁷ in phosphate buffer, pH 7.4, were studied. After the addition of FDA-EB the samples were incubated at 37, 25 and 4°C. The incubation period varied from 5-10 to 60 minutes. A drop from the suspension was applied on a slide and was observed under a microscope. At least three repetitions were performed at every experimental stage. For every microscopic slide the number of the dead and live cells was counted for at least three microscopic fields. This ensured more reliable estimation of the cell viability. The average value of the counted cells was turned into percents. The dead cell standard was determined after the aliquote parts of the yeast salt suspensions was mixed and sterilised. The observations were realised by means of Opton microscope, supplied with 450-490 nm exciting filter and 510 nm stopping filter. This combination of filters ensured the simultaneous observation of green and orange-red fluorescing cells. Results and DiscussionRepresentatives from eight genera from the subdivision Ascomycotina, two genera from Basidiomycotina and eight genera from the Imperfect yeasts were investigated. The different yeast species gave similar microscopic picture - the bright green fluorescein colour of the live cells and the orange-red dead cells, which had accumulated EB, were clearly visible on a black background (Fig. 1). In the cases when the incubation lasted 20 minutes the picture was the clearest. When the incubation period was longer (up to 60 minutes) the images quickly faded. As for the incubation temperature, the best results were obtained for 37°C. This was probably a consequence from the higher esterase activity observed at that temperature. For 4°C the fluorescent signal was the weakest. In the control samples with dead cells only red EB fluorescence was observed. This fact proved the statement that they had lost their ability to hydrolyse FDA. The presence of pigments (melanin, carotin) in some yeast species (NBIMCC 1688, 1692, 2118 and 2395) did not impede the correct estimation of their viability. Table 1 presents the results from the investigations of strains in their exponential phase and also after a different period of conservation in lyophilized state. The first analysis was performed after 4 years of storage, the second - after 8 years. Table 1. Cell viability of different yeast strains determined by fluorescent microscopy.
The strains from genus Saccharomyces showed some variability in their survival rate. Brewing, wine and baking yeasts were used in the experiments. A higher viability was shown only by the cultures 456 (25.11 %) and 1249 (26.83 %) after eight years of storage. After the same conservation period the genera Kluyveromyces and Pichia were characterised by comparatively low viability. The species P. farinosa and P. dispora were exceptions. A big decrease in their viability was registered after the fourth year of their storage - from 66.66 % to16.46 % and from 80.88 % to 3.35 % respectively. The genus Candida (C. utilis and C. guilliermondii) showed the highest viability among the non spore-producing yeasts after a long-term storage. Their survival rates were 29.13 % and 17.55 % respectively. The obtained results led to the conclusion that the culture viability was a specific property for every strain. Table 1 demonstrates the strong individuality of all the investigated species. The genera Saccharomyces, Schizosaccharomyces, Torulaspora, Kluyveromyces, Candida, Rhodotorula gave the best microscopic pictures. Good observations were realised with the yeasts from the genera Pichia, Metschnikowia, Cryptococcus, Sporobolomyces, Brettanomyces, Trigonopsis. Satisfactory results gave the genera Bullera, Schwanniomyces, Zygosaccharomyces. Despite the differences in the composition and structure of the cell wall in the above-mentioned yeast groups the results were distinctive and reliable. ConclusionsThe selective staining of dead and live cells, followed by observation by means of fluorescent microscope, gives a very good notion about the real condition of the growing (vegetative or lyophilized) cultures for a definite period of time. It ensures the quick detection of certain changes in the cell viability during the period of their conservation. This method can be applied for the three yeast groups. It also gives information about the intracellular enzyme content and the permeability of the cell membrane. The investigated yeast groups were enough representatives. Therefore, the authors consider this method applicable for other groups of microorganisms, too. References
Copyright 2002 - National Bank for Industrial Microorganisms and Cell Cultures - Bulgaria The following images related to this document are available:Photo images[cc02010f1.jpg] | |||||||||||||||||||||||||||||||||||||||||||||||||||||||||||||||||||||||||||||||||||||||||||||||||||||||||||||||||||||||||||||||||||||||||||||||||||||||||||||||||||||||||||||||||||||||||||
| |||||||||
