 |
| About Bioline | All Journals | Testimonials | Membership | News |
|
||||||
|
||||||
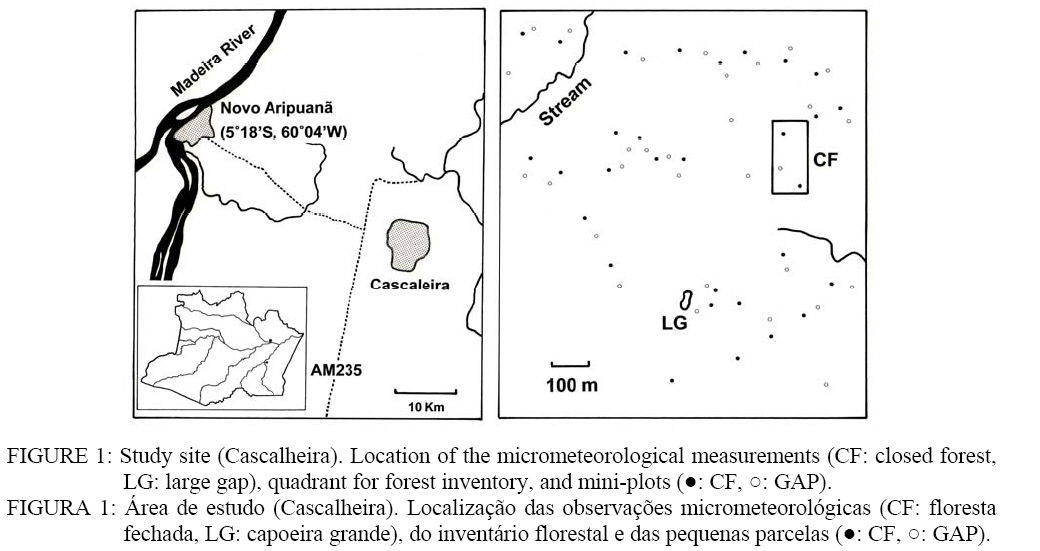
Ciência Florestal, Vol. 18, No. 4, 2008, pp. 415-426 MICROMETEOROLOGICAL ENVIRONMENTS AND BIODIVERSITY IN A CLOSED FOREST AND AT A TREE-FALL GAP IN CENTRAL AMAZONIA AMBIENTES MICROMETEOROLÓGICOS E A BIODIVERSIDADE FLORÍSTICA EM FLORESTA FECHADA E EM CLAREIRA NATURAL NA AMAZÔNIA CENTRAL Akio Tsuchiya1, Akira Tanaka2 1Engenheiro Florestal, PhD., Faculty of Integrated Arts and Sciences, Hiroshima University, 1-7-1 Kagamiyama,
Higashi-Hiroshima, Hiroshima 739-8521, Japan. tsuchiya@hiroshima-u.ac.jp Recebido para publicação em 17/01/2006 e aceito em 13/10/2008. Code Number: cf08039 ABSTRACT Micrometeorological
parameters were measured in a closed forest (CF) and at a tree-fall gap (LG)
near Novo Aripuanã, AM, along the Madeira River in dry season (August to
September 2003) and rainy season (March 2004), and were compared to the number
of species per family and the number of seedlings obtained from forest
inventory. The daily averages of net radiation (W/m2) between CF and
LG were 9.5:168.0 during dry season and 3.6:125.9 during rainy season, and
these averages were influenced by the difference in shortwave radiation between
the sites (CF Keywords:micrometeorological environments; closed forest; tree-fall gap; biodiversity. RESUMO Diversos parâmetros
micrometeorológicos foram medidos em floresta fechada (CF) e em clareira
natural (LG) na região do Rio Madeira, município de Novo Aripuanã, Estado do
Amazonas, na estacão seca (agosto a setembro, 2003) e na estacão chuvosa
(março, 2004). Os resultados foram relacionados com o número de espécies por
família e a regeneração natural de um inventário florístico. A amplitude da
radiação líquida diurna (Rn: W/m2) entre CF e LG foi de 9,5 e 168,0,
respectivamente, durante a estação seca, e 3.6 e 125.9 durante a estacão
chuvosa. A média dos valores foi influenciada pela diferença da radiação de onda
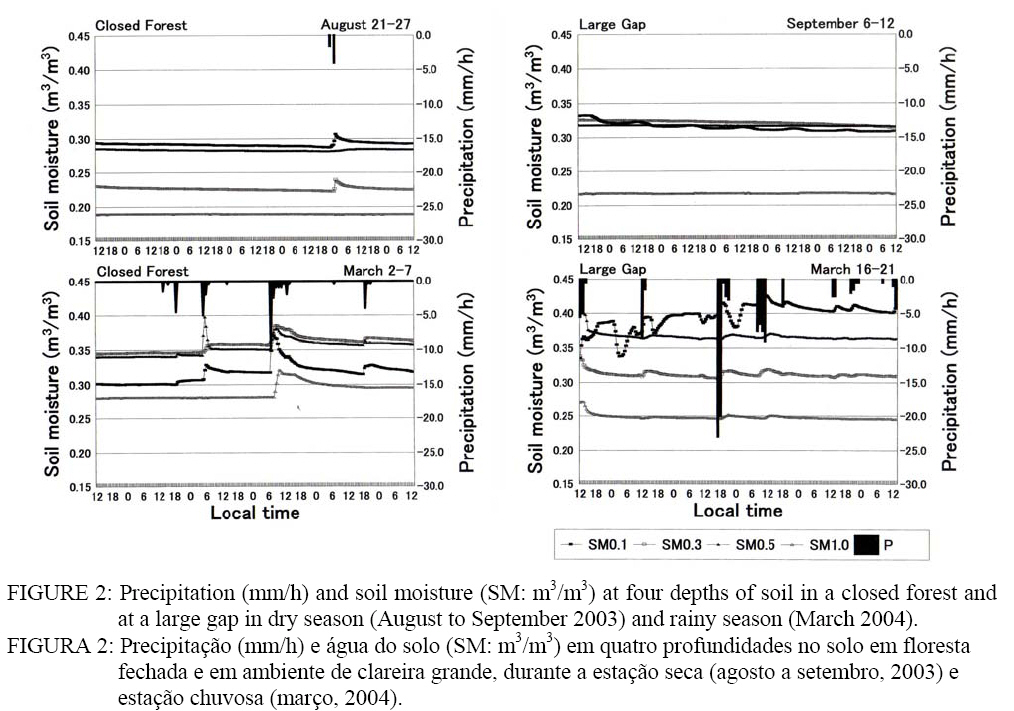
curta entre sítios (CF Palavras-chave: ambientes micrometeorológicos; floresta fechada; clareira natural; biodiversidade. INTRODUCTION Deforestation of Amazonian rainftorests started in the 1960s in line with the national policy of “development of Amazonia”, but in response to the expansion of deforested areas, future climatic scenarios of Amazonia have been discussed in combination with general circulation models and field experiments from the end of 1980s (FISCH et al., 1998). Forest biomass and biodiversity have been investigated since the RADAM project in the 1970s. Tree-fall gaps were also investigated along with germination, establishment, and the subsequent growth of pioneer species, mainly Cecropiaceae, in order to explain the plant succession (UHL et al., 1988; MARTÍNEZ-RAMOS et al., 1989). Meteorological measurements have been adapted to gap ecology, but in most cases have only involved preliminary data collection, such as light and temperature measurements, to compare with seed and seedling responses (THOMPSON and GRIME, 1983; CHAZDON, 1988; ACKERLY and BAZZAZ, 1995). Systematic measurements such as heat balance and evapotranspiration have been conducted mainly in pastures since the 1990s, and researchers’ interests have moved to restoration of abandoned pastures and forest utilization with low environmental loads (FEARNSIDE, 1995; VAN LEUWEEN et al., 1997; HIGUCHI et al., 1998; MESQUITA, 2000; LAURANCE and FEARNSIDE, 2002). Among them, there is a movement toward applying the gap-phase succession to afforestation, such as HARTSHORN (1989) and TANAKA (1998). It is thought that the improvement of radiation environments is the largest change at gaps. What is needed is a coupling of the ecological techniques with findings from small-scale meteorological phenomena at gaps. Therefore, the current study aims to measure micrometeorological parameters, which largely differ between a closed forest and a gap, and to compare these results with the species composition and the number of individual trees at each site. METHODS From August to September 2003 and in March 2004, fieldwork was carried out in a closed forest (CF) and at a large-sized tree-fall gap formed in 2001 (20 m width x 40 m distance: LG) in a primary forest. It is called Cascalheira, and is located 40 km east of Novo Aripuanã (5°18’S, 60°04’W), about 300 Km south of Manaus, AM (Figure 1). Notable human disturbance has never been occurred at the site either before or after the land was acquired by the Centro de Pesquisas Ecológicas da Amazônia in 1993. Vegetation type is categorized as “canopy-emerged lowland tropical dense forest in the Madeira drainage basin” (TANAKA, 2005). The author explained that not only late successional species are peculiar to primary forests but also numerous tree-fall gaps formed at the end of rainy season, increasing species richness. The yellow latosol (Oxisols) reaches to a depth of 5-6 m of soil (SOUZA, 1991), and a pebble layer called Cascalho is beneath the Oxisols. The thickness of the humus layer is only 5-10 cm. A weak dry season occurs from June to October, with monthly precipitation of about 100 mm. According to the climatic data of National Agency of Water (ANA) from 1991 to 2003, the annual mean temperature is 26.0 ºC, humidity is 85%, and precipitation is 3,439 mm. A tipping-bucket rain gauge (Ohta, No.34T) was set in CF and LG, and hourly precipitation (P) was stored to a data logger (TandD, RF3) from August 13th to September 12th, and March 2nd to 21st. A dielectric aquameter sensor (Decagon, ECHO10) for soil moisture (SM) was buried at depths of 0.1, 0.3, 0.5, and 1.0 m, and a platinum resistant thermometer for soil temperature (ST) was buried at 0.1 and 0.3 m. Soil samples were obtained by core samplers (Daiki, Stainless 100 cc), and were used to estimate SM from the relationship between the dielectricity and volumetric water content. Four radiation parameters (downward and upward shortwave radiations: SWd, SWu, longwave radiations: LWd, LWu) were measured using an Eko-MR40 at a height of 1.3 m, and soil heat flux (G) was measured with an Eko-MF81. The data were saved in voltage data loggers (Eko, MP75D). Air temperature (T) and humidity (H) were measured using a thermo-hygrometer (Hioki, No.9680) at 1.5 and 0.1 m above the ground. Except for the dielectricity, which was recorded every 30 minutes, the parameters were recorded every 10 minutes. Since there was only one set of equipment except for the rain gauge, measurements were shifted; one week for CF (August 21st-27th), and one week for LG (September 6th-12th) in dry season, six days for CF (March 2nd-7th), and six days for LG (March 16th-21st) in rainy season. Sky-view photos were taken using a fish-eye lens (Sigma, EX8mmF4) at each site (10 photos each) to estimate the sky-view factor by analyzing the images with software (Mitani, Mac Scope 2.5). A forest inventory was carried out at CF in 2003. Individuals of DBH³5 cm were targeted in the area of 1.9 ha (CF: Figure 2). The number of seedlings, whose height was under 50 cm, was counted in 30 mini-plots (4 m2 each) established at the closed forests (●) and gaps (○). RESULTS Precipitation and soil moisture As shown in Figure 2, there were eight rainfall events from August 13th to September 12th, 2003 in dry season. All the cases were squalls and showers brought about by convectional disturbances. The hourly precipitation (P) recorded was 22.0 mm at CF and 46.5 mm at LG at 18:00 on August 15th. From March 2nd to 21st, 2004 in the rainy season, the number of rainy days amounted to 15. There was one case in which the P exceeded 20 mm at CF, and four cases at LG, but they did not reach 30 mm. Instead, the rains lasted longer than those in dry season. Soil moisture content (SM: m3/m3) at CF during August 21st-27th was the highest at the depth of 0.1 m (SM0.1: 0.29-0.30), the second highest was SM0.5 (0.28-0.29), next was SM0.3 (0.22-0.23), and the lowest one was SM1.0 (0.19) (Figure 2). The SM0.1 responded to the rainfall from August 25th to 26th; it increased about 0.02 m3/m3, and maintained the level later. The response of SM0.3 was similar to that of SM0.1. The SM0.5 slightly increased with a time lag of about six hours, but there was no change in SM1.0. There was no rainfall at LG during September 6th-12th, but SM was higher than that of CF because of the rainfall occurred a week before. The profile was SM0.1>SM0.3>SM0.5>SM1.0. The SM in rainy season greatly changed at both sites. At CF (March 2nd-7th), increases and subsequent decreases were observed at all depths on March 5th. At LG (March 16th-21st), increases and decreases were observed at all depths on the first day when it rained 56.5 mm. The profile was SM0.1>SM0.5>SM0.3>SM1.0. The range of SM was higher in rainy season, and was higher at LG. The SM0.1 responded to a few mm of rainfall, while SM1.0 seemed to respond when the hourly precipitation reached 10 mm. Net radiation, soil heat flux, and soil temperature In dry season, SWd reached 400 W/m2 at CF, but it was limited to about two hours each in the morning and afternoon because of the sun-fleck. The SWu was observed at the same time. Both LWd and |LWu| varied with temperatures from 420 to 500 W/m2. The SWd reached 800-1,000 W/m2, and SWu rose to 200 W/m2 at LG. The LWd was larger than |LWu| in daytime, and the difference was about 150 W/m2. The difference was reduced to 20-30 W/m2 at night. In rainy season, both SW and LW were flat at CF. The maximum SWd was about 50 W/m2. The SWu was also compressed. The LWd and LWu remained at 450 W/m2 all the day. Radiations at LG were dependent on weather. The SWd and SWu were similar to during dry season, but on rainy days, they were about half that of dry season. The LW also responded to changes in the weather. The relationship of |LWu|>LWd was observed both in daytime and nighttime. Net radiation (Rn) was basically influenced by SWd because LWd=|LWu| and SWd>SWu. At CF in dry season, Rn temporarily reached
100-400 W/m2 in the morning and afternoon, but it was a little below
zero in nighttime (Figure 3). Soil heat flux (G) was positive just before and
after noon, but changed to negative at night, keeping Rn In dry season, soil temperatures (ST) at two depths changed from
25.0-27.0 ºC at CF. The ST0.1 had a diurnal variation (<2.0 ºC); it peaked
at 18:00-21:00, and bottomed at 9:00-10:00. There was no diurnal variation in
ST0.3. At LG, diurnal variation was found in ST0.3 also. There was a time lag
between the two depths; ST0.1 peaked at 15:00 and bottomed at 8:00, ST0.3
peaked at 22:00 and bottomed at 12:00. The difference between the depths was
ST0.1>ST0.3 from 9:00 to 0:00, while it was ST0.1 Air
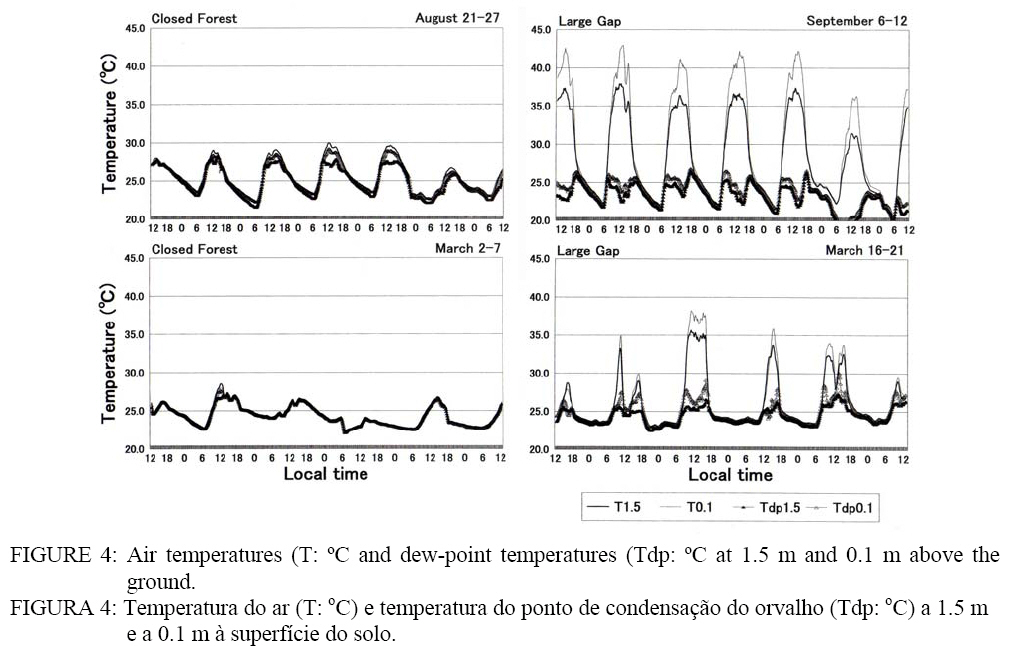
temperature and humidity Air temperatures (T) at the heights of 1.5 m and 0.1 m changed from 22.0-23.0 ºC to 27.0-30.0 ºC at CF in dry season (Figure 4). The T
fluctuated between 18.0-20.0 ºC and 32.0-34.0 ºC at LG. Dew-point temperature
(Tdp) at CF was lower than T in daytime, but they were the same from the
evening to morning. On the next day of a squall, no difference appeared between
Tdp and T. At LG, Tdp increased in the morning and in the evening. In the
afternoon, Tdp became lower than T, and the difference expanded to 15 ºC at 1.5 m and 20 ºC at 0.1 m. At CF in rainy season, temperatures fluctuated from 23.0 ºC to 28.0 ºC. The
temperature dropped every time it rained. Because T was almost equal to Tdp for
both heights, the four temperatures seem to overlap into one curve in the
figure. At LG, temperatures were influenced by the weather; temperatures as
high as in dry season were observed on sunny days, while they did not reach
30.0 ºC on rainy days. The daytime Tdp was high due to a large amount of water
vapor. There was a
case which Tdp0.1 reached 30.0 ºC (March 20). Relative humidity at the height of 0.1 m (H0.1) at CF in dry season was 100% throughout a week. The H1.5 decreased to 85% in daytime. At
LG, both H0.1 and H1.5 dropped to 40-50% in daytime, but they reached 100% at
18:00. The absolute humidity (Y: g/m3) was similar to Tdp. When Y
keeps decreasing even after T overlapped Tdp, the decrease is regarded as the
amount of condensation. On August 24th (a sunny day), the T=Tdp
occurred at 18:00, and they gradually decreased until the next morning. In the
meantime, water vapor (4.0 g/m3) condensed. The condensation was as
small as 1.0 g/m3 on rainy days. The Y at LG was obviously small. In
rainy season, H0.1 at CF was 100% throughout the days, and H1.5 was also 100%
except for on March 3rd. At LG, there was a day when H decreased to
the 50% level, and a day when the decrease remained to 80%. The maximum Y at CF
was about 25.0 g/m3, but Y did not fall below 20.0 g/m3
except for March 5th. The amount of condensation was as small as
1.0-2.0 g/m3. The saturation deficit (Ed: hPa) in dry season was CF
(less than 10 hPa) Parameters between the sites and between
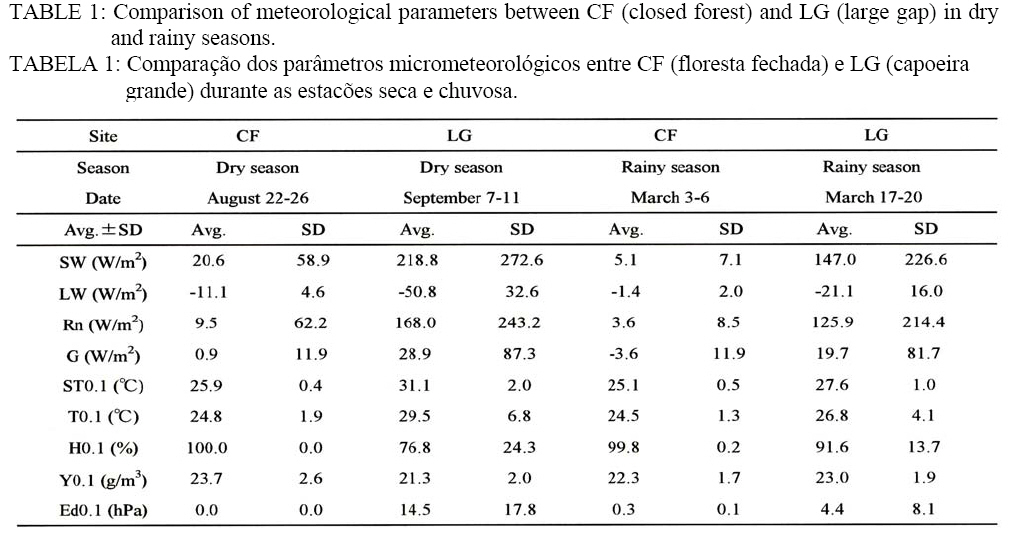
the seasons Table 1 shows the daily averages (Avg.) and the standard
deviations (SD) of parameters between CF and LG both in the dry and rainy
seasons. The statistics do not include the data of the initial and final days
of the measurement periods. The site difference with respect to SW was CF Species richness From forest inventory in the area of 1.9 ha, 1,960 tree individuals (DBH³5 cm)
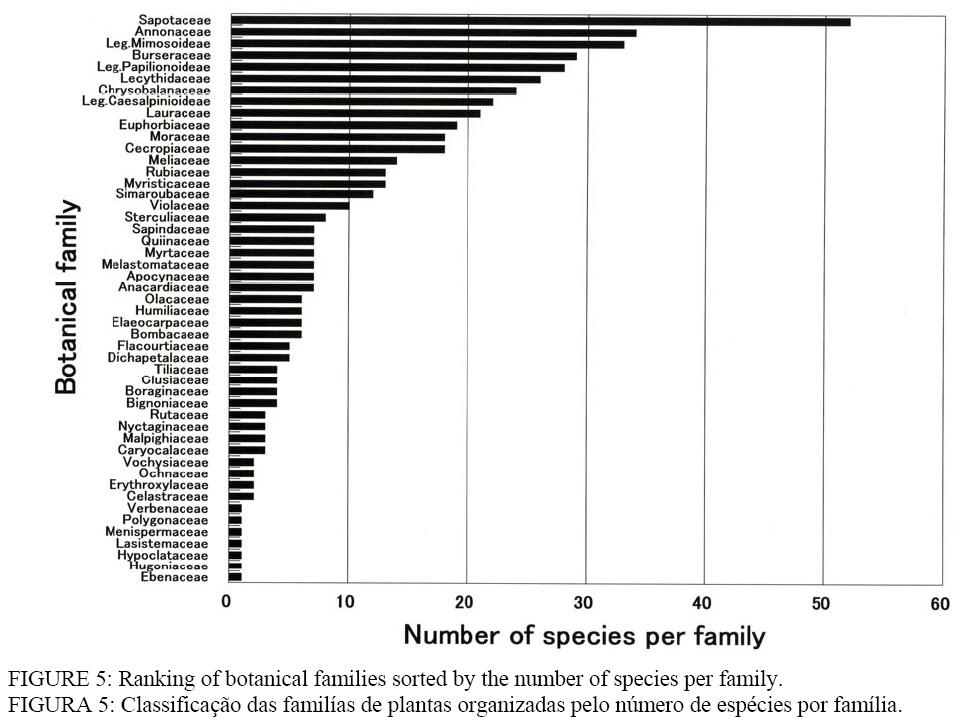
comprising 49 families and 513 species, and 1,064 palms over 13 species were
found. Concerning the species richness, there were 29 species in Burseraceae, 18 in Cecropicaceae, 14 in Meliaceae, 13 in Myristicaceae, 12 in Simaroubaceae, 10 in Violaceae, and 8 in Sterculiaceae, from 52 species in Sapotaceae to 7 species in
Melastomataceae (Figure 5). Palm species with more than 100 individuals were Orbignya
phalerata (382), Mauritia aculeata (279), Geonoma sp. (164) and Astrocaryum
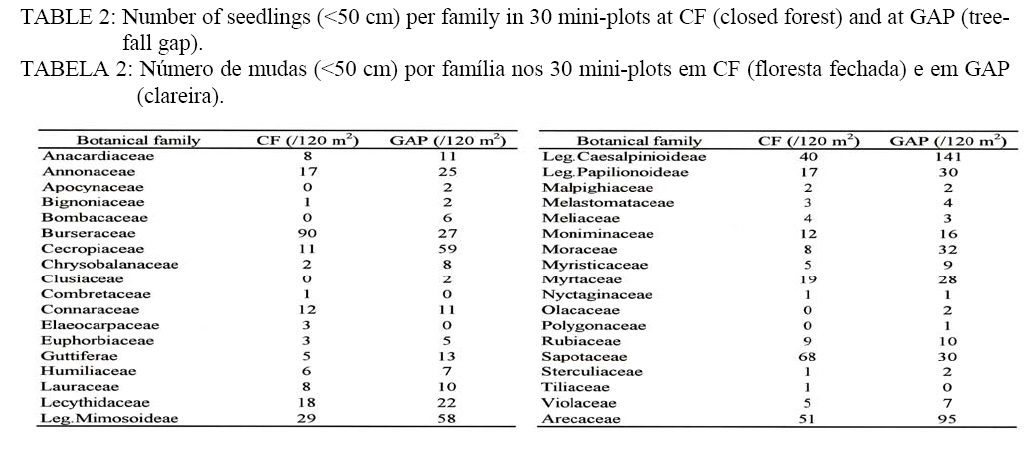
murumuru (130). Seedlings (<50 cm) at 30 mini-plots did not differ so much in
the number of families (CF: 30, GAP: 32) and species (77:94), but the number of
tree individuals at GAP was about 1.43 times as large as those at CF (CF: 409,
GAP: 586) as shown in Table 2. This difference was found in some limited
families, such as 11:59 in Cecropiaceae, 1:30 in Leg. Mimosoideae, 40:141 in
Leg. Caesalpinioideae, 8:32 in Moraceae, 90:27 in Burseraceae, and 68:30 in
Sapotaceae. That of Arecaceae (palm) also exhibited a large difference (CF: 51,
GAP: 95). DISCUSSION NOBRE et al. (1989) simulated that the albedo would
increase from 12.5 to 21.6%, temperature would also increase (1-2 ºC),
evapotranspiration would decrease from 4.3 to 3.5 mm/day, sensible heat would
increase (+30%), and the dry season would be elongated, if the Amazonian
rainforests are all changed to pastures. NOBRE et al. pointed out that
the bowen ratio in dry season would increase from +1.0 to +3.0, the minimum
temperature at a forest would be 2.5 ºC higher than that at pasture, and the
mixing ratio, which is nearly equivalent to the Y, it would be 16 g/kg at
forest and 10 g/kg at pasture. WRIGHT et al. (1992) estimated that the
evapotranspiration at pastures would be smaller than at forests. GASH and NOBRE
(1997) reported that at pastures Tmax rises, Tmin and H decrease, and a
weakened wind velocity due to small convective energy makes the mixing smaller
at night. ALVALÁ et al. (2002) showed that ST and G at a pasture
surpassed those at a forest from the measurements in Rondônia. The contrast
between forests and pastures–low temperature and high humidity at forests,
while high temperature and low humidity at pastures–has been pointed out in
these studies. The area of LG targeted in our study is far smaller than that of
pastures; however, some results are common with pastures. Namely, parameters
related to radiation and temperature at LG are larger than those at CF (Table
1). Fluctuations are also small at CF, meaning that a closed forest mitigates
the diurnal and seasonal changes. On the contrary, LG is exposed to
environments with a wide range caused by changes in radiation (SWd, Rn) after
the elimination of forest canopy. This fact is clear from the sky-view factor
at the LG (43.6±6.0%). As for precipitation and soil moisture, the seasonal
difference is larger than the difference between the sites, and parameters
related to water vapor are also similar to precipitation and soil moisture.
From these circumstances, it is concluded that tree-fall gaps, which scatter in
primary forests, have fairly different micrometeorological environments from
neighboring closed forests. ALMEIDA
et al. (1993) reported that the species richness at Caxiuanã National
Park, PA, which had over 50 families and 338 species in an area of 4 ha, was quite high, and that the richness was equivalent to that of primary forests at Camaipi, AP,
Breves, PA, and the Xingu River, PA. Although it cannot be directly compared to
our results because ALMEIDA et al. measured individuals of DBH³10 cm, the
number of species at our site exceeds that of the Caxiuanã in spite of its
smaller area. Also, through the analysis of the number of species per family
between Caxiuanã National Park and Ducke Reserve Forest, AM, LISBOA et al.
(1997) described that Sapotaceae, Annonaceae, Leg. Mimosoideae, Leg.
Papilionoideae, Lecythidaceae, Chrysobalanaceae, Leg. Caesalpinioideae,
Lauraceae, Euphorbiaceae, Moraceae, Rubiaceae, Apocynaceae, and Melastomataceae
were the representative families in Amazonia. In our results, botanical
families such as Burseraseae, Cecropiaceae, Meliaceae, Myristicaceae,
Simaroubaceae, Violaceae, and Sterculiaceae, which have not been described
above, are ranked in Figure 5. Frequently-formed tree-fall gaps are thought to
be the reason. TANAKA (2005) investigated the history of gaps formed in the
past several years in the same area, and estimated the turnover time to be 73
to 119 years. As shown by BROKAW and SCHEINER (1989), there is a possibility
that frequently-occurring tree-falls and recoveries mix pioneer species and
late successional species, resulting in increases in species richness.
Disappearance in forest canopies brings drastic environmental changes. At
closed forests, there are shade plants such as Poecilanthe effusa of
Leg. Papilionoideae, which remains near the forest floor by sprouting new stems
even though the main stem die (TSUCHIYA et al., 2002), but most trees
compete toward the forest canopy (CHAMBERS et al., 1998). The solar radiation
plays an important role in the extension growth at the forest floor (CHAZDON,
1988), and the neighboring tree individuals also grow due to the edge effect if
a gap is formed (CAMARGO and KAPOS, 1995). As stems extend, the percentage of
vessel area in stem transection expands to increase the efficiency of absorbing
sap (TYREE and EWERS, 1991). TSUCHIYA and HIRAOKA (2001) reported that the
percentage of vessel area of an individual with a height of 35 m is about 30% in eastern Amazonia. If a tree with such a high percentage of pores is emerged from
the canopy layer, the possibility of tree-fall will increase. Concerning
the seedlings in mini-plots shown in Table 2, there were three genera (Cecropia,
Coussapoa, Pourouma) in Cecropiaceae at GAP, while there was only Pourouma
at CF. The number of Pourouma itself had a large difference (11:37). In
Leg. Mimosoideae, the difference in Parkia sp. was outstanding (1:30).
This is a fast growing species with light wood density (LOUREIRO et al.,
1997). The difference in the number of Leg. Caesalpinioideae was brought about
by the genus Tachigalia; 1 at CF and 84 at GAP. It is known that this
species grows fast, and easily falls down. The difference in Moraceae was
dependent on the number of Helicostylis sp.; 4 at CF and 25 at GAP. Helicostylis
sp. is a medium/understory species, but Moraceae, including this species, is
considered to establish fast in the plant succession like Cecropiaceae (FLEMING
and WILLIAMS, 1990). A large difference was found in Orbignya phalerata
of Arecaceae between CF and LG. This palm is also predominant in gaps.
Burseraceae was composed of only Protium sp. It is described that the
genus Protium mainly habits in closed forests, but is occasionally found
in gaps, too (LOUREIRO et al., 1997). In Sapotaceae, the difference in
the number of Chrysophyllum sp. and Micropholis sp. was
outstanding (51:12). Both genera are representative canopy emerging species in Amazonia, and the wood density is quite high (SUDAM/DRN, 1981). Just like black pepper, which
dislikes strong sunshine and is widely produced in combination with African
mahogany in the agro-forestry (TSUCHIYA and LISBOA, 2004), the genera Protium,
Chrysophyllum, and Micropholis are also fond of places with small
SWd. Buried seeds, seedlings, and juvenile trees sense the development of
radiation and temperatures, then germination and stem growth start from species
with a fast response such as Cecropia (THOMPSON and GRIME, 1983; ACKERLY
and BAZZAZ, 1995). It
has been reported that the surface soil layer at gap has low water contents due
to evaporation, while the deep layer with no plant root has high water contents
(DENSLOW, 1980). However, in our study, the difference in soil moisture between
dry and rainy seasons was about 10% at the depth of 0.1 m and a few percent at 1.0 m. Also, the soil moisture was a little higher at LG than at CF in
both seasons. It is because the clayish soil has a large water holding capacity
and because rainfall directly reaches the soil surface at gaps, while about half
of rainfall is trapped by canopies at closed forests (MORAES et al.,
1997). FISCH et al. (1998) reported that the soil moisture would have
started decreasing at pastures if it were not for precipitation during 10 days
in dry season. There are studies stating that grass at pastures with shallow
roots wither in dry season, but juvenile trees at pastures survive because the
root zone reaches 4-8 m depth (NEPSTAD et al., 1994; SOMMER et al.,
2002; WRIGHT et al., 1992). In Novo Aripuanã area, however, squalls occur.
In fact, the monthly mean precipitation from June to September (1991-2000) is 94.1 mm. The water condition recovers with the arrival of a squall even in dry season. Therefore, it
is rare for juvenile trees regenerated from tree-fall gaps to decline due to
water stress. Rather, changes in radiation conditions are a trigger for plant
succession. Even if the pioneer trees disappear, the forest naturally changes
into the next succession stage (UHL et al., 1988; MARTÍNEZ-RAMOS et
al., 1989). CONCLUSION In
this study, micrometeorological environments were measured at a closed forest
and tree-fall gap in a canopy-emerged lowland tropical dense forest along the Madeira River, AM. Precipitation and soil moisture were larger in rainy season than dry
season at both sites, but the site difference was not clear in either of the
seasons. Parameters related to radiation and temperature were greater at a gap
than at a closed forest during both seasons, and the diurnal fluctuations were
also larger at a gap. It is thought that the disappearance of forest canopy
accompanying tree-fall gap has resulted in increases in the number of species
per family and the number of seedlings. ACKNOWLEDGEMENTS This study was financially supported by the Nissan Science
Foundation and the Japan Society for Promotion of Sciences. We are grateful to
Mr. Kiyoshi Nagaoka for assistance in fieldwork. BIBLIOGRAPHIC REFERENCES Copyright 2008 - Ciência Florestal |
| |||||||||