 |
| About Bioline | All Journals | Testimonials | Membership | News |
|
||||||
|
||||||
Ciência Florestal, Vol. 20, No. 1, Jan-Mar, 2010, pp. 57-69 Site index model for natural stands of rebollo oak (Quercus pyrenaica Willd.) in Galicia, NW Iberian Peninsula Modelo de índice de sitio em povoamentos naturais de carvalho negro (Quercus pyrenaica Willd.) da Galicia, NW da Península Ibérica Ignacio Javier Díaz-Maroto1 José Fernández-Parajes2 Pablo Vila-Lameiro2 Eva Barcala-Pérez3
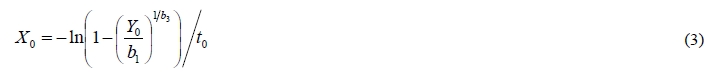
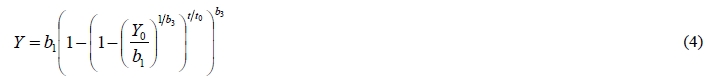
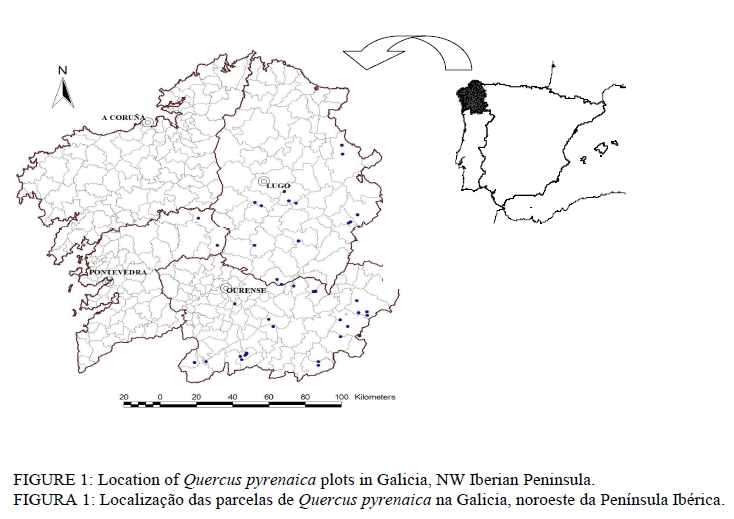
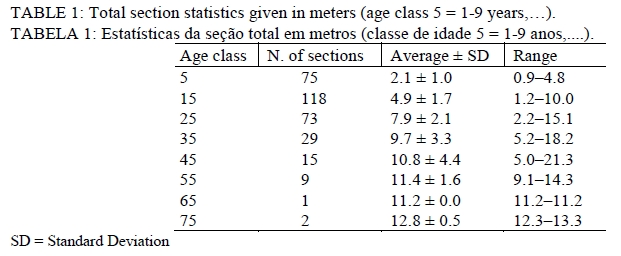
Recebido para publicação em 19/05/2008 e aceito em 8/09/2009. Code Number: cf10005 ABSTRACT Data from stem analysis of 56 dominant trees of Quercus pyrenaica Willd., in natural stands in Galicia (NW Iberian Peninsula), were used to evaluate four dynamic site equations derived with the Generalized Algebraic Difference Approach (GADA). All the equations are base-age invariant and directly estimate height and site index from any height and age. The fittings were made using a data structure involving all possible growth intervals. The GADA formulation derived on the basis of the Bertalanffy-Richards model by considering the asymptote and the initial pattern parameters as related to site productivity. It is therefore recommended for height growth prediction and site classification for natural stands of rebollo oak in Galicia. The autocorrelation was analyzed with a test of residuals using Durbin’s ttest without reaching a manifest result of autocorrelation between managed data. Keywords: Quercus pyrenaica; site index model; height growth; Generalized Algebraic Difference Approach. RESUMO Dados da análise de tronco de 56 árvores dominantes de Quercus pyrenaica Willd. de florestas naturais da Galicia (NW Península Ibérica) foram utilizados para avaliar quatro equações dinamicas de índice de sitio obtidas com a Abordagem Generalizada de Diferença Algébrica (GADA). Todas as equações são baseadas na idade invariante e diretamente estimam a altura e o índice de sitio. Os ajustes foram feitos utilizando uma estrutura de dados que incluiam todos os possíveis intervalos de crescimento. A formulação GADA teve base no modelo Bertalanffy-Richards, considerando a assíntota e do padrão inicial como parâmetros relacionados à produtividade do sitio. Assim, recomenda-se o modelo na previsão do crescimento em altura e classificação de sitios para povoamentos naturais de carvalho negro na Galicia. A autocorrelação foi analisada com um teste de resíduos utilizando Durbin's t-teste, sem chegar a um resultado significativo de autocorrelação entre os dados. Palavras-chave: Quercus pyrenaica; modelo de índice de sitio; crescimento em altura; Abordagem das Diferenças Algébricas Generalizadas. INTRODUCTION Rebollo oak (Quercus pyrenaica Willd.) is distributed throughout the Iberian Peninsula, it is probably found all over Spanish territory, although it is sometimes only present in small stands or represented by few individuals (MESON, 1983; CARVALHO et al., 2005). In Galicia, the climax vegetation in large areas of the south of Lugo province and inland areas of Pontevedra and Ourense provinces is comprised of rebollo natural oaks (DÍAZ-MAROTO et al., 2006) and, in other areas, it is rather more disperse and often mixed with Quercus robur L. (DÍAZ-MAROTO et al., 2005). Rebollo oak is the dominant tree species in Galician native forest (NW Spain) with an oceanic climate and Mediterranean influence, where at present, covers 100,504 ha, in pure stands (DGCONA, 2001). Up to now, no studies have been carried out to determine the site quality of Quercus pyrenaica stands in the area being studied. Nevertheless, during recent decades, there has been increasing interest in the management of broadleaved tree species, due to the current emphasis on sustainable production of stands (DÍAZ-MAROTO et al., 2007). In this sense, site quality is of primary concern in making forest management decisions (BARRIO and DIÉGUEZ-ARANDA, 2005). An index which expresses site productivity is a required variable for the modelling of present and future growth and yield, and it can also be used for forest land stratification for purposes of forest inventory, and for forest exploitation on a sustainable yield basis (GARCÍA, 1983). Site quality should be measured directly in terms of volume yield. Nevertheless, the stand history affects the volume of timber in an area at any time, and we almost never know this history (BAILEY and CLUTTER, 1974; CLUTTER et al., 1983). Stand density at establishment, past cutting, diseases, plagues, and weather can all affect the standing volume, as can the length of forest stand rotation (DAVIS et al., 2001; KURINOBU et al., 2007). Therefore, site quality is frequently made in terms of stand height, because, for many species, areas having good site quality are also where height growth is high (BAILEY and CLUTTER, 1974; CLUTTER et al., 1983). Taking into account that the average height of the stand may be affected by certain types of thinning, but that within a wide range of stand densities the height growth does not seem to be affected – especially when the comparison is restricted to dominant trees (BAILEY and CLUTTER, 1974; CLUTTER et al., 1983) –, the most common approach in determining site productivity involves the use of a site index. This may be defined as the dominant height of the stand at a specific base age (BARRIO and DIÉGUEZ-ARANDA, 2005; ADAME et al., 2006). The aim of this work was to develop a site quality system (both for height growth and site index estimation) for single-species Quercus pyrenaica natural stands in Galicia (NW Iberian Peninsula). MATERIAL AND METHODS Description of sampling and data recording In the winter of 2003-2004, a network of 40 permanent rectangular plots was established in evenaged of rebollo oak in Galicia (Figure 1). The plots were located throughout the area of distribution of this species in Galician territory, and were subjectively selected to represent the existing range of ages, stand densities and sites (DÍAZ-MAROTO et al., 2006; KURINOBU et al., 2007). The plot size ranged from 130 to 2,120 m2, depending on stand density, in order to achieve a minimum of 50 trees per plot. Two dominant trees were destructively sampled at 28 locations; in the rest of plots it was not possible to fell no dominant tree, due to several reasons: 1) stand density was extreme, thus, the height growth of dominant trees was affected, 2) silvicultural treatments affected the upper canopy (e.g., pollarding and felling of trees to provide firewood and food for livestock) (CARVALHO et al., 2005), and 3) the topography of some stands and the impossibility to locate to their owners. These trees were selected as the first two dominant trees found outside the plots but in the same stands within ± 5% of the mean diameter at breast height (dbh) and mean height of the dominant trees (considered as the 100 largest-diameter trees per hectare) (HUMMEL et al., 1959). The trees were felled leaving stumps of average height of 0.12 m; total stem length was measured to the nearest 0.01 m. The logs were cut at 1 m intervals except the first, which was cut at 1.3 m (dbh). Number of rings was counted at each cross-sectioned point and then converted to stump age. As cross-section lengths did not coincide with periodic height growth (NIGH, 1995), there was adjusted the height/age data from stem analysis to account for this bias using Carmean’s method (CARMEAN, 1972), and the modification by NEWBERRY (1991) for the topmost tree section, based on earlier studies of Dyer and Bailey (1987). After examination of data of trees with past height growth abnormalities, stem analyses of 56 trees were selected for modelling dominant height throughout the stand life. Descriptive statistics (number of sections, mean, minimum, maximum, and standard deviation) of the selected data were calculated for total tree height grouped by age classes (Table 1). Methods for constructing a site index model According to Clutter et al. (1983), most techniques for site index curves construction can be viewed as special cases of three general methods: 1) the guide curve method, 2) the parameter prediction method, and 3) the Algebraic Difference Equation Method. Although the three methods are not mutually exclusive, the difference equation method has been the preferred form and widely used by numerous authors in order to develop site index curves (BAILEY and CLUTTER, 1974; CIESZEWSKI, 2003; CARVALHO and PARRESOL, 2005; DIÉGUEZ-ARANDA et al., 2005a, 2005b; ADAME et al., 2006; DIÉGUEZ-ARANDA et al., 2006). The difference equation method makes use of dynamic site equations for modelling the dominant height-age relationship (BAILEY and CIESZEWSKI, 2000a; NORD-LARSEN, 2006). Dynamic site equations have general form (omitting again the vector of model parameters): Y = f (t,t0,Y0 ), where Y is the function’s value at age t, and Y0 is the reference variable defined as the function’s value at age t0. Advantages of dynamic site equations have been pointed out in several studies (e.g., CIESZEWSKI, 2003): they are base-age-invariant, and they define height-growth and site index models as special cases of the same equation, two desirable properties in most applications. The invariant or unchanging property of dynamic equations refers to predicted heights: any number of points (t0,Y0 ) on a specific site curve can be used to make predictions for a given age t and the predicted height Y will always be the same. This includes forward and backward predictions, and the path invariance property that ensures the result of projecting first from t0 to t1, and then from t1 to t2, being the same as that of the one-step projection from t0 to t2. Nord-Larsen (2006) noted that some models have been called “base-age or reference-age invariant”, since do not have these comprehensive invariance properties. Bailey and Clutter (1974) formalized the base-age invariance property and presented a technique for dynamic equation derivation which is known in forestry as the Algebraic Difference Approach (ADA), and that essentially consists of replacing a base-model’s site-specific parameter with its initial-condition solution. Cieszewski and Bailey (2000b) introduced a generalization of the ADA, the Generalized Algebraic Difference Approach (GADA), which can be used to derive the same models derived by the ADA. The main advantage of the GADA is that one can expand the base equations according to various theories about growth characteristics (e.g., asymptote, growth rate), allowing more than one parameter to be site-specific, and letting the derivation of more flexible dynamic equations (see CIESZEWSKI, 2002 and 2003; CIESZEWSKI et al., 2007). It includes the ability to simulate concurrent polymorphism and multiple asymptotes, an important property of site equations (CIESZEWSKI, 2002; KURINOBU et al., 2007). Models considered A large number of researchers have pointed to desirable attributes for site equations (BAILEY and CLUTTER, 1974; BAILEY and CIESZEWSKI, 2000a; CIESZEWSKI, 2002 and 2003; NORD-LARSEN, 2006). The most frequently listed criteria are: polymorphism, sigmoid growth pattern with an inflexion point, horizontal asymptote at old ages, logical behaviour (height should be zero at age zero and equal to site index at reference age; the curve should never decrease), base-age invariance, and path invariance (KURINOBU et al., 2007). The fulfilment of these attributes depends on both the model construction method and statistical procedures used, and it cannot always be achieved (BARRIO and DIÉGUEZ-ARANDA, 2005). Multiple asymptotes is also a desirable attribute (CIESZEWSKI, 2002), although some of the functions generally used have a single asymptote. This may not be an important problem whether the behaviour of curves is suitable for the range of ages that would be used in practice, and whether the single asymptote is achieved at very old ages (CIESZEWSKI, 2004). With these criteria in mind, there were examined different base models and tested several variants for each one which were developed using the GADA. Both one and two parameters were considered to be site-specific. Finally, the efforts were focused efforts on four dynamic equations. As general notational convention, a1, a2… an, were used to denote parameters in base models, while b1, b2… bm, were used for global parameters in subsequent GADA formulations. All the GADA based models have the general implicit form the equation: Y = f (t,t ,Y ,b ,b ,Kb ). Two models were tested on the basis of the function proposed by Bartalanffy (1949 and 1957) and formulated by Richards (1959), whose form can be, for simplicity, represented as: Y = a1(1−exp(−a2t))a3 (1) Where: a1 is an asymptote or limiting value, a2 is often called a “rate parameter”, and a3 is often referred to as “an initial pattern parameter”. This model is very flexible and has been frequently used for site-index curve development, including with the GADA approach (e.g., GARCÍA, 1983; BIGING, 1985; CARVALHO and PARRESOL, 2005; DIÉGUEZ-ARANDA et al., 2005b). The first model derived by applying the GADA to equation (1) considers only the shape parameter a2 to be site-specific (in this case GADA is equivalent to the ADA). Its GADA formulation results are: Y = b1(1− exp(− Xt))b3 (2) The solution for X in equation (2) with initial condition values t0 and Y0 (X = f (t ,Y )) for t and Y, respectively, is:
Substituting X into equation (2) results in the following dynamic equation that provides polymorphic curves with a single asymptote:
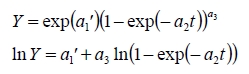
To derive models with both polymorphism and variable asymptotes from equation (1), more than one parameter has to be a function of site productivity. When the parameter a2 varies with site productivity none of the other two parameters a1 or a3 can be used (together with a2) to model the site productivity responses because, when a1 or a3 is a function of X and the parameter a2 is also a function of X, the model cannot be solved for X in a closed-form solution (CIESZEWSKI, 2004). Thus, in the second model derived from equation (1) using the GADA both the asymptote a1 and the shape parameter a3 are assumed to be dependent on X. To facilitate such derivation the base equation is re-parameterized into a form more suitable for manipulation of these two parameters (using exp (a1 ' ) instead of a1 and taking the log of the function) as follows:
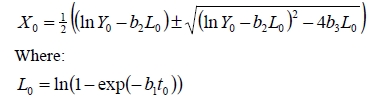
The site parameters can be conditioned to be consistently proportional to each other’s inverse over the site productivity dimension by the following definitions: a1'=X and a3=b2+b3/X, while a2=b1 (5) Which defines the following GADA formulation: lnY = X +(b2+b3/X)ln(1− exp(− b1t)) (6) For this base equation, the solution for X involves finding roots of a quadratic equation and selection of the most appropriate root to substitute into the dynamic equation. The selection of the most appropriate expression for X may depend on the equation parameters that in turn depend on the data and the domain of the applicable ages (NORD-LARSEN, 2006). The solution for X in equation (4) with initial condition values t0 and Y0 is:
Selecting the root more likely to be real and positive (i.e., the one involving addition rather than subtraction of the square root), and substituting it into equation (4) results in the following dynamic equation that provides polymorphic curves with variable asymptotes:
The subsequent models may be viewed as special cases of the log-logistic class of models, which are equivalent to Hossfeld models (BAILEY and CIESZEWSKI, 2000a; NORD-LARSEN, 2006) and have a long history in describing a wide variety of population dynamics. Monserud (1984) applied a log-logistic model to describe the height growth of inland Douglas-fir in the northern Rocky Mountains based on data from stem analysis of dominant trees. Cieszewski (2002; 2003) examined several GADA formulations utilizing the log-logistic model, which can be expressed generally as:
Where: a1 is the asymptote parameter, a2 is the half-saturation parameter that defines the value of exp(− u) at which Y (u)= a1 /2, and u is a linear combination of log-transformations of the independent variable(s) (MONSERUD, 1984; CIESZEWSKI, 2002). Within the different forms investigated, the GADA based formulation by Cieszewski (2002) was found to perform particularly well. It considers the above-mentioned u as a logarithmically transformed function of age, such as u = a3 ln t . Therefore, equation (6) can be simplified as the Hossfeld model:
Cieszewski (2002) replaced a1 with a constant plus the unobserved site variable X, and a2 by b2 /X , becoming the GADA formulation:
The solution for X involves again finding roots of a quadratic equation. With initial condition values t0and Y0 it is:
Selecting the root more likely to be real and positive (i.e., the one involving addition rather than subtraction of the square root), and substituting it into equation (8) results in the following dynamic equation that provides polymorphic curves with variable asymptotes:
The fourth model is the dynamic equation proposed by KcDill and Amateis (1992). It is based on considering parameter a2 in equation (7) as site-specific. After applying the GADA, solving for X and substituting for initial condition values t0 and Y0 results in the following dynamic equation that provides polymorphic curves with a single asymptote:
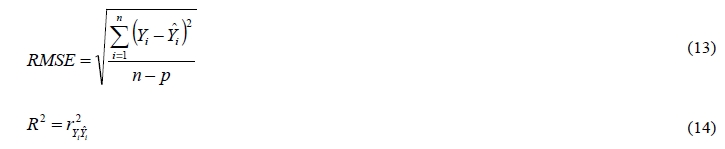
Data structure and model fitting The data structure used for fitting the four models was arranged with all the possible combinations among height/age pairs for each tree, including descending growth intervals. All possible growth intervals typically produce fitted models with a better predictive performance as compared to, for example, forward moving first differences (GOELZ and BURK, 1992; HUANG, 1999). However, this data structure may lead to the rejection of the error assumptions because it automatically introduces a lack of independence among observations (GOELZ and BURK, 1992). Although the bibliography on the proper analysis of longitudinal data is available, the more complicated error structure of this type of data has often been ignored in forestry (GREGOIRE et al., 1995), in part because least squares parameter estimates and resulting predictions are still unbiased in the presence of this autocorrelation. However, least squares parameter estimates are no longer minimum variance estimators; that is, the model mean square error may underestimate the variance of the error terms, invalidating tests of significance (NETER et al., 1990). Autocorrelation can therefore have an adverse impact where the goal is to identify statistically significant predictor variables. Because the aim even-aged, single-species Quercus pyrenaica natural stands in Galicia, initially we did not take into account the autocorrelation being short of independence among observations because of the use of longitudinal data with temporal dependence within each tree (NETER et al., 1990; BARRIO and DIÉGUEZ-ARANDA, 2005). Furthermore, non independent observations imply several disturbances as impartiality of parameters, skewed standard error estimation... In this case, autocorrelation is modelled by expanding the error term as an autoregressive process according to this data structure, fitting the model through generalized nonlinear least squares methods using the SAS/STAT NLIN procedure adjusting data tree by tree(SAS INSTITUTEINC., 2004). Model comparison The comparison of the estimates for the different models was based on numerical and graphical analyses of the residuals. Two statistical criteria were examined: root mean square error (RMSE) and coefficient of determination for nonlinear models (R2) (RYAN, 1997). Although several shortcomings have been stated against the use of the R2 in nonlinear regression, the general usefulness of some global measure of model adequacy would seem to override some of those limitations (MYERS, 1990; RYAN, 1997). These expressions may be summarized as:
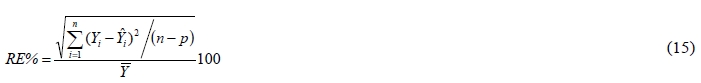
Where: That is why the quality of fit does not necessarily reflect the future prediction quality (MYERS, 1990). Assessment of the validity of the model with an independent data set would be the most desirable (HUANG et al., 2003; KOZAK and KOZAK, 2003). Due to the scarcity of such data, several methods have been proposed (e.g., splitting the data set or cross-validation and double cross-validation), although they seldom provide any additional information compared with the respective statistics obtained directly from models built from entire data sets (KOZAK and KOZAK, 2003). The last step in evaluating the different fitted models consisted of examining visually the residuals against the estimated values, and the fitted curves for different site indices overlaid on trajectories of the heights over time. Visual inspection is essential for selecting the most accurate model, since curve profiles may differ considerably, even though goodness-of-fit statistics are similar (NETER et al., 1990). Selection of reference age for site quality evaluation Practical use of the model to estimate site quality from any given pair of height and age requires the selection of a base age to which site index will be referenced (CLUTTER et al., 1983). Inversely, site index and its associated base age could be used to estimate dominant height at any desired age (BAILEY and CLUTTER, 1974). The base age should be selected so that it is a reliable predictor of height at other ages (GOELZ and BURK, 1996), taking into account the erratic height growth at young ages but considering that a young base age will help in earlier decision making of the silvicultural treatments to be stands applied (DAVIS et al., 2001). In order to address this consideration, different base ages and their corresponding observed heights were used to estimate heights at other ages for each tree. The results were compared with the observed values from tree analyses, and the relative error in predictions (RE%) was then calculated as follows:
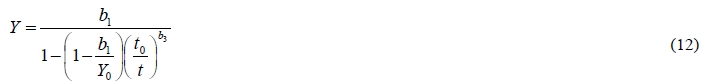
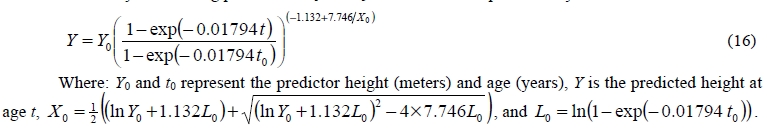
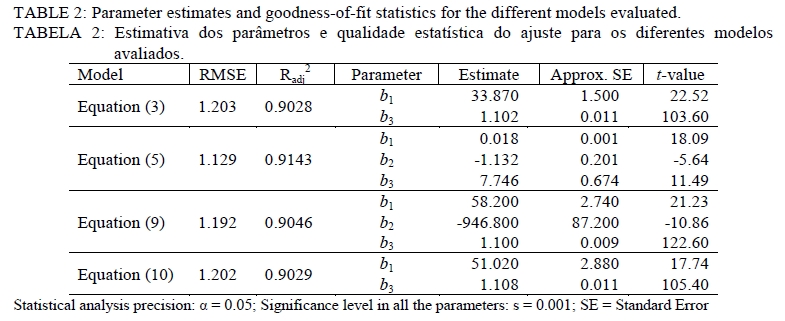
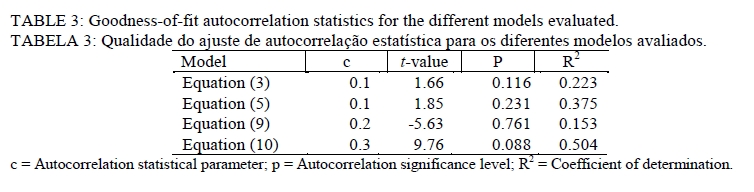
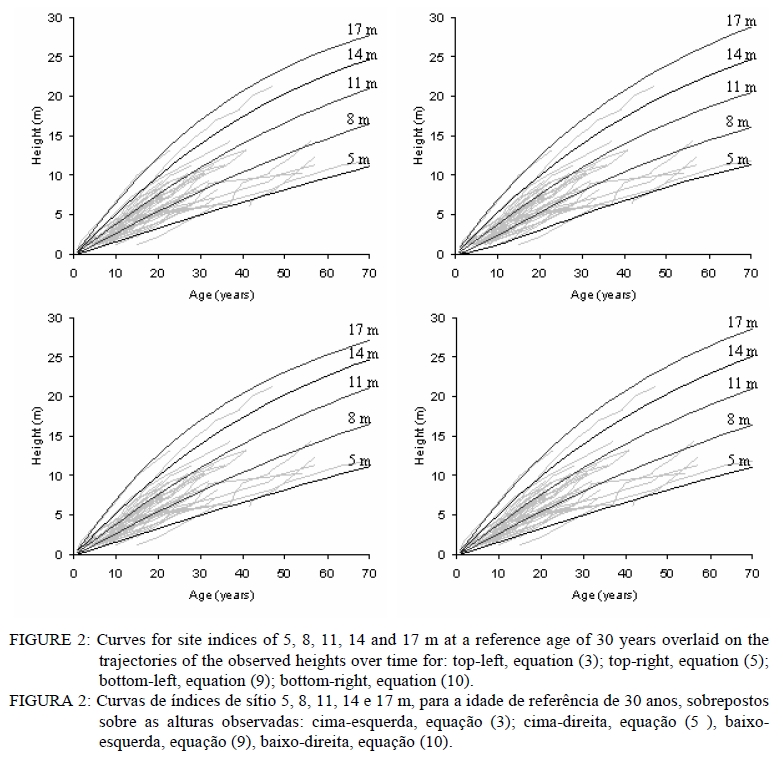
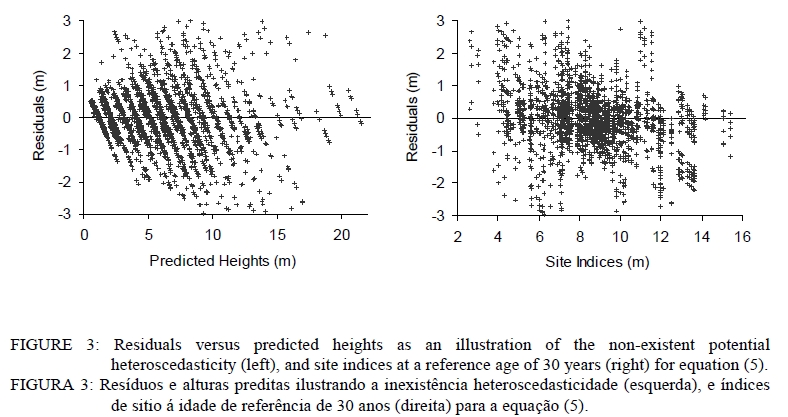
Where: Yi, Yˆiand Y–are the observed, predicted and average values of the tree height, respectively, n is the total number of observations used to fit the model, and p is the number of model parameters. RESULTS AND DISCUSSION The parameter estimates for each model and their corresponding goodness-of-fit statistics are shown in Tables 2 and 3, respectively. The two dynamic equations developed considering only one parameter to be site-specific, equations (3) and (10), in the base model described the data slightly worse than the two-sitespecific parameter models (Table 2), and adjust the resultant model to managed data at 90.3% of accuracy. Within the group with two site-specific parameters, equation (5) provided the best results, as indicated by the graphs that represent the fitted curves for different site indices (Figure 2) and the goodness-of-fit statistics. This model explained 91.4% of the total variability, and provided a random pattern of residuals around zero with homogeneous variance and minor significant trends (by the immaturity stands at reference age of 30 years), both for predicted heights and site indices (Figure 3). The results suggest that the one sitespecific parameter models could be adequate. Nevertheless, the two site-specific parameter equations fitted allow simulating concurrent polymorphism and multiple asymptotes, two desirable characteristics of site (CIESZEWSKI, 2002; CIESZEWSKI et al., 2007). Although this may be of secondary importance, equations that possess these characteristics are more flexible, and better describe a wide variety of height-age trends (NORD-LARSEN, 2006). Thus, among the four dynamic equations finally evaluated for height growth prediction and site classification of even-aged, single-species rebollo oak in Galicia, equation (5) – the GADA formulation derived from the Bertalanffy-Richards model by considering parameters a1 and a3 as related to site productivity – was selected:
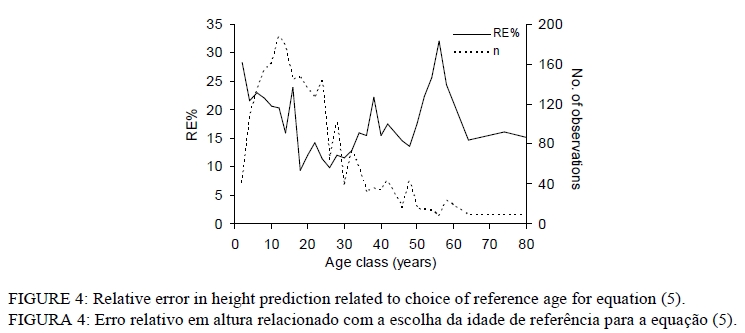
To estimate the dominant height (Y) of a stand for some desired age (t), given site index (S) and its associated base age (tS), substitute S for Y0 and tS for t0 in equation (14). Similarly, to estimate site index at some chosen base age, given stand height and age, substitute S for Y and tS for t in the same equation (14). Equation (14) fulfils all the desirable properties that a site equation should possess: it constitutes a parsimonious, tree parameter, dynamic site equation; it shows no trends in residuals; it predicts height zero at age zero and equal to site index at base age; it is polymorphic with sigmoid curve shapes and varying asymptotes; and, it has the base-age and path invariance properties providing consistent predictions (BAILEY and CLUTTER, 1974; CIESZEWSKI, 2002; 2003; CIESZEWSKI et al., 2002). In selecting the base age, it was found that an age around 30 years was superior for predicting height for other ages with a minimum degree of reliability (Figure 4). Even though at older ages the relative error in predicting height was also acceptable, the scarcity of data would lead to an incorrect decision as the data were not representative enough. Therefore, 30 years are proposed as the base age to which site index will be referenced in order to classify the stands according to their productivity. Initially, all the models were fitted without the autocorrelation parameters, using weighted nonlinear least squares. Afterwards, a test of residuals for autocorrelation was applied using Durbin’s t-test (DURBIN, 1970) with regression of the ordinary least squares residuals and testing the significance of the correlation parameter estimates. As commented, the structure data made hope a high autocorrelation deficiency due to highly correlated residuals. However, the analyzed model does not allow affirm, clearly the existence of influence by data structure. For example, the selected model, equation (5), provided these results: c = 0.1, t = 1.85, P < 0.231, and R2= 0.375 (Table 3); this situation does not imply that if all models were refitted by modelling the error structure the selected was a better model. CONCLUSIONS The typology of Quercus pyrenaica stands in Galicia (NW Iberian Peninsula) difficults the definition of the site equations. To solve this problem, data from stem analysis of 56 dominant trees were obtained, and evaluated with four dynamic site equations. After the study of similar situations, the decision was to apply the Generalized Algebraic Difference Approach (GADA). This implies that all the equations are base-age invariant and directly estimate height and site index from any height and age. The fittings were done using a data structure involving all possible growth intervals that may lead to the rejection of the error assumptions, because it automatically introduces a lack of independence among observations. The GADA formulation derived on the basis of the Bertalanffy-Richards model by considering the asymptote and the initial pattern parameters as related to site productivity. The resulting model is polymorphic with sigmoid curve shapes and varying asymptotes that fulfil all the desirable properties that a site equation should possess: a parsimonious tree parameter dynamic site equation, showing no trends in residuals providing consistent predictions. The Durbin's residuals t-test was used to analyze the autocorrelation without reaching a manifest result of autocorrelation between managed data. Thirty years are proposed as the base age to which site index will be referenced in order to classify the stands according to their productivity, because this age was superior for predicting height with a minimum degree of reliability although, at older ages, the relative error in predicting height was also acceptable. ACKNOWLEDGEMENTS The present study was supported by the Dirección Xeral de Investigación e Desenvolvemento of the Consellería de Innovación, Industria e Comercio of the Xunta de Galicia, within research project PGIDIT02RFO29101PR, developed at the Department of Agroforestry Engineering of the University of Santiago de Compostela. REFERENCES
Copyright 2010 - Ciência Florestal The following images related to this document are available:Photo images[cf10005f1.jpg] [cf10005f2.jpg] [cf10005f4.jpg] [cf10005t3.jpg] [cf10005t2.jpg] [cf10005f3.jpg] [cf10005t1.jpg] |
| |||||||||


