 |
| About Bioline | All Journals | Testimonials | Membership | News |
|
||||||
|
||||||
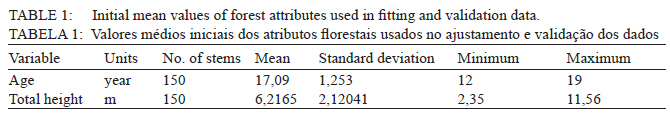
Ciência Florestal, Vol. 21, No. 1, Jan-Mar, 2011, pp. 125-131 Site index models for calabrian pine (Pinus brutia Ten.) in Thasos Island, Greece Modelos de índice de sítio para o pinheiro calabrês (Pinus brutia Ten.) na Ilha Thasos Grécia Kyriaki Kitikidou1 Diamantis Bountis2 Elias Milios3 1. Forester, Dr., Lecturer, Department of Forestry and Management of the Environment and Natural Resources, Demokritus University of Thrace, Pandazidou 193, PO Box 68200, Orestiada, Greece. kkitikid@fmenr.duth.gr Recebido para publicação em 19/10/2009 e aceito em 25/05/2010 Code Number: cf11015 ABSTRACT A site index model for Calabrian pine (Pinus brutia Ten.) in Thasos island (North Aegean sea, Greece) is presented. The model was fitted and validated from 150 stem analyses, obtained from 75 fixed-area plots from five experimental sites. Four height growth equations of difference form were tested and the BAILEY and CLUTTER (1974) function was considered appropriate due to its good performance with both fitting and validation data. The results show errors lower than 5% and little bias. Keywords: difference equations; Pinus brutia Ten; site index model. RESUMO Um modelo de índice de sítio para o pinheiro calabrês (Pinus brutia Ten.) na ilha Thasos Grécia foi apresentado. O modelo foi ajustado e validado com dados de análises de tronco de 150 árvores, obtidas de 75 parcelas de área fixa provenientes de cinco sítios experimentais. Quatro equações de crescimento em altura na forma de diferença algébrica foram testadas, sendo que a função de BAILEY e CLUTTER (1974) foi considerada apropriada devido à sua boa performance tanto com dados de ajuste como os de validação. Os resultados mostraram erros mais baixos do que 5 % e pouco viés. Palavras-chave: Curvas de sítio; Pinus brutia Ten; método da diferença algébrica. INTRODUCTION One of the most important conifer forests in Greece are Pinus brutia Ten. The great ecological variability of this species and the geographical isolation among its populations imply the existence of several geographic races, which present different genetic characteristics and behavior (FRANKIS, 1993). Calabrian pine extends primarily in Turkey and far Eastern Greece, secondarily in the Crimea, Caucasus coast, Azerbaijan, Iraq, Syria, Lebanon, Crete and Cyprus (FRANKIS, 1993). In spite of its low productivity, Calabrian pine plays a very important role in Mediterranean forest ecosystems, with multi-purpose uses like wildlife, hunting, recreation, protection, etc. (FRANKIS, 1993; 1999). Especially important are the stands reforested post-fire in order to prevent soil erosion (FRANKIS, 1993; 1999). A sap-sucking insect, Marchalina hellenica, produces large amounts of honey-dew, harvested by honeybees and sold as “pine honey” (FRANKIS, 1993; 1999). Yield tables are static standmodels, frequently based on fully-stocked stands, which do not accurately reflect the stand evolution under different thinning intensities (GARCÍA, 1994). On the other hand, site index models which include a good description of the state of the stand at any point in time, as well as the change rates as a function of this state are able to adequately predict the stand development. (GARCÍA, 1994), evaluate forest instant changes due to thinning and assess forest productivity (ÁLVAREZ-GONZÁLEZ et al. , 2002). The development of a flexible growth model could facilitate the decision making, in order to guarantee the sustainable management. The modeling level is often dictated by available data, desired level for prediction and time horizon for projection (BURKHART, 2003). In the last few years, some partial aspects of the growth and yield of Calabrian pine in Greece have been studied (HATZISTATHIS et al. , 1995; SKORDILIS and THANOS, 1997; SPANOS et al. , 2000; PALAHÍ et al. , 2008; ADAMOPOULOS et al. , 2009). Data collected in the net of permanent area plots for studying growth in P. brutia stands in Greece (SPANOS, I. et al. , 2000) are limited for the development of an individual-tree model because of the scarce information measured at tree-level. On the other hand, the low economical value and the extensive character of the management of Calabrian pine stands in the Mediterranean area make it advisable to choose a stand modeling level which requires only basic input data, such as site index (ARNOLD et al. , 2005). Taking into account these premises, the aim of this work was to develop a site index model for Calabrian pine in Thasos island (North Aegean sea, Greece), which could be used to evaluate forest productivity and changes due to future thinning (ÁLVAREZ-GONZÁLEZ, J. et al. , 2002). MATERIAL AND METHODS Data Plots from Calabrian pine forests in Thasos island (North Aegean sea, Greece) that were burned in the wildfire of 1989 were established covering different site quality. In order to determine different sites, only large areas that were covered almost totally by Calabrian pine stand were used. Five sites were determined: Site 1 (rock: limestone, soil depth: 50-60 cm), site 2 (rock: limestone, soil depth: 30-35 cm), site 3 (rock: limestone, soil depth: 20-25 cm), site 4 (rock: schist, soil depth: 40-45 cm) and site 5 (rock: schist, soil depth: 20-25 cm). Data were obtained from 75 fixed-area plots, 15 from each site. This network was established in 2008 to assess, among others, forest productivity and attempt the development of a site index model. No silvicultural operations were made in plots. From each plot and in similar stand conditions in each site, two dominant/co-dominant trees were felled at installation time for stem analysis purposes, resulting in 150 trees. From each tree, cross-sectional discs were cut and removed from the stump height (≈0 m), at breast height (1.3 m) and every 1 m, up to the bole. The last disc was collected from the 2 cm-bole diameter. In each cross-sectional disc the number of annual growth rings was counted using the LINTAB system of RinnTech and the program TSAP-Win (RINN, 2003). Annual height values were interpolated from cross section data using the modified algorithm of Carmean (CARMEAN, 1972; NEWBERRY, 1991). Summary statistics are given in Table 1. Fitting method Site index models usually need an index-age to estimate the site index value. Index-age selection may be problematic as results in errors and low flexibility of the shape of the curves and may, also, influence the accuracy of site index estimates (HEGER, 1973). To avoid this problem base-age invariant equations were preferred. Several methods have been proposed in the literature to generate site index curves with desirable characteristics: asymptote, inflection point, base-age invariance or logical behavior among others (GOELZ and BURK, 1992; ELFVING and KIVISTE, 1997). BAILEY and CLUTTER (1974) used an equation of the differential form H2 = f(T2, T1, H1) where H2 and H1 are heights at age T2 and T1, respectively. This method gathers many of the desirable characteristics of a well-behaved site index model. In this study, the BAILEY and CLUTTER (1974) function and the CHAPMAN and RICHARDS (1959) function were considered as candidate functions to be differentiated. There are as many difference equations as parameters in the original function, which may come from height–age equation or differential forms (CAO, 1993). In this work, only those parameters related to growth rate and asymptote were considered as free. In accordance with this, we have fitted four difference form models to our data. Table 2 shows the difference form of all tested functions. According to HUANG (1997), there are six types of data structures that can be used to fit difference equation growth models: The longest non-descending growth interval (I), the longest growth intervals (II), the non-overlapping, non-descending growth interval (III), the non-overlapping growth intervals (IV), the all possible non-descending growth intervals (V) and the all possible growth intervals (VI), and he found that structure type VI provided the most stable and consistent results, as GOELZ and BURK (1992) noted before. In this study, 150 stem analyses and all possible growth intervals were used resulting in 977 pairs of observations. Fitting coefficients from the data of temporal series, such as stem analysis may present auto-correlation. This means that the error term is not independent and does not follow a normal distribution. To avoid this, fitting was performed in a two step procedure using SPSS (LEVESQUE and SPSS Inc., 2006). In the first step the parameters are fitted according to ordinary non-linear least squares. After that, the error term is expanded and the model is fitted again. The expansion of the model leads to a first order auto-regressive procedure in order to make the error term independent. Let the difference model be: Hij = f(Ti ; Hj ; Tj β ) + eij where Hij is a prediction of height i by using height j, Ti, is age i, Tj is age j, β is the vector of parameters and eij is the error term that is not independent and not identically distributed (MONSERUD, 1984; GOELZ and BURK, 1992; GOELZ and BURK, 1996). This error is expanded in the following way: eij = ρε i-1 j + γεi j -1 + ε ij where ρ is the auto-correlation between the residual of estimation Hij and the residual that corresponds to estimation Hi−1 when Hj is used as a predictor variable, γ is the relationship between the current residual and the residual from estimating Hi using Hj−1 as a predictor variable. εij represents independent errors, with mean value equaling zero and constant variance equaling η2. ρ and γ have no further use in the site index model as ε−1 (εi−1, j and εi, j−1 values) is not observable without stem analysis (MONSERUD, 1984). Validation method For site index model validation purposes, data were split in two groups. The first group (80% of the trees – 120 stem analyses) was used as fitting data, and the second group (20% of the trees – 30 stem analyses) was used as validation data. This validation method is known as cross-validation (EZEKIEL and FOX, 1959; LAIRD and CADY, 1969; STONE, 1974; MARQUARDT and SNEE, 1975; McCarthy, 1976). The significance of the bias was studied. Absolute mean residual, AMRES (Eq. (3)), root of mean square error (RMSE) (Eq. (4)) and model efficiency, EF (Eq. (5)) are measures of the accuracy of the model (SOARES et al. , 1995; GADOW et al. , 2001) and they were computed with the fitting data set as well as with the independent data set for validation purposes. The percentage of AMRES and RMSE was also computed. The model that accounted for the best accuracy in fitting and validation data was chosen.
where yi is observed value, yi is estimated value, y is average observed value, n is the number of data and p is the number of parameters in the model. RESULTS Results of the site index models estimation are shown in Table 3. All the parameters are significant except for those of Chapmand and Richards function (Eqs. (2.1) and 1.2) which did not meet the convergence criterion, so it will not be taken into account for further discussion. Errors measures and model efficiency value are better for the Bailey and Clutter model with free asymptote (Eq.(2.1)). The Bailey and Clutter model with common asymptote (Eq. (2.2)) is unbiased. Some bias is shown in the Bailey and Clutter function with free asymptote (0.23 m). With independent data (Table 4), Eqs. (2.1) and (2.2) are quite precise, with relative AMRES lower than 5%. Eq. (2.2) is statistically biased, resulting in overestimation of prediction. Eq. (2.1) is quite precise and shows a little underestimation that it is not statistically biased. Moreover, the Bailey and Clutter model with free asymptote has better errors measures and efficiency value, so we determine that this model is appropriate for our data and it is chosen as apt for evaluating site quality through site index estimation of P. brutia Ten. Figure 1 shows the curves obtained when heights 3, 5, 7, 9 and 11 are reached at age 16. DISCUSSION The site index model has been developed using a difference equation approach. Among the four tested equations, the Bailey–Clutter expression with free asymptote (Eq. (2.2)) shows the best results with fitting and validation data. The Bailey–Clutter model is a modification of Korf’s equation and presents all the desirable characteristics (BAILEY and CLUTTER, 1974). Among them, polymorphism is sometimes considered (GOELZ and BURK, 1992), although the growth pattern of every species must be studied comparing different sort of equations. In this work, a model with free asymptote and polymorphic has been chosen as appropriate, in similar way as for Pinus pinea L. (CALAMA et al. , 2003), and Pinus pinaster Ait. (BRAVO-OVIEDO et al. , 2004), two others Mediterranean pine species. The anamorphic Chapman and Richards model did not converged, so further studies by regions might be interesting in order to assess the anamorphic growth pattern of the species. Bailey and Clutter’s model is the integral form of a basal area increment model and may be considered part of a growth model (BAILEY and CLUTTER, 1974). In the model proposed for thinned loblolly pine stands (Pinus taeda L.) by CLUTTER (1963), height growth depended on the state of the stand and the site index. RÍO and MONTERO (2001) reported the same result for Pinus sylvestris L. in Spain. Basal area and age are good enough estimators of the state in pine stands where silviculture is applied, on the assumption that the range of ages does not include low values, where growth rate is higher and growth depends more on site index. This indicates that other variables such as site index may not be included in basal area projections for stands of these species (BRAVO-OVIEDO et al. , 2004). A model is often considered adequate when low values for statistics are computed, no bias and high efficiency are found in the fitting procedure; however, a good model should perform properly also with independent data. In this sense, the function developed in this work shows little bias, low error and high efficiency with independent data provided by managed plots. CONCLUSION Modeling is one of the main management keys due to its flexibility and utility in decision planning. In this work, a site index model for Calabrian pine (Pinus brutia Ten.) in Thasos island (North Aegean sea, Greece) is fitted and validated from 150 stem analyses. Stand-level measurements approach seems adequate for the extensive management of P. brutia stands in the Mediterranean area. Nevertheless, if more detailed data are available, as is in our study, a tree-level approach could be interesting in order to investigate some aspects of sustainable management, such as structural diversity or fauna habitat assessment. ACKNOWLEDGEMENTS Special thanks to the Municipality and the Forest Service of Thasos for their cooperation. REFERENCES
Copyright © 2011 - Ciência Florestal The following images related to this document are available:Photo images[cf11015t2.jpg] [cf11015t4.jpg] [cf11015t3.jpg] [cf11015f1.jpg] [cf11015t1.jpg] |
| |||||||||

