 |
| About Bioline | All Journals | Testimonials | Membership | News |
|
||||||
|
||||||
Chilean Journal of Agricultural Research (formerly Agricultura Técnica), Vol. 68, No. 1, Jan-March, 2007 pp. 3-12 Research Low Genetic Diversity Among Garlic (Allium Sativum L.) Accessions Detected Using Random Amplified Polymorphic DNA (RAPD) Escasa Diversidad Genética Entre Accesiones de Ajo (Allium Sativum L.) Detectada Mediante ADN Polimórfico Amplificado al Azar (RAPD) Mario Paredes C.[1]*, Viviana Becerra V.1, María I. González A.1 [1] Instituto de Investigaciones Agropecuarias, Centro Regional de Investigación Quilamapu, Casilla 426, Chillán, Chile. E-mail: mparedes@inia.cl *Corresponding author. Received: 26
April 2007. Code Number: cj08001 ABSTRACT Garlic (Allium sativum L.) is a species of vegetative propagation, showing high morphological diversity. Besides, its clones have specific adaptations to different agroclimatic regions. The objective of this study was to determine the genetic diversity of 65 garlic clones collected in Chile and introduced from different countries, by using RAPD (Random Amplified Polymorphic DNA). Fourty random primers of 10 mers generated a total of 398 bands with an 87% of polymorphism. Each primer amplified between two and 20 bands. The size of the fragments obtained fluctuated between 3200 and 369 bp. The results showed that the clones analyzed had a genetic similarity rate of 94%. In addition, 70% of them were clustered in one major group. However, in spite of that situation several clones have different agronomic characteristics. Key words: Allium sativum, germplasm, genetic diversity, RAPD diversity. RESUMEN El ajo (Allium sativum L.) es una especie de propagación vegetativa, que presenta una amplia variabilidad morfológica. Los clones de esta especie tienen una adaptación específica a diferentes regiones agroclimáticas. El objetivo de este estudio fue determinar la diversidad genética existente en 65 clones de ajos colectados en Chile e introducidos desde diferentes países, utilizando RAPD (ADN Polimórfico Amplificado al Azar).Para esta evaluaciónse utilizaron 40 partidores de 10-mers. Los partidores generaron entre dos y 20 bandas, observándose un alto número de patrones con bandas múltiples. Los fragmentos generados difieren en su tamaño entre 3.200 y 369 pb. Los partidores generaron 398 bandas, de las cuales un 87% fueron polimórficas. El análisis estadístico realizado detectó una similitud genética alta, de un 94% entre las accesiones evaluadas, donde aproximadamente un 70% de los clones formaron un grupo homogéneo. Sin embargo, este grupo incluye clones que presentan diferentes características agronómicas. Palabras clave: Allium sativum, germoplasma, diversidad genética, RAPD. INTRODUCTION Botanically, garlic belongs to the genus Allium, family Alliaceae, which includes important vegetable crop such as onion (Allium cepa), leek (A. ampeloprasum) and shallots (A. ascalonicum). Garlic is a diploid species (2n = 2x = 16) of obligated apomixis, therefore its reproduction is vegetative (McCollum, 1987; Figliuolo et al., 2001; Ipek et al., 2003; 2005). Its primary center of origin is Central Asia (Kazakhstan), and the secondary center is the Mediterranean and Caucasus zones (Etoh and Simon, 2002). The value of garlic as a crop has been recognized from very ancient times; it is estimated that it has been cultivated for over 5000 years. During all this time it has been used as food, condiment and medicine by many civilizations in Asia and the Mediterranean region (Ipek et al., 2005). The DNA content of garlic is 32.7 pg per 2C nucleus, which is one of the largest genomes among cultivated crops (Ranjekar et al., 1978, Ipek et al., 2005), and with a wide kariotype variation (Jones and Rees, 1968). The garlic genome has low guanine-citocine (GC) content and a large amount of repetitive DNA (Kirk et al., 1970). The first two low density genetic map generated by self-pollination of unrelated plants consisting of amplified fragment length polymorphism (AFLPs) and gene-specific markers spanned 1166 cM and 862 cM, respectively (Ipek et al., 2005). The different garlic species are classified in four groups: longicuspis, ophioscorodon, sativum, subtropical and the pekinense sub-group. The longicuspis group is considered the oldest and it is postulated to be the original group. The ophioscorodon group is distributed in Central Asia, the sativum group in the Mediterranean zone and the subtropical in the south and southeast of Asia. Finally, the pekinense group comes from the east of Asia (Maaß and Klaas, 1995). In spite of its infertility, garlic shows wide morphological and agronomic variations in characteristics such as color and size of the bulb, plant height, flowering, number and size of the cloves, days to harvesting, resistance to storage capacity, dormancy and adaptation to agroclimatic conditions (Pooler and Simon, 1993b; del Pozo et al., 1997; Lallemand et al., 1997; Lopez et al., 1997; Matus et al., 1998; Figliuolo et al., 2001). The analysis of the morphologic and physiologic variability of garlic has allowed for a subdivision of the A. sativum species into two horticultural groups: sativum (common or Mediterranean garlic) and ophioscorodon (Asiatic garlic) (Jones and Mann, 1963; Hanelt, 1990). Later on, these two groups were called subspecies, which in turn they were divided into diverse groups or varieties. The ophioscorodon subspecies generally develops floral stalks and includes two varieties: ‘Rocambole’ and ‘Continental’. The sativum subspecies does not develop floral stalks and it has three sub-groups: ‘Artichoke’, ‘Silverskin’ and ‘Asiatic’ (Etoh and Simon, 2002). The characterization of garlic germplasm has been based mainly on phenotypic characteristics. However, morphological characteristics can vary under different agroclimatic conditions. This situation adds complexity to the characterization of garlic clones (Bradley et al., 1996; Al-Zahim et al., 1997). To eliminate some of these limitations, biochemical (Pooler and Simon, 1993a; Lallemand et al., 1997) and molecular markers (Wilkie et al., 1993; Bark, and Havey, 1995; Maaβ and Klaas, 1995; D´Ennequin et al., 1997; Dubouzet and Shinoda, 1999; García Lampasona et al., 2003; Volk et al., 2004; Rosales-Longo et al., 2007, Ovesna et al., 2007) have been used in genetic diversity studies of this species. At present, the Instituto de Investigaciones Agropecuarias (INIA) has a collection of naturalized and introduced garlic clones, coming from diverse agroclimatic zones. This germplasm has been evaluated for its agronomic and physiologically characteristics (Del Pozo et al., 1997; Matus et al., 1998), and to select material adapted to different agroecological conditions. The objective of this study was to determine the genetic diversity of the garlic clones maintained ex situ in the Germplasm Bank at INIA, by means of RAPD (Random Amplified Polymorphic DNA). MATERIALS AND METHODS Plant material Sixty-five garlic clones from the INIA´s Germplasm Bank, maintainedex situ at the Santa Rosa Experimental Station, Chillán (36º36` S; 72º06` W) were evaluated. This collection of genotypes contains clones collected in the country and others introduced from different regions of the world (Table 1). Table 1. Allium sativum accessions analyzed by Random Amplified Polymorphic DNA (RAPD). Cuadro 1. Accesiones de Allium sativum analizadas mediante la Amplificación de ADN al Azar (RAPD)
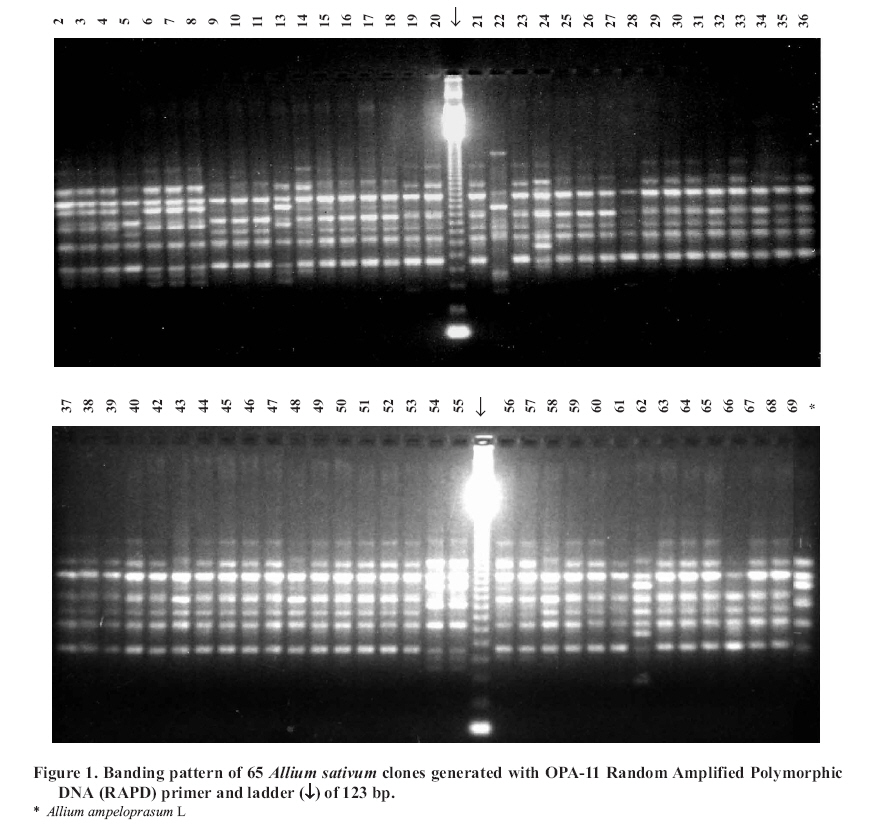
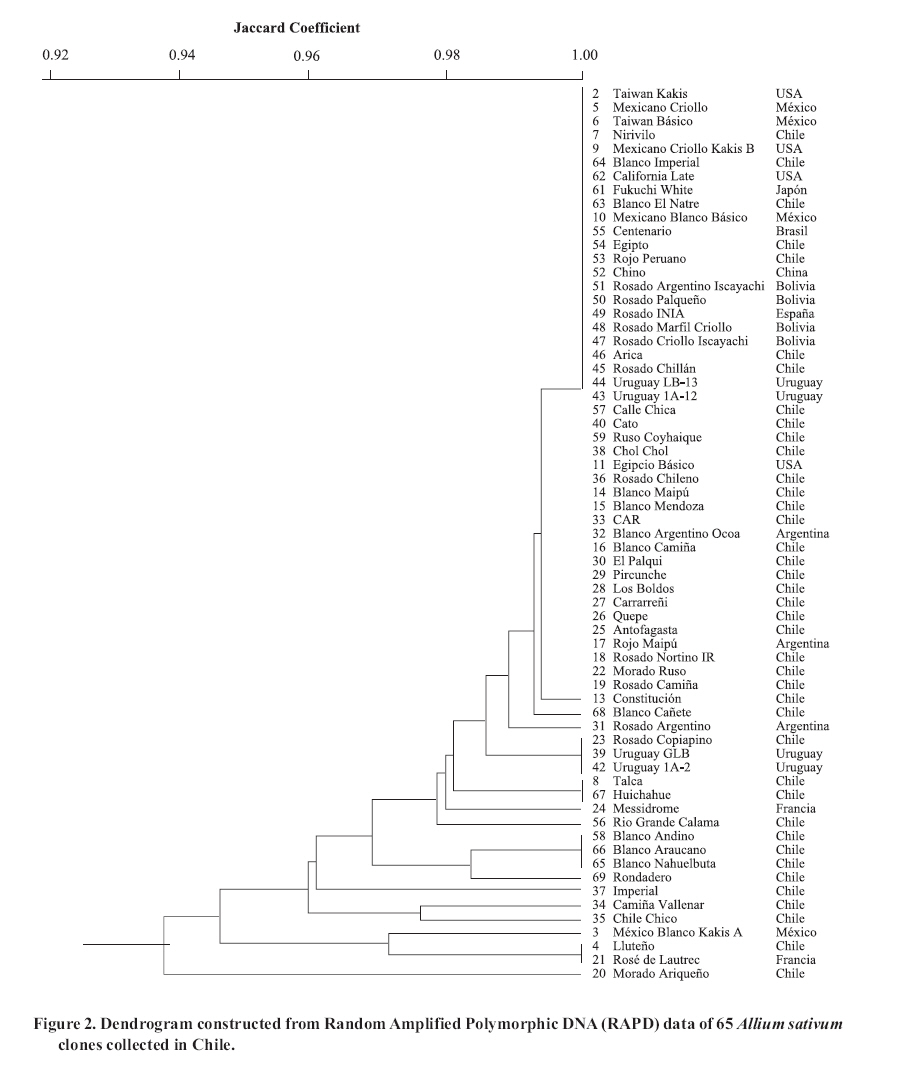
IX Region: Region of La Araucanía; X Region: Region of Los Lagos Method DNA extraction. The total DNA was extracted from healthy leaves, previously stocked at -85 °C. The samples were grinded in liquid nitrogen and incubated at 65 °C during 1 hour using the SDS extraction buffer, pH 9.5 (Tris 50 mM, NaCl 0.7 M, EDTA 10 mM, SDS 1%, b-mercaptoethanol 1% and PVPP 5%) (Becerra-Velásquez and Gepts, 1994). The samples were then centrifuged at 5000 rpm to separate the phases. The water phase was extracted twice with chloroform:isoamyl alcohol (24:1) and centrifuged at 5000 rpm during 15 min. DNA was precipitated with isopropanol and the DNA pellet was washed in 76% alcohol and ammonium acetate (10 mM). The pellet was finally dried and suspended in TE (Tris 10 mM, EDTA 1 mM, pH 8.0). The DNA was quantified in a fluorometer DyNA QuantTM 200 (Hoeffer, San Francisco, USA) and the samples were diluted to 5 hg mL-1. An electrophoresis in agarose 1% was carried out to verify the DNA quality, using λ HindIII as a standardfor the size of fragments. Genetic characterization. The genetic characterization was carried out by using 40 RAPDs primers (10 mers) belonging to OPA 01-20 and OPB 01-20 series (Operon Technologies, Alameda, California, USA). The amplification conditions were optimized until a high reproducibility of the band patterns was obtained. The final reaction volumewas 25 mL, which contained 10 mM Tris-HCl, pH 8.3, 1.0 mM MgCl2, 50 mM KCl, 0.4 μM primers, 1 unit of Taq-polimerase (Invitrogen, Carlsbad, California, USA), 0.05 mM dNTPs and 25 ηg DNA template. The amplification conditions were as follows: three initial cycles at 95 ºC for 1 min, 48 ºC for 1 min, 72 ºC for 2 min, continuing with 40 cycles at 94 ºC for 30s, 48 ºC for 40s, 72 ºC for 2 min, and an extension period of 72 ºC for 10 min (PTC-220 Thermocycler, MJ Research, Watertown, Massachussets, USA). The amplification product was separated by electrophoresis in agarose gels (2%) in 1 X TAE (Tris acetate 40 mM, EDTA 1 mM, pH 8.0) at 100 V for 3.5 h, followed by ethidium bromide staining. The gels were visualized and photographed under ultraviolet light for their evaluation (Transluminator MacroVueTM, Hoefer, San Francisco, California). All amplifications were duplicated to verify the stability of the results. Data analysis. Only reproducible bands were considered to evaluate the results. Each band was considered as an independent attribute and was accounted for qualitatively by its presence (1) or absence (0) generating a binary matrix. The genetic similarity between genotype pairs was estimated using the Jaccard similarity coefficient with the SIMQUAL option. The similarity matrix was calculated by means of sequential, agglomerative, hierarchical and nested clustering (SAHN) (Sneath and Sokal, 1973). The dendrogram was generated by the hierarchical method and the UPGMA grouping algorhythm The COPH option was used to generate a matrix of cophenetic values. The MXCOMP option of this matrix was used to calculate the correlation between the cophenetic correlation matrix and the original grouping matrix (SIMQUAL). This analysis measures if the original data are represented in the grouping analysis with 1000 permutations, which generates a cophenetic correlation value (r). It is considered that a correlation value of r = 0.9 shows a good adjustment (Mantel, 1967). These analyses were made using the NTSYSpc 2.1 program (Rohlf, 2000). RESULTS AND DISCUSSION Vegetative propagation of garlic has been used for many centuries; therefore the presence of genetically closely related clones and the presence of duplications in the germplasm banks are two facts that can be taken into account. A molecular marker such as RAPD, which does not require prior information from DNA sequences of the species, could be very useful to evaluate the genetic diversity of the garlic clones currently available at INIA´s Germplasm Bank. In this study, the analysis of the 40 RAPD primers generated a total of 398 bands, of which 87% detected polymorphism. The total number of bands per primer ranged between 2 (OPA-4) and 20 (OPA-19), and with a molecular size between 3200 and 369 pairs of bases (pb) according to the l HindIII as a molecular standard (Figure 1). Due to the large number of bands which detected polymorphism (346) in this analysis, it can be said that the RAPDs gave a good approximation of the genetic relationship existing among the evaluated clones. It is assumed that the amplified DNA fragments (amplicons) that co-migrate in the different accessions are similar in their sequences. Wilkie et al. (1993) isolated and analyzed several common RAPDs garlic bands and analyzed their homology by means of a DNA hybridization process under two types of astringency, low and medium-high. The results obtained indicated that all the common RAPDs bands isolated of similar intensity showed high homology. However, in the gel some of these common bands showed signals of hybridization of different strength, which would indicate the existence of some differences in sequences homology. Another study, carried out on garlic using AFLP amplicons, pointed out that 95.4% of the fragments analyzed had a high homology rate at DNA sequences level (Ipek et al., 2006), and that the possibly errors in the sequence homology of the RAPDs amplicons was due to chance, and that their effect was very slight upon the average similitude of genotypes of Brassica and Helianthus analyzed (Adams and Rieseberg, 1998). To avoid this problem, only the bands showing similar intensity, consistent and clear were used in the genetic analysis of the amplification products. RAPDs analysis indicated that there is little genetic diversity among the clones analyzed (Figure 2) in spite of a high number of bands that detected polymorphism. This situation might be due to the fact that most of these polymorphic bands showed a low frequency in the genotypes evaluated. The coefficients of similarity of the analyzed genotypes generated a dendrogram that grouped the accessions into two main clusters. The first group included a total of 44 clones (68%). This group is homogeneous, with a 100% of genetic similarity for the RAPD primers analyzed and included clones from different geographical origins. This cluster includes clones which emit a floral stalk (Rosado Argentino Iscayachi, Rosado INIA, Uruguay LB-13, CAR, Rojo Maipú, Rosado nortino IR, Morado Ruso y Rosado Camiña), while others do not do so (California Late, Calle Chica, Ruso Coyhaique, Chol Chol, Pircunche, Los Boldos, Carrarreñi and Quepe) (Matus et al., 1998). The second group clustered 21 clones (l6.9%), with a relatively higher RAPD diversity compared with the first group. However, the genetic diversity level is still very low, since the percentage of the similarity ranged between 94 and 98% (Figure 2). Clones of different origin and with variable phenotypic characteristics were also found within this group. Similar to the first group, clones that always emit a floral stalk (Uruguay GLB and Camiña Vallenar), and others do not (Blanca Cañete, Huichahue, Blanco Andino, Rondadero, Chile Chico and Rosé de Lautrec) were included in this cluster (Figure 2). A previous analysis with RAPDs discriminated a group of accessions that emitted floral stalk from those that did not (Al-Zahim et al., 1997). This association was not detected in this study and a possible explanation is that different genotypes and RAPD primers were used. This aspect is important, because it has been reported that the emission of a floral stalk is a relatively stable trait (Etoh and Simon, 2002). The cophenetic correlation coefficient between the cophenetic matrix and the original RAPDs data was 0.98; this indicates that the original matrix data is well represented in the dendrogram. The genetic analysis also showed that some clones genetically similar such as clones Talca and Huichahue; Rosado Copiapino, Uruguay GLB and Uruguay 1A-2 (Figure 2), also show similar phenotypic characteristics. This situation confirms the lack of association between genetic and phenotypic diversity, implying that RAPDs polymorphism is not linked to phenotypic variation, Besides, many agronomic important traits are controlled by a relative small number of genes with an important phenotypic effect but a low representation in the genome, as compared with the molecular markers which, due to their abundance, can represent in a better way the genetic diversity of the material analyzed. The presence of a greater morphologic variability on agronomic traits in the accessions (Bradley et al., 1996; Pooler and Simon, 1993a; Matus et al., 1998; Ipek et al., 2003; Volk et al., 2004) as compared to the molecular data can be explained because these two kinds of data have probably been subjected to different evolutionary factors. The phenotypic variability presented by this species could be explained by an intense selection pressure on the species during the domestication process. The better the selected characteristic adapts to the environment, the greater it is the probability to survive in time (Gepts, 2004). For instance, those characteristics having high heritability can cause a strong impact on the maintenance of phenotypic diversity. Figliuolo et al. (2001) determined high heritability values, over 60%, for plant height. Besides, they indicated that plant height is strongly correlated to the bulb weight and its diameter. It seems that two types of garlic have been selected over time, one with a high number of small cloves per bulb and another with larger size and less cloves per bulb. In spite of this situation, it is possible to find also some accessions with a high number of cloves and a high bulb weight. Other forces that could contribute to the high phenotypic variation are: the presence of a possible progenitor (A. longicuspis) which reproduces sexually (Koul et al., 1997), infection by virus and viroids, high response to different climatic conditions particularly photoperiod and temperature (Bradley et al., 1996; Ipek et al., 2003), mutations (Koul et al., 1997; Volk et al., 2004), somatic crossing-over and somaclonal variation produced through in vitro culture of the clones (Ordoñez et al., 2002). On the other hand, the genetic uniformity observed at the molecular level in the garlic collection analyzed, agrees with the vegetative reproduction system of the species, the importance to have duplicated clones in the germplasm, and the neutral characteristic of the molecular markers. A study carried out by Rosales-Longo et al. (2007) where 43 garlic accessions of the “chileno” type and 27 of the “criollo” type were analyzed using AFLP, determined that the accessions classified as “chileno” type showed less genetic diversity than the accessions identified as “criollo”. Volk et al. (2004) analyzing a garlic collection located at the Plant Introduction Station in Pullman, Washington, U.S.A., detected that 41% of the clones were duplicated. The strong selection pressure on agronomic characteristics in many cases does not affect the molecular markers that are generally neutral and can be subjected to genetic drift, unless those sequences were linked to these agronomic and/or adaptative traits. This situation also has been observed in the species at the biochemical level. A study carried out in a collection of clones coming from 25 countries by using biochemical markers, determined low isozyme variability for 65 evaluated clones. Apparently, the low variability between garlic groups was only due to the presence of one or a few mutations, which were not accompanied by important changes in the rest of the genome (Lallemand et al., 1997). In absence of the common sexual reproduction system available in garlic, random and induced mutations, polyploids (Volk et al., 2004; Koul et al., 1997) and the production of true seeds (Kamenetsky et al., 2004) could be the only sources of genetic variability available for the breeding programs. The production of true seeds was achieved in Japan (Etoh, 1997), Germany (Konvicka, 1984, cited by Simon, 1993) and the U.S.A. (Pooler and Simon, 1993a; Jenderek and Hannan, 2004). This situation opens a new and a greater possibility for the future genetic improvement of this species (Simon, 1993; Koul et al., 1997), because the sexual reproduction in some garlic accessions could be used as a mean to improve the tolerance to biotic and abiotic conditions, quality and the production of virus-free plants (Kamenetsky et al., 2004). The low genetic diversity present in the garlic Chilean collection can be partially explained by the origin of the collected material maintained in the Germplasm Bank. This collection is composed with accessions collected in America (Chile, U.S.A., Mexico, Bolivia, Uruguay, Argentine), Europe (Spain, France) and Asia (China, Japan), and does not have genetic material from the center of origin or diversity of the species. Besides, it is most probable that the material naturalized in Chile was previously introduced from one of the countries mentioned before and not directly from the center of origin of the species (Central Asia). Therefore, the possibility of selecting superior clones within this germplasm is low, therefore it is very important to expand the sources of origin of the Chilean germplasm. The reduction of the genetic diversity during the domestication and dissemination process of a crop is widely accepted (Gepts, 2004; Zeder et al., 2006). The magnitude of the bottleneck depends on the number of individuals in the foundational population and the duration of this process (Lallemand et al., 1997; Zeder el al., 2006). This phenomenon has been measured by biochemical (isozymes, storage proteins) and molecular markers such as RFPL, RAPD, AFLP and sequencing DNA data (Hyten et al., 2006). For instance, in garlic Etho et al. (2001) detected a greater genetic diversity among the garlic accessions collected in Central Asia, the primary center of origin of the species, compared with those collected outside of the center. The fact that there is no association between the genetic diversity of the garlic naturalized in Chile and the site of collection may be due to the exchange of genetic materials among the different geographic zones. In addition to, the agro-climatic situations are not contrasting enough for the natural and artificial selection processes could favor new clones adapted to specific regions of the country. This lack of correlation between genetic diversity and site of collection was also obtained by Ipek et al. (2003) and Volk et al. (2004). Although there is low genetic diversity as detected by the RAPD, this molecular marker could be used to identify some of these clones. This information could be quite useful to complement the morphologic and agronomic information necessary for the registration of some of these clones, maintain the purity of the variety and protect the breeders`rights of some of the selections. However, to improve the identification process of these clones it is necessary to incorporate another type of molecular markers which would allow the detection of greater genetic differences among clones. Ipek et al. (2003) and Volk et al. (2004) pointed out that the AFLPs could be useful to differentiate garlic clones that had not been individualized by RAPD and isoenzymes. However, Ipek et al. (2003) indicated that both molecular markers (RAPD and AFLP) showed 96% correlation, grouping the same accessions in similar clusters CONCLUSIONS
ACKNOWLEDGMENTS The authors wish to thank the financing of the INIA to develop this research and to Ms. Patricia Herrera for her collaboration in the sampling of the evaluated germplasm. LITERATURE CITED
The following images related to this document are available:Photo images[cj08001f2.jpg] [cj08001f1.jpg] |
| |||||||||
