 |
| About Bioline | All Journals | Testimonials | Membership | News |
|
||||||
|
||||||
Chilean Journal of Agricultural Research (formerly Agricultura Técnica), Vol. 68, No. 1, Jan-March, 2007 pp. 42-55 Research Effect of Agricultural Intervention On The Spatial Variability of Some Soils Chemical Properties in the Eastern Plains of Colombia Efecto de la Intervención Agrícola Sobre la Variabilidad Espacial de Algunas Propiedades Químicas de Suelos en los Llanos Orientales de Colombia Jesús H. Camacho-Tamayo[1]; Carlos A. Luengas[2]; Fabio R. Leiva[3]* [1] Universidad Nacional de Colombia, Facultad de Ingeniería, Programa de
Ingeniería Agrícola, Apartado Aéreo 14490, Ciudad Universitaria, Bogotá,
Colombia. E-mail: jhcamachot@unal.edu.co Received: 8
Febrero 2007. Code Number: cj08005 ABSTRACT Growing demand for food exerts pressure on natural resources and may lead to the expansion of agricultural frontiers in developing countries. Most of this pressure appears in tropical zones, in native savannahs, with naturally infertile soils prone to degradation. Crop management in these regions is based on generalized estimates, leaving aside the inherent soil variability, leading to low production efficiency and high risk of environmental damage. This study aims at determining the spatial variability of some chemical properties, including organic carbon, pH, exchangeable acidity, exchangeable aluminum, P, Ca, Mg, K and Na for two Oxisols with different levels of agricultural intervention, in Puerto Lopez, Colombia, in order to identify guidelines for site-specific management. A forty-two point grid (25 ´ 25 m) was established for samplings at two depths: 0-100 and 100-200 mm. Descriptive statistics and geostatistics were used to analyze soil properties spatial dependence. Variogrammodels were obtained and from them maps of properties were drawn using ordinary punctual kriging. The results showed that spatial variability of the soil chemical properties depends upon the use of amendments, fertilizing methods, tillage and the inherent characteristics of each variable analyzed. A greater influence of the agricultural intervention on spatial variability was evident in the upper 100 mm of soil. Spatial dependence was found for most of the studied soil properties. However, K and Na presented variograms with pure nuggeteffects and/or very short ranges. The information generated is a base to derive guidelines for site-specific agriculture. Key words: geostatistics, kriging, soil management, precision agriculture. RESUMEN La creciente demanda por alimentos ejerce presión sobre los recursos naturales y puede conducir a la ampliación de la frontera agrícola en países en desarrollo. Esto ocurre principalmente en zonas tropicales, en sabanas nativas, con suelos de baja fertilidad y susceptibles a degradación. El manejo de cultivos en esas regiones se basa en recomendaciones generalizadas, sin considerar la variabilidad del suelo, conduciendo a baja eficiencia productiva y alto riesgo de degradación ambiental. Este estudio tuvo como objetivo determinar la variabilidad espacial de propiedades químicas, incluyendo carbono orgánico, pH, acidez intercambiable, aluminio intercambiable, P, Ca, Mg, K y Na en dos Oxisoles con diferentes niveles de intervención agrícola, en Puerto López, Colombia, para generar recomendaciones de manejo sitio-específico. Para el ensayo se estableció una cuadrícula de 42 puntos (25 x 25 m), para muestreo a 0-100 y 100-200 mm de profundidad; el análisis se realizó mediante estadística descriptiva y geoestadística. Se obtuvieron modelos de variogramas y mapas mediante kriging ordinario puntual. Los resultados mostraron que la variabilidad espacial de las propiedades químicas del suelo depende de las prácticas de fertilización y enmiendas, del sistema de labranza y de características inherentes a cada propiedad. La mayor influencia de la intervención agrícola en la variabilidad espacial ocurrió en los primeros 100 mm de profundidad. Si bien la mayoría de las variables evaluadas presentaron dependencia espacial, K y Na presentaron variogramas con efecto pepita puro o rangos bajos. La información generada es una base para establecer recomendaciones en agricultura sitio-específica. Palabras clave: geoestadística, kriging, manejo del suelo, agricultura de precisión. INTRODUCTION Oxisols are among the world's most important soils, with an estimated extension of 9.81 million km2, which makes them the seventh most common soil order. They are considerably more abundant in the tropics (24.5%), being the most common soil order and covering 9.61 million km2 of the world’s tropical surface (USDA, 1999). In South America, Oxisols are mainly located in Brazil, Colombia and Venezuela, and are generally occupied with low nutritional pastures for extensive cattle production. In Colombia, this soil order is present mainly in the Eastern Plains, occupying 253000 km2 (Jaramillo, 2002) and usually has low base saturation, high acidity, high Al saturation, low soil organic matter, low P levels and low micronutrient content. Crop production under such conditions requires soil amendment. In the last two decades improved grasses have been introduced and in areas with mechanized agriculture the land use has been changed to corn (Zea mays L.) and soybean (Glycine max (L.) Merr.) crops, utilizing conventional tillage practices and blanket applications of amendments without considering the soil properties. This management is inadequate because the application of inputs and the farming practices in general do not fit the specific needs of soil and crops, leading to increased production costs, lower profits, risk of water pollution, and lower energy efficiency (Bocchi et al., 2000). Soil variability occurs due to factors acting at several spatial and temporal scales, produced by complex pedologicalprocesses (Burrough, 1993), relief and moisture regimes (Rezaei and Gilkes, 2005). However, crop management also alters soil variability (Burgos et al., 2006), particularly due to tillage and fertilizing practices (Kiliç et al., 2004). Sampling errors lead to misjudgements about existing soil variability (Marques Júnior and Cora, 1998). Thus experimental error must be diminished by improving sampling methods. Characterization of soil spatial variability allows for a better understanding of the complex relations between soil features and the environment (Goovaerts, 1998), helping to determine appropriate soil use practices (Bouma et al., 1999). Interest in having representative information on soil spatial variability has grown, resulting in the development of models and management systems (Godwin and Miller, 2003). Although site-specific soil management is unfeasible if the cost of the required analyses is high (Bongiovanni and Lowenberg-DeBoer, 2001), determining soil properties variability allows for establishing adequate sampling distances and possible dependence among two or more variables, which may lead to reducing sampling costs. Abreu et al. (2003) found high heterogeneity for different soil properties in Brazilian Oxisols and reported spatial dependence ranges and suitable zones for site-specific management. Following the same methodology on an Alfisol, Silva et al. (2004) obtained broader ranges, which indicates the need to perform studies on different soil orders. Furthermore, cropped soils tend to present a greater spatial dependency as depth increases, because management leads to surface homogeneity (Souza et al., 2006). This study was aimed at determining the spatial variability of some chemical properties, including organic carbon (OC), pH, exchangeable acidity, exchangeable aluminum, P, Ca, Mg, K and Na for two Oxisols, one with a high level of intervention and the other with a lower level, with the purpose of identifying guidelines for site-specific agricultural practices. MATERIALS AND METHODS Sites description. Two sites in Puerto López, Colombia, were chosen to develop this research: the Taluma Experimental Station (TES) (4°22’ N, 72°13’ W) and the Santa Cruz Farm (SCF) (4º10’ N, 72º39’ W). The soil in TES was a Typic Haplustox, while in SCF it was a Typic Hapludox (USDA, 2003). The region has a unimodal rainfall regime with an average annual precipitation of 2375 mm and a mean temperature of 27 ºC. Despite similar annual precipitation, a more uniform distribution on SCF was observed, and the soil remains moist most of the year. Soils on both sites were acid, with low organic matter, low P, high Al saturation, low Ca, Mg, K, S, B, Cu, Mn, and Z, a low Ca-Mg relation, low base saturation, low cation exchange capacity and high Fe (Jaimes et al., 2003), but have relatively good physical properties. Nutrient loss due to leaching is relatively low, with estimates (kg ha-1 per crop cycle) of 1.6 for Ca and under 1.0 for P, Mg, Na and K (Unpublished results from project “Desarrollo de prácticas de manejo y conservación de suelos para el sistema de producción maíz en la Altillanura Colombiana”, by CORPOICA, Colombia). The sites presented different agricultural intervention cycles. In TES, the dominant species before agricultural intervention was native grass “paja peluda” (Trachypogon vestitus Anderson). By the time of this study (2003), only one cropping cycle with soybean had been conducted. Before sowing, dolomite lime was applied using a disc plow followed by two disc harrow passes in 2003. In SCF, native grass was replaced by braquiaria (Brachiaria grass) five years before agricultural intervention. Before this study, six-month alternate rotations of corn and soybean had been conducted for three years. Dolomite lime was applied before the first crop cycle, using a chisel plow followed by two disc harrow passes. No further soil amendments had been applied. At both sites, lime incorporation was made at a dosage of 2 Mg ha-1 at an average depth of 200 mm. The soil was prepared in both fields every six months with a reduced tillage system using a chisel plow and disc harrow; fertilizing was carried out based on soil analysis. Soil measurements. The experimental plot was a 42 point (25 ´ 25 m) grid (seven rows and six columns). At each node of the grid, 1 kg soil samples were taken at two depths: 0-100 mm and 100-200 mm. These depths take into account previous research projects at the sites and were chosen in order to compare soil variability at a 100-200 mm depth to that in the upper 10 cm of soilwhere agricultural intervention and crop root density are higher. Sampling was carried out during May 2004 in TES and August 2004 in SCF. The variables were measured as follows: OC by the modified Walkley Black method; pH with a potentiometer (Schott CG842, Mainz, Germany) at a 1:1 soil:water ratio; exchangeable acidity (Ac.E) and exchangeable aluminum (Al.E) by titration; phosphorus (P) by Bray II; and total bases, Ca, Mg, K and Na, through extraction with ammonium acetate pH 7.0 (USDA, 2004). Statistical and geostatistical analysis. Statistical analysis was performed in two stages. First, descriptive statistics including mean, standard deviation, variance, minimum and maximum values were calculated for each soil property, using the SPSS statistical software, version 11.0 (Norušis, 2002.). Second, geostatistical analysis was used to describe soil property spatial dependency. To determine each variable spatial dependence, the variogram was used (Vieira, 2000), assuming intrinsic stationarity. GS+ software (Robertson, 1998) was used to build the experimental variogram for each soil property and to choose the best fitted theoretical model according to r2 criterion. The fitting models were spherical, linear, exponential and gaussian, as described by Vieira (2000). Nugget (C0), sill (C) and the range of each variogram were used for interpretation of spatial dependence. Next, using the chosen variograms and ordinary punctual kriging, distribution maps were drawn for the different soil properties under study, using the Surfer software (Golden Software Inc., 1999). Ordinary punctual kriging was chosen since means were unknown (Vieira, 2000) and the interest of the study was to predict each variable on unsampled points, rather than to interpolate over areas (Cressie, 1993). Pearson correlation tests were made to determine interactions between variables, sampling depths and plots. No evaluation was made of the statistical significance between pairs of variables showing spatial correlation, since the corresponding standard error for the sampling correlation coefficient may be under or overestimated, affecting the validity of the pertinent hypothesis test. A cross-variogram was used in order to identify spatial correlation between pairs of variables that showed high Pearson correlation coefficients, utilizing the gstat library of R software (Pebesma, 2004). RESULTS AND DISCUSSION Statistical analysis. The descriptive statistical results of both sites are displayed in Tables 1 and 2. The pH spans from very acidic to acidic, considered normal for such soils. A pH value under 4.5 indicates a high availability of exchangeable Al, which generates plant toxicity (Jaimes et al.,2003; Silva et al.,2003). TES presents the highest pH in the upper 100 mm depth, probably due to the liming treatment used shortly before. The exchangeable acidity (Ac.E) values ranged between 0 and 2.3 cmol kg-1 with saturations between 46 and 69%. This farm presents lower soil acidity than SCF, which favors crop development. Organic C content decreased as depth increases; the values found are similar to those reported by Jaimes et al. (2003). The highest OC values are found in SCF, suggesting improved soil fertility. This may reflect the effect of crop residues left on the surface and low soil disturbance by the reduced tillage system used. Table 1. Descriptive statistics of soil chemical properties at two depths. Taluma Experimental Station (TES). 2003. Cuadro 1. Estadística descriptiva de las propiedades químicas del suelo a dos profundidades. Estación Experimental Taluma (TES). 2003.
SD: statistical deviation Previous fertilizing has notably increased the P levels of both sites, particularly in the upper 100 mm, so that now the plots presented higher P availability than the native savannahs, with just 1 mg kg-1 (Jaimes et al., 2003). However, soil P variability was considerably high, particularly in SCF (Tables 1 and 2). On the other hand, SCF shows better levels of P and OC, indicating the advantage of agricultural intervention processes with repeated fertilizations and crop residue handling for several years, similar to reports by other authors on Brazilian soils (Silveira et al., 2000; Silva et al., 2003). Table 2. Descriptive statistics of soil chemical properties at two depths. Santa Cruz Farm (SCF). 2003 Cuadro 2. Estadística descriptiva de las propiedades químicas del suelo a dos profundidades. Finca Santa Cruz (SCF). 2003
SD: statistical deviation Both sites showed very low exchangeable bases with average Ca content between 0.52 and 1.46 cmol kg-1, Mg between 0.25 and 0.65 cmol kg-1, and K between 0.04 and 0.19 cmol kg-1. Nevertheless, these values are higher than those reported for native savannah in these Oxisols (Jaimes et al., 2003), although lower than those found in soils under cultivation in Brazil (Silveira et al., 2000; Silva et al., 2003). The values for the chemical properties in both sites indicated the effect of agricultural intervention on this type of soil, showing an increase of soil fertility compared to the native savannah, with higher P availability, lower acidity and exchangeable Al, better base content and therefore a greater percentage of base saturation. Nonetheless, a gradual decrease of the bases is observed as the number of cultivation cycles increases, which is confirmed by the rise of Ac.E and Al.E, and consequently the soil pH reduction. This suggests the need for soil amendment application after three years or after six cultivation cycles. Spatial analysis at 0-100 mm depth. No unique model was found from the variograms for the chemical properties at this depth (Table 3). The OC’s spatial behavior at this depth presented a range over 25 m in SCF, with a defined model that allows drawing a reliable map to be used as a tool for site-specific management. The range values found in this study are lower than those reported by Souza et al. (2003), but higher than those from Silva et al. (2003). This indicates that for the upper 100 mm depth, the soil OC’s spatial dependence was not affected by the incorporation of amendments or by the tillage system, despite presenting different soil moisture regimes of the two locations. Table 3. Parameters of the variogram models obtained for the soil chemical properties, at 0-100 mm depth, at Taluma Experimental Station (TES) and Santa Cruz Farm (SCF). Cuadro 3. Parámetros de los modelos de variogramas obtenidos para las propiedades químicas del suelo, entre 0 y 100 mm de profundidad, para la Estación Experimental Taluma (TES) y la finca Santa Cruz (SCF).
1 C0: nugget; 2 C: sill;3C0/(C0+C): spatial structure; 4NE: pure nugget effect Phosphorus presented a 373 m range in TES and 38 m in SCF, contrasting with the 53 m reported by Silveira et al. (2000) in a Brazilian Oxisol and even more in contrast to Carvalho et al. (2003), who found a 2 m range in a 75 m2 grid. This variable in TES showed a linear model with a C0/(C0+C) relation, defined as a spatial structure by Cerri et al. (2004), which suggests a moderate spatial dependence.Conversely, in SCF the spatial structure of P is close to zero, indicating a high spatial dependence. The behavior of P under the conditions of this study suggests that further research on spatial behavior of this variable is required. The pH, Ac.E and Al.E presented ranges of 410, 30 and 9 m in TES, whereas in SCF they were 67, 62 and 96 m, respectively, which are greater than those reported by Silva et al. (2003), but with similar pH to that reported by Vieira and Paz-Gonzalez (2003). In SCF the range values for these three soil properties are very similar, suggesting that the spatial variation of one affects the other. The opposite occurs in TES, where no relation among these properties seems to exist, which suggests a possible effect of liming on their spatial variability, indicating a better spatial structure in SCF than in TES (Table 3). The behavior of Ca, Mg and K may have been affected by agricultural intervention. In TES, Ca did not present a spatial correlation, while Mg fitted an exponential model. In SCF, these properties fitted exponential models with a range of 26.1 m for Ca and Mg. This behavior may be explained by chemical intervention and particularly by application and incorporation of amendments. In TES, in accordance to range values and spatial structure, K did not show definite correlation or variogram model fitting, probably because of its relatively low mobility in soil and the row fertilizer distribution pattern. However,it showed a moderate spatial dependence in SCF. This behavior may be partially explained by the higher level of agricultural intervention with fertilizers and tillage in SCF. However, the high range found for K in this study suggests that further research is required on spatial behavior of this variable. Spatial analysis at 100-200 mm depth. The variogram models obtained at this depth in both locations are shown in Table 4. Phosphorus showed a pure nugget effect in SCF, indicating total absence of spatial autocorrelation,probably due to the high variability found in this property (Table 2). The range of P was 14.2 m in TES, similar to the value found by Silveira et al. (2000), and presents a high spatial dependence. Since the results for this variable at the upper depth showed a moderate spatial dependence, this suggests there is some effect from recent row fertilization at depth between 50 and 100 mm in TES. The range of OC in SCF at the second depth is similar to the one found in the upper 100 mm, but in TES at 100-200 mm depth this variable showed a pure nugget effect, indicating there is not spatial dependence for this variable in recently intervened soil. Low differences between the two locations were found when examining the range values for pH, Ac.E, Al.E, Ca and Mg at 100-200 mm depth. This suggests a negligible effect from agricultural intervention on the spatial behavior of such variables at this depth. Vieira and Paz-Gonzalez (2003) also found that pH and Mg fitted spherical models. Table 4. Parameters of the variogram models obtained for soil chemical properties, at 100-200 mm depth, at Taluma Experimental Station (TES) and Santa Cruz Farm (SCF). Cuadro 4. Parámetros de los modelos de variogramas obtenidos para las propiedades químicas del suelo, entre 100 y 200 mm de profundidad, para la Estación Experimental Taluma (TES) y la finca Santa Cruz (SCF).
1 C0: nugget; 2C: sill;3C0/(C0+C): spatial structure; 4NE: pure nugget effect The models obtained for Na and K indicate an unreliable spatial behavior that does not permit issuing site-specific management recommendations. Further studies at shorter sampling distances are needed to identify representative models. The fitting models for most of the properties are exponential or spherical, similar to studies reported by Sun et al. (2003) and Souza et al. (2006) for soil chemical properties. Linear and spatial correlation. The linear correlation analysis for TES shows a close relation among pH and all the variables at the upper depth (Table 5). This variable presents an inversely proportional correlation with Ac.E and Al.E and direct with Ca and Mg. This is in accordance to theory, since low values of pH lead to higher values of Ac.E and Al.E due to higher H+ and Al+3 concentrations in soils. On the other hand, as pH increases the availability of Ca, Mg and K increase. The OC shows a directly proportional correlation with pH, and Ac.E and Al.E are lower when the OC is higher, indicating the dampening effect of organic matter on soil acidity. There is also evidence of improved levels of Ca, Mg and K at sites with higher levels ofOC, which is attributed to the direct effect of organic matter on the soil charge. That effect is particularly noticeable in Oxisols with low charge density in the inorganic fraction. Table 5. Linear correlation of the chemical properties, at 0-100 mm depth at Taluma Experimental Station (TES). Cuadro 5. Correlación lineal de las propiedades químicas, entre 0 y 100 mm de profundidad en la Estación Experimental Taluma (TES).
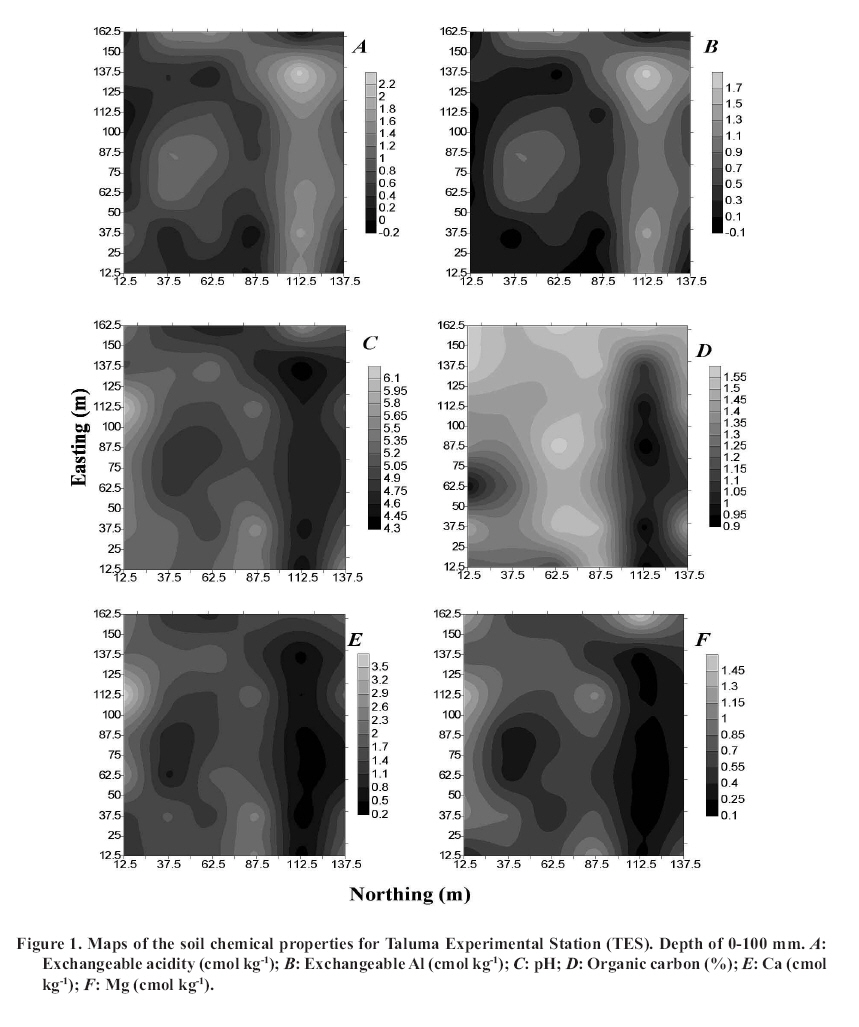
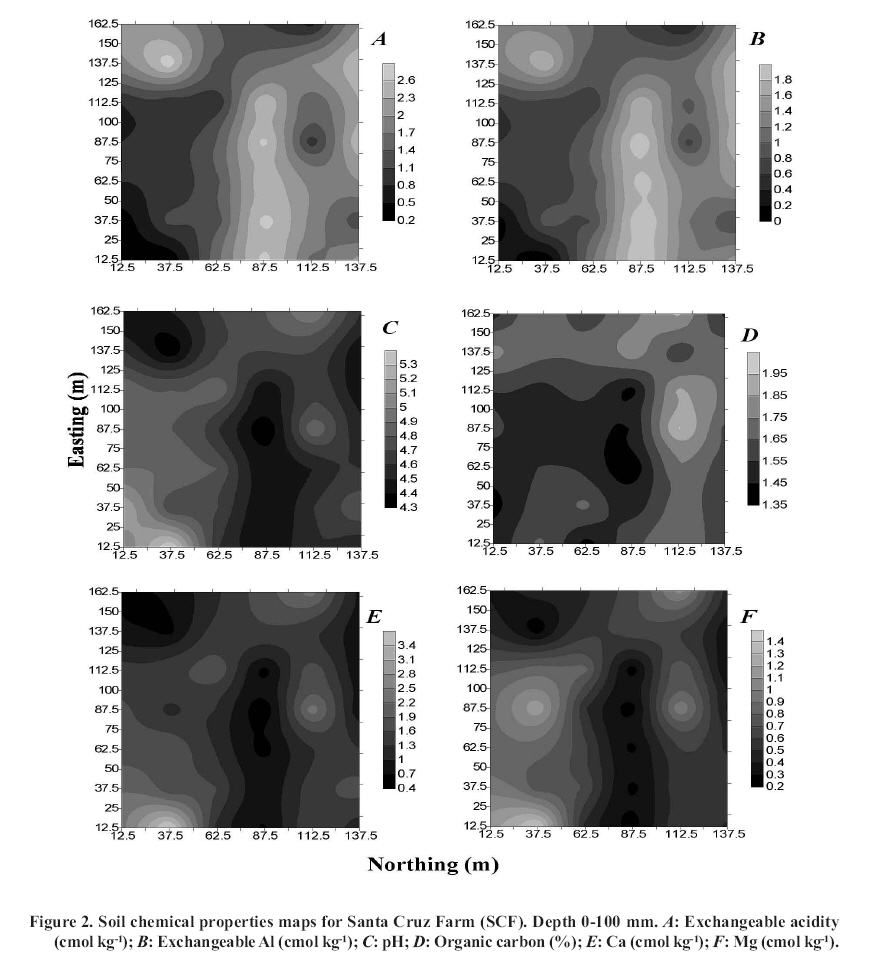
Ac.E: exchangeable acidity; Al.E: exchangeable Al Phosphorus correlated only with soil OC content at the upper depth, probably due to P supplied by both organic matter and fertilization in TES. In general, the total bases rose as a result of liming and fertilizing. The correlations mentioned above can be corroborated in the spatial interpolation carried out with kriging, where a significant spatial relation is clear among Ac.E, Al.E, pH and OC. Zones with greater pH and OC present lower values of Ac.E and Al.E, as well as higher Ca and Mg concentrations (Figure 1). According to theory, pH presents an inverse relation with both Ac.E and Al.E, and a direct correlation with Ca, Mg and K contents at the upper depth in SCF (Table 6). In general, the correlation results in SCF are similar to those found in TES for the same depth, showing that liming or fertilizing did not affect the behavior of the relation among the properties in these soils. The maps obtained from the spatial interpolation through kriging show this same trend. Close linear and spatial relations between Ac.E and Al.E and between these two with pH were also found (Figure 2A,B, andC). Table 6. Linear correlation results for the chemical properties, at 0-100 mm depth, at Santa Cruz Farm (SCF). Cuadro 6. Correlación lineal de las propiedades químicas, entre 0-100 mm de profundidad en la Finca Santa Cruz (SCF).
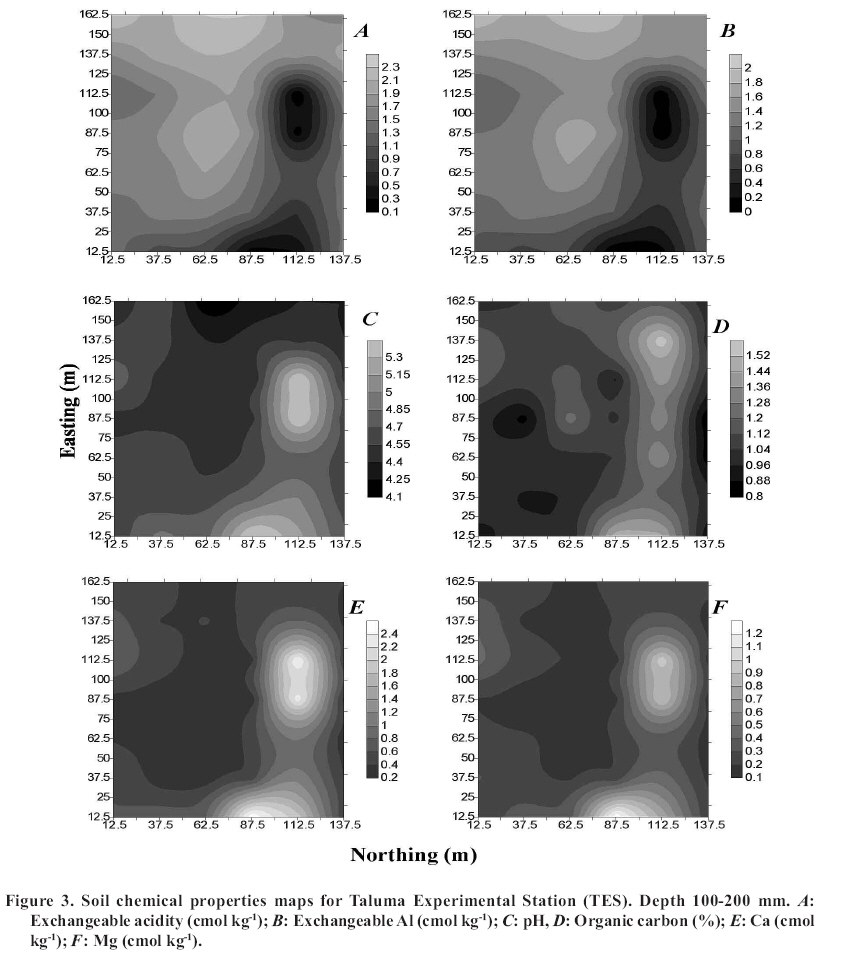
Ac.E: exchangeable acidity; Al.E: exchangeable Al In SCF, conversely to what was found at TES, at the upper depth OC did not correlate with any of the three variables mentioned above. However, a similarity is observed among OC, pH, Al.E and Ac.E by examining the maps, which suggests that Al toxicity decreases as OC increases (Figure 2D). Thus, for SCF, the OC may become an important input for crop production, because of its positive effect as a booster of the soil chemical properties. Unlike TES, P did not correlate with OC. The relatively high levels of P may be caused by fertilizing. The chemical properties showed higher linear correlation at 100-200 mm depth than those at 0-100 mm depth for both sites (Tables 7 and 8). The ranges of the cross variograms (results not shown) indicate that the linear correlation mentioned above occurs at a distance of about 32 m in TES at both depths, meanwhile in SCF, the site with greater agricultural intervention, the ranges were close to 40 m at the upper depth and about 53 m at the second depth. This suggests that agricultural intervention has a greater effect in the upper 100 mm soil depth in the soils under study. Organic C plays an important role in both sites, since a higher OC may improve several soil properties and lead to enhanced soil fertility. Figure 3 for TES and Figure 4 for SCF display the soil chemical property maps for depths between 100 and 200 mm. The high correlation among the chemical properties for that depth in both sites is evident. No maps were included for K and Na because they presented variograms with pure nuggeteffect. Nonetheless, these two soil properties are linearly correlated, which allows for predicting each other values. Table 7. Linear correlation results for the chemical properties, at 100-200 mm depth, at Taluma Experimental Station (TES). Cuadro 7. Correlación lineal de las propiedades químicas, entre 100-200 mm de profundidad, en la Estación Experimental Taluma (TES).
Ac.E: exchangeable acidity; Al.E: exchangeable Al Table 8. Linear correlation results for the chemical properties, at 100-200 mm depth, at Santa Cruz Farm (SCF). Cuadro 8. Correlación lineal de las propiedades químicas, entre 100-200 mm de profundidad, en la Finca Santa Cruz (SCF).
Ac.E: exchangeable acidity; Al.E: exchangeable Al CONCLUSIONS The spatial distribution of soil chemical properties is altered by agriculture, particularly by the application of fertilizers, amendments and tillage systems in the upper 100 mm depth of the soils under study, even within a given soil plot. Under continuous cropping using reduced tillage, a gradual decrease of bases is noticed in the studied Oxisols, suggesting the need for liming after three years or after six cultivation cycles. The maps generated from ordinary punctual kriging suggest spatial dependence for most of the soil properties under study. Nonetheless, some variables presented variograms with pure nugget effect and/or very short ranges, therefore, the reliability of the estimated data decreased, as occurred with K and Na. This work allowed for determining the spatial dependence of different soil chemical properties, as well as their mutual correlation, information essential to derive guidelines for site-specific agricultural practices. LITERATURE CITED
Copyright 2008 - Instituto de Investigaciones Agropecuarias, INIA (Chile). The following images related to this document are available:Photo images[cj08005f4.jpg] [cj08005f3.jpg] [cj08005f1.jpg] [cj08005f2.jpg] |
| |||||||||
