|
| About Bioline | All Journals | Testimonials | Membership | News |
|
||||||
|
||||||
Chilean Journal of Agricultural Research (formerly Agricultura Técnica), Vol. 68, No. 1, Jan-March, 2007 pp. 80-93 Research Consumer Perception Of Animal Welfare and Livestock Production In The Araucania Region, Chile Percepción de los Consumidores Sobre el Bienestar Animal y la Producción Ganadera en la Región de la Araucanía, Chile Berta Schnettler M.[1]*, Ricardo Vidal M.[2], Roberto Silva F.1, Lisette Vallejos C.1 and Néstor Sepúlveda B. [1] Universidad de La Frontera, Facultad de Ciencias Agropecuarias y
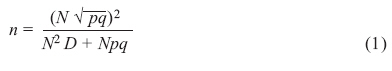
Forestales, Casilla 54-D, Temuco, Chile. E-mail: bschnett@ufro.cl *Author for correspondence. Received: 26 March 2007. Code Number: cj08008 ABSTRACT Given the importance of animal welfare (AW) in developed countries, a survey was carried out among 384 consumers in Temuco, Chile, to establish their knowledge and perceptions about animals handling during production, to detect preferences for meat produced under AW principles, their willingness to pay a higher price for this and to distinguish different consumer segments. Approximately 60% of people surveyed knew about livestock management practices, half of them considered that these practices had a negative effect on the animals, but only 32.1% have changed their meat consumption habits due to this. Seventy percent of the people surveyed had over 50% of knowledge about AW aspects. There is a strong preference and willingness to pay a higher price for meat produced under AW principles. Consumers have a positive perception of the fact that the meat that they consume comes from pasture-fed animals, raised in the open, and raised, transported and slaughtered following humane principles. Three segments were identified by using cluster analysis: the most numerous (58.6%) considers confinement and feeding with concentrates as positive; the second group (25.5%) showed a strong rejection of the use of hormones, feeding with broiler litter and concentrates, and places a positive value on raising animals in the open. The smallest segment (15.4%) placed the highest value on humane treatment of the animals, plus a positive value on concentrates use and rejected confined raising. The conclusion is that a large part of the population perceives AW as a desirable condition when purchasing beef. Key words: animal welfare, market segmentation, cluster analysis. RESUMEN Considerando la importancia del bienestar animal (BA) en los países desarrollados, se realizó una encuesta a 384 consumidores de Temuco, Chile, para determinar el conocimiento y percepción sobre el manejo productivo de animales bovinos y ovinos y BA, detectar la preferencia y disposición a pagar por carne producida con animales tratados con las normas BA y distinguir diferentes segmentos de consumidores. Aproximadamente 60% de los encuestados conoce el manejo del ganado, la mitad considera que éste afecta negativamente a los animales, pero sólo 32,1% ha cambiado sus hábitos de consumo debido a ello. Un 70% de los encuestados tuvo un grado de conocimiento sobre aspectos de BA superior a 50%. La preferencia y disposición a pagar un mayor precio por carne producida con BA son altas. Los consumidores perciben positivamente que la carne que consumen provenga de animales alimentados en praderas, criados al aire libre y que hayan recibido buen trato en el matadero, transporte y predio. Mediante análisis cluster se distinguieron tres segmentos: 58,6% considera positiva la crianza en confinamiento y la alimentación con concentrado; 25,5% presenta alto rechazo por el uso de hormonas, alimentación con camas de broiler y concentrado y valora positivamente la crianza al aire libre; el segmento minoritario, 15,4%, presenta la mayor valoración por el buen trato del animal, valora positivamente los concentrados pero rechaza la crianza en confinamiento. Se concluye que gran parte de la población percibe el BA como una condición deseable al comprar carne bovina, afectando positivamente la adquisición de este producto. Palabras clave: bienestar animal, segmentación de mercados, análisis cluster. INTRODUCTION When making food purchasing decisions, consumers consider different attributes prior to purchase (Engel et al., 1995). These attributes can be divided into intrinsic cues (such as flavor, color, smell) and extrinsic, that is, factors related to the product, but that do not form part of it physically (Steenkamp, 1989). An alternative classification includes a category called “search attributes” (such as price, color, and appearance), “attributes of experience” (such as flavor) and “attributes of credibility” (such health considerations and microbiological safety) (Grunert et al., 2000). Food products are generally classified as “experience goods”, given that the information about their attributes cannot be known until after they are prepared and consumed. Food products are also “search goods” in that their appearance and labels provide information to discriminate among products (color, price). In recent years, an increased concern has been observed among consumers about the way in which food is produced, a factor which is not immediately observable, and thus one that the consumer must be informed about through the label or through advertising, in this way food products become “credibility goods” (West et al., 2001; Schröeder and McEachern, 2004). In the case of meat, the most important attribute in choosing a product is quality. Nevertheless, perceived quality involves numerous attributes, such as color, shape, presentation, price, and brand name, country of origin, commercial establishment, production techniques, nutritional information and convenience or facility of preparation. In this regard, there are a growing number of consumers concerned about the impact of intensive production systems on the environment, animal welfare (AW) and the safety of the food (Blandford and Fulpony, 1999). Intensive systems of cattle production have been criticized by various segments of society. The strong social rejection in favor of AW principles has produced important changes legislation in Europe resulting in controls over cattle production. This has led to modifications in animal production systems, which in turn have affected costs (María, 2006) and which, as well, can produce modifications in the marketing and distribution of meat products (Hobbs, 1996). Schröeder and McEachern (2004) determined that consumers avoid buying meat produced in intensive systems if the treatment of the animal affects the quality of the meat. María (2006) found that consumers in Zaragoza, Spain, had a negative perception about intensive production systems and that over 75% are willing to pay more for food produced under standards relating to AW. Bernués et al. (2003) found that the importance of AW was less than that of the feeding of animals and the origin of meat products for consumers in five European countries. In an exploratory study carried out in Santiago, Chile, Köbrich et al. (2001) determined that 49.2% of those surveyed expressed a “moderately positive” attitude and 28.2% a “very positive” attitude in relation to AW. Between 65 and 80% of the participants expressed a willingness to pay more for food products that reflected a consideration of AW. Changes in the demographic characteristics of consumers have led to variations in the consumption of meats (West et al., 2001; Yen and Huang, 2002). Several research projects have detected differences in the consumption of meat depending on the gender and age of the consumer (Verbeke et al., 2000; Harvey et al., 2001; Beardsworth et al., 2002). Women have more moral and ecological concerns than men, who, for their part, are less critical and more traditional in their eating habits (Beardsworth et al., 2002). As well, there is evidence of greater concern about health and ethical standards among older survey participants (Verbeke et al., 2000). Likewise, it has been noted that there is a lower consumption of meat in families with higher education and with children under 12 years of age (Quagrainie et al., 1998; Verbeke et al., 2000), which is associated with a greater concern about health. Sensitivity with regard to AW is also differentiated according to sex, age, educational level and country of residence (Bernués et al., 2003; María, 2006). Considering that meat occupies an important part of the household food shopping budget (INE, 1997), the objective of the present study was to determine the degree of knowledge and perceptions about animal production and fattening practices and AW, in order to detect preferences and willingness to pay a higher price for meat produced under AW standards, as well as to distinguish distinct segments of the beef consuming market in the Araucania Region of Chile. MATERIALS AND METHODS A personal survey was carried out with a sample of 384 individuals in the city of Temuco (38º45' lat. S, 73º03' long. W) Chile, who met the condition of making meat purchases for their household. The number of survey subjects was obtained through the formula for unrestricted random probabilistic sampling (Scheaffer et al., 1996) according to the population of Temuco in the 2002 Census (245,347 inhabitants) (INE, 2003), considering 95% of reliability, 5% of error of estimation and a maximum dispersion (p = q = 0.5), which implies expecting the greatest level of variation of opinion from the total collective on the analyzed theme with respect to the mean value (Fernández, 2002). The equation used to obtain the sample size (n) was the following:
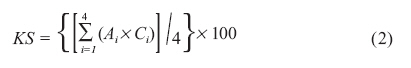
where N = the size of the population; D = the standard deviation of the estimation. A questionnaire with closed questions was used as the instrument for gathering information, with questions relating to the frequency of consuming beef (daily, three times per week, once a week, occasionally), knowledge of the methods of raising and fattening of cattle and sheep (if the respondent knows, does not know), perception of a negative effect of these practices on the animals (yes, no, does not know) and if this has affected the consumption of meat (yes, no, has not considered it), perception of the level of AW in Chile (high, medium, low, does not know), and preference and disposition to pay a higher price for meat produced under AW standards (yes, no). The survey participants were asked with open-ended question as to percentage of a price increase that they would be willing to pay for meat produced under AW principles. As well, questions of gender classification were included: gender (male, female), age (under 35 years of age, between 35-54 years of age, 55 years of age or older), number of household members (1-2 members, 3-4 members, 5 or more members) and the age of the members of the family group (children under 12 years of age, children between 13 and 18 years of age, only adults), occupation (independent small-scale worker, businessperson, agricultural producer, private sector worker, public sector worker, retired, unemployed) and educational level (without schooling, incomplete basic studies completed basic studies, incomplete secondary studies, completed secondary studies, incomplete vocational studies, completed vocational studies, incomplete university studies, completed university studies, or more) of the head of the house, and the ownership of 10 electro-domestic appliances. These last two variables allow for determining the socio-economic group according to Adimark (2004), corresponding to ABC1 (high and middle high), C2 (middle-middle), C3 (middle-low), D (low) and E (very low). As well, the survey subjects were asked if they had visited feedlots for cattle and sheep (yes, only cattle; yes, only sheep; yes, cattle and sheep; no). The survey was applied in two supermarkets in Temuco between October and November of 2006, subsequent to validation of the questionnaire through a prior test with 10% of the sample. Given that it was not necessary to make any modifications to the questionnaire, the surveys necessary to complete the total sample were subsequently carried out. Two questions were included with respect to the degree of knowledge of the survey subjects with regard to aspects of AW. The first question: Have you heard, seen or read anything about animal welfare? served to verify knowledge about the theme. The second item consisted of four true or false questions (The meat from animals that were stressed during slaughter has a lower protein content; the stress experienced by animals prior to slaughter can affect the quality of the meat; the use of electric prods or pointed sticks in the handling of cattle does not affect AW; the pain and physical mistreatment of animals prior to slaughter can affect the final quality of the meat that we consume). These questions served the objective of measuring how correct was the knowledge of the respondents about AW. For each question, the survey participants had to answer true or false and indicate how sure they were of the response, using a 7-point scale (7 = absolutely sure; 1 = completely unsure). The knowledge score was calculated based on their responses according to the following equation (Verdume and Viaene, 2003):
where KS = knowledge score (%); Ai Є {0,1}; Ci Є {0,00; 0,17; 0,33; 0,50; 0,67; 0,83; 1,00}. If the answer (T or F) was correct/incorrect, the score assigned was 1/0 (Ai), respectively. The certainty factor 0.00 was assigned if within the scale of 7 points “one” was selected; 0.17 if “two” was selected; 0.33 if “three” was selected”; 0.50 for selecting “four”; 0.67 for selecting “five”; 0.83 for selecting “six” and 1.00 if “seven” was selected. The KS was obtained by dividing the sum of the four (Ai x Ci) by four and multiplying this result by 100. The results of these questions were analyzed with contingency tables according to the characteristics of the survey participants and the Chi squared statistic, which allowed for inferring if two or more magnitudes of frequency of cases of the population can be considered similar (Levin y Rubin, 1996). In order to determine consumer perception of the meat produced under different systems of management, a Likert scale was used (Kinnear and Taylor, 1989), with five levels(5 = very good, 1 = very bad) for which the survey participants were asked to indicate their perceptions of nine animal production practices. This information was analyzed through descriptive statistics (calculation of means), and subsequently cluster analysis was used to determine consumer segments according to the perception of meat produced with distinct types of animal production practices. As a grouping algorithm, the conglomerated hierarchy option was used, and the measurement of similarity between objects was the Euclidean distance to the square. The Ward method of conglomeration or linking was used (Hair et al., 1999). The number of clusters was obtained through observation of the dendrogram and was confirmed through the determination of the percentage of change of the recomposed conglomeration coefficients. To describe the segments, a Chi-squared test for the discreet variables and a variance analysis were applied with a 95% level of reliability (Lea et al., 1997)and, subsequently, the Tukey multiple comparisons test was carried out (P ≤ 0.05). The program SPSS 14.0 (SPSS, 2005) for Windows was used. RESULTS AND DISCUSSION Consumer knowledge and perceptions about livestock production practices and animal welfare Some 59.1% of the survey participants indicated knowledge of the methods used in the raising and fattening of cattle and sheep (Table 1), a result higher than those obtained by Schröeder and McEachern (2004) in Scotland and by María (2006) in Spain. Statistical differences were obtained in relation to the total sample only in the case of gender, frequency of consuming beef (p ≤ 0.05) and if the consumer had visited feedlots (p ≤ 0.001). In relation to gender, the proportion of men who indicated having knowledge of production methods was greater (70.4%). A similar situation was observed with persons who consume beef once a week (67.6%) and, contrary to what was expected, the percentage of people who consume beef daily and are familiar with methods of livestock management was less than the total sample and equal to the percentage of persons who consume beef occasionally (45.7%). In relation to visits to feedlots, a greater proportion of consumers who had visited feedlots for cattle and sheep indicated having knowledge of livestock production methods (84.9%). Congruently, the consumers who had not visited livestock feedlots indicated in greater number not having knowledge of methods used in animal production. Table 1. Knowledge, perception and effect (%) on meat consumption of livestock raising and fattening methods and perception of animal welfare levels in Temuco, Chile, November 2006. Cuadro 1. Conocimiento, percepción y efecto (%) sobre el consumo de carne de los métodos de crianza y engorda de ganado, y percepción del nivel de bienestar animal en Temuco, Chile. Noviembre de 2006.
SEG: social-economic groups; FG: family group; DK: doesn’t know; HC: hasn’t considered. Among those surveyed who declared knowledge of livestock raising and fattening methods (n = 227), 47.1% considered that these practices produce a negative effect on the animals. Approximately 17% stated that they had no knowledge on the subject. Significant statistical differences were observed with respect to the total sample (p ≤ 0.05) according to gender, age, family group size, occupation, frequency of consuming meat and whether the consumer had visited a livestock feedlot. In relation to gender, the proportion of men who negatively perceive livestock production practices was higher (52.2%), while the percentage of women among those who indicated that livestock production practices do not produce a negative effect was higher (41.1%). In relation to family size, the high proportion of consumers from households with one or two members who indicated that livestock production practices do not negatively affect the animals (51.4%) is notable, similar to what was observed among persons 55 years or older according to the age group (50%), and persons who consume beef daily (50%). Regarding occupation, in relation to the total sample the proportion of unemployed who had a negative perception of the methods of livestock production practices was high (66.7%), which was contrary to the case of retirees (18.8%). In relation to the frequency of consuming meat, the percentage of persons who consume meat occasionally who have a negative perception of livestock management practices was high (81.3%), while in the group that consume meat daily this proportion was less (37.5%), which coincides with what was found in a broad study carried out in the European Union in 2005 (European Union, 2005). Parallel to this, the proportion of individuals who had visited cattle or sheep feedlots and did not perceive negative aspects in livestock production practices was high. These results do not concur with those obtained by María (2006) in relation to greater sensitivity to themes of AW among young persons, women and professionals. Among the consumers who indicated a negative effect of livestock production practices, only 32.1% indicated that this situation affects their consumption of meat (n = 34), while the majority of persons declared not having considered this aspect, which argues a relatively low importance of AW for the consumers surveyed in comparison to results obtained in European countries where AW is a theme of importance (Hobbs, 1996). Significant statistical differences were obtained with regard to the results of the total sample according to age, occupation (p ≤ 0.05), the frequency of consuming meat and if the consumer had visited livestock feedlots (p ≤ 0.001). In the case of age, the differences were mainly due to the greater proportion of persons between 35 and 54 years of age who indicated that their consumption of meat is affected by their negative perception of the handling of animals (42.6%), the contrary occurring with the other age groups. In relation to occupation, the percentage of private sector employees who stated that the methods of livestock production practices had affected their consumption of meat was high (46.8%), with the opposite being the cases with agricultural producers and the unemployed, even when these sub-samples were not representative. With regard to the frequency of consuming meat, clearly the individuals who consume meat on a daily basis in the majority were not affected by livestock production practices (66.7%), while persons who consume meat occasionally predominate among those whose consumption of meat has been affected by livestock production practices (69.2%). The consumption of meat was not affected among consumers who had not visited livestock feedlots or were only familiar with sheep feedlots. With regard to the perception of the level of AW that exists in Chile, 48.4%, the largest proportion of the sample, indicated a moderate level and only a small percentage indicated a high level (6.9%) (Table 1). In relation to the total sample, statistical differences were observed according to the size of the family group (p ≤ 0.05), social-economic group and if the consumer had visited a livestock feedlot (p ≤ 0.001). With regard to the size of the family group, the differences are explained by the high percentage of persons belonging to families with five or more members who indicated a medium level (63.9%), as well as the major proportion of consumers with families of three or four members who indicated a low level (38.0%). With regard to the social-economic group, C2 and D were notable for high percentages in a medium level (60.9 and 100%, respectively), while with C3 the proportion was greater that considered the level of AW to be high (33.3%). With regard to whether the consumer had visited cattle feedlots, the proportion of persons who had visited either cattle or sheep feedlots were greater who indicated the level of AW to be high (12.9 and 18.8%; respectively), while in the majority, persons who had visited both types of feedlots were considered the level to be medium (64.2%) and those who had not visited feedlots considered the level to be low (54.8%). Some 45.7% of those surveyed had received some type of information about AW (Table 2), with statistical differences in relation to the total sample according to occupation, frequency of consuming meat, having visited livestock feedlots (p ≤ 0.05), gender and the age of members of the family group of the consumer (p ≤ 0.001), owing to less access to information on the part of agricultural producers (28.6%), persons who consume beef daily (28.6%), consumers who have only visited cattle feedlots (33.3%), men (30.9%) and families with children between 13 and 18 years of age (29.5%). The determination of a knowledge score (KS) about aspects of AW, through the four questions about the theme which survey respondents had to classify as true or false, yielded a general KS of 60.8% among the total sample, with 7.6% of those surveyed having a KS equal to or less than 25%; 22.1% had a KS of between 26 and 50%; 46.4% had a KS of between 51 and 75% and 24.0% had a KS of between 76 and 100%. Significant statistical differences were obtained according to age, frequency of consuming beef (p ≤ 0.05) and if the consumer had visited livestock feedlots (p ≤ 0.001). Table 2. Knowledge of animal welfare (AW),preference for and willingness to pay (WTP) (%) a higher price for meat produced under AW principles. Temuco. November 2006. Cuadro 2. Conocimiento de bienestar animal (AW), preferencia y disposición a pagar (WTP) (%) un precio mayor por carne producida con bienestar animal. Temuco, noviembre de 2006.
SEG: social-economic groups; FG: family group. Differences according to the age of the consumer were due to the lower proportion of persons under 35 years of age (37.0%) and 55 or over (34.1%) who have a KS between 51 and 75%, as well as the higher percentage of older persons who have a KS between 76 and 100% (31.8%). In relation to the frequency of consuming meat, persons who consume meat daily and occasionally had a high proportion of respondents with a KS between 26 and 50% (34.3 and 37.1%, respectively) and a low percentage with a KS greater than 75% (34.3 and 37.1%, respectively). Likewise, persons who had visited only cattle feedlots had a higher proportion with a KS of 25% or less (15.5%), persons who had only visited sheep feedlots had a percentage with a KS between 26 and 50% (41.2%), and persons who had visited both types of feedlots presented the greatest fraction with a DK greater than 75% (32.9%). The statement that was interpreted correctly by a lowest proportion of persons was “The meat from animals that were stressed during slaughter has a lower protein content.” with 63%. Each of the three other statements was answered correctly by over 85% of those surveyed. A high level of preference and willingness to pay a higher price for meat produced according to AW standards was obtained, with 78.9 and 73.4% of the total sample, respectively (Table 2), similar to what was obtained by María (2006) in Spain, and by Köbrich et al. (2001) in Santiago. In relation to the preference for meat produced with AW standards, statistical differences were observed (p ≤ 0.05) according to the age and occupation of the consumer, there being a lower preference among persons of 55 years of age and more and among the retired. With regard to the willingness to pay, significant differences were obtained according to the age of the consumer, the ages of family members (p ≤ 0.05) and occupation (p ≤ 0.001), owing to a lower percentage of persons of 55 years of age or more, retirees and respondents with families formed solely by adults who indicated a willingness to pay a higher price for meat produced under AW standards (63.6; 52.9; and 66.1%, respectively). Notably, the representativeness of the sub-samples of retirees and persons of 55 years of age and over is relatively low in relation to the total sample (n = 8.9 and 11.5%, respectively), as well as representing to a certain degree the same group of consumers given that 50% of the persons 55 and over indicated that they were retired. These results differ from the increase in concern about health and higher ethical standards detected by Verbeke et al. (2000) among older consumers, and likewise do not concur with those obtained by Schröeder and McEachern (2004), in respect to the fact that the totality of women in Scotland prefer to buy food produced with AW standards, but show a lower willingness to pay a higher price for the product. Nevertheless, the results concur in terms of the greater concern among families with children less than 12 years of age (Quagrainie et al., 1998; Verbeke et al., 2000), given that 81.1% were willing to pay a higher price for meat with AW standards. On average, the survey participants indicated being willing to pay 15.2% more for meat produced with AW standards, with the highest percentages of price increase indicated by persons from the social-economic group C3, businesspeople, agricultural producers and the unemployed, while the lowest levels were registered among the retired and persons who consume beef occasionally. Among the variables of segmentation used, two that should be noted are the frequency of consuming meat and whether the consumer had visited cattle and sheep feedlots, in a manner that knowledge of the productive reality of feedlots influences the perception of consumers. Among the demographic variables, we note the age, gender and occupation of the consumer. In contrast to findings in developed countries, in the case of respondents from families with children less than 12 years of age only indicated a willingness to pay more for meat produced under AW standards, but not a greater concern or ethical awareness. Perception of meat produced with distinct livestock production methods In accordance with the Lickert 5-level valuation scale (5 being very good and 1 very bad), the perception of the nine aspects of livestock production in relation to the quality of meat consumed (Table 3), can be associated with: Aspects of livestock production considered to be very good (valuation between 4.5 and 5.0): consumers considered it very good or good that livestock feeding be based on grazing, that animals be raised free-range, and that there be good treatment of the animals at slaughter, in transport to the market or slaughterhouse and in the feedlot. Aspects of livestock production considered with indifference (valuation between 3.0 and 3.6): at this level, consumers showed indifference toward raising animals in confinement and feeding based on concentrates. Aspects of livestock production considered to be very bad (valuation less than 1.5): survey respondents expressed a negative valuation in the relation to the use of hormones and feeding with broiler litter. Table 3. Valuation of aspects of animal handling related to the perception ofmeat,in groups obtained using cluster analysis. Temuco, November, 2006. Cuadro 3. Valoración de aspectos de manejo de los animales en relación a la percepción de la carne en los diferentes segmentos obtenidos con análisis cluster. Temuco, noviembre de 2006.
* Significant
to 5% Segment
1: Consumers sensitive to natural raising. Present the greatest rejection to
the use of hormones and feeding with broiler litter and negatively value the
use of concentrates. In synthesis, the valuation made by consumers favors, from the production point of view, livestock raising and fattening methods under natural conditions and in an environment of good treatment of the animals throughout their lives. In this case, the valuation of feeding based on grazing was higher than of the treatment of the animals, but it was not the same for feeding based on concentrates (level of indifference), which concurs, in part, with results obtained by Bernués et al. (2003) regarding a greater relative importance of feeding compared to AW. The aspects that consumers value negatively are related more with questions of safety than with the animal welfare. Segments of consumers according to their perception of meat produced by distinct methods of livestock management Through the determination of the percentage of change of recomposed conglomerate coefficients from the cluster analysis, three segments of consumers were obtained with statistically significant differences (p ≤ 0.05) in the majority of the aspects of the handling of animals, except in the perception of feeding based on feedlots (Table 3): Segment 1. Consumers sensitive to natural raising: composed of 25.5% of the consumers, who present an intermediate valuation of good treatment of animals at slaughter and of raising animals in confinement, both statistically different from the other segments. Segment 1 presents a positive valuation of good treatment of the animals in transport and at feedlots, statistically lower than Segment 3, but similar to Segment 2. This group presents the most negative valuation of the use of hormones and feeding with broiler litter, differing significantly from the other two segments. It was the only segment that valued feeding based on concentrates as bad or very bad, differing significantly from the other segments that presented a positive valuation of raising animals free range, statistically similar to Segment 3 and higher than Segment 2. Segment 2. Consumers who value intensive raising: formed by 58.6% of those surveyed, presents a positive valuation of good treatment of animals at slaughter, but statistically lower than the other segments. Its valuation of good treatment of animals during transport and at feedlots was similar to Segment 1 and significantly lower than Segment 3. This group negatively values the use of hormones and feeding with broiler litter in a manner statistically similar to Segment 3, but negatively less than Segment 1, at the same time it positively values feeding based on concentrates without statistical differences from Segment 3. Segment 2 presents the highest valuation of raising animals in confinement, significantly higher than the other two segments and the lowest valuation of raising animals free range. Segment 3. Consumers sensitive to animal welfare: composed of 15.4% of those surveyed, is characterized by a significantly higher proportion than in the other segments who place a positive value on good treatment of animals in feedlots, transport and at slaughter. Parallel to this, this segment positively values feeding based on concentrates and negatively values the use of hormones and feeding with broiler litter, without presenting statistical differences with Segment 2, but with difference from Segment 1. Segment 3 presented a greater valuation of free range raising, statistically similar to Segment 1. It was the only segment that presented a negative valuation of raising animals in confinement, differing significantly from the other segments. The variables related to demographics, meat consumption and knowledge about AW, in which significant differences were observed among the segments (obtained with cluster analysis) and the total sample are presented in Table 4. From the demographic point of view, statistical differences were obtained only in relation to the age of the groups of consumers (p ≤ 0.05), given that the segment sensitive to natural raising presented a greater proportion of persons 35 to 54 years of age, and a lower percentage of persons under 35 years of age. The segment sensitive to animal welfare was composed by a higher percentage of young persons (less than 35 years of age) and a lower percentage of persons of 55 years of age or more. This concurs with the greater sensitivity of young people on themes of AW reported by María (2006). Table 4. Demographic and consumer characteristics of groups with statistical differences among them, obtained using cluster analysis. Temuco, November, 2006. Cuadro 4. Características demográficas y de consumo de los segmentos con diferencias estadísticas entre ellos obtenidas con análisis cluster. Temuco, noviembre de 2006.
AW: animal welfare In the remaining variables studied (consumption of meat and knowledge about AW), significant differences were observed according the frequency of consuming meat, visits to livestock feedlots, if the consumer considered the practices of raising and fattening livestock have a negative effect on the animals and whether this affects his/herconsumption of meat (p ≤ 0,05), knowledge about the methods of raising and fattening, preference for meat produced with AW standards, and willingness to pay a higher price for this product (p ≤ 0.001). In relation to the frequency of consuming meat, the segment that values intensive raising of animals has a greater proportion of persons who consume meat three times per week (60.3%), while in the segment sensitive to animal welfare this percentage was less (40.7%) together with a high percentage of persons who consume meat once a week (40.7%). In relation to having visited animal feedlots, the segment sensitive to animal welfare were almost 50% of persons who had visited cattle and sheep feedlots, together with a low proportion who have not visited feedlots, a variable that was high among the segment sensitive to natural raising (37.8%). Congruently, the segment sensitive to animal welfare had a high percentage of persons who indicated knowledge about the practices of raising and fattening animals (83.1%), and among the segment sensitive to natural raising practically half indicated not having knowledge on the subject (49.0%). Among the people in the three segments who are familiar with these practices, a high proportion of consumers from the segment sensitive to animal welfare perceive a negative effect on the animals (59.2%) and the percentage of persons who are not familiar with the theme was low (4.1%), the opposite to the situation observed with the segment sensitive to natural raising of animals. Considering the persons who perceive a negative effect of livestock production practices, the segment sensitive to natural raising presented a high percentage of persons whose consumption of meat has been affected by these concerns (47.1%), while among the sector that values intensive raising the proportion of persons who consumption has not been affected was greater (38.7%). In relation to the preference to buy meat produced with AW and a willingness to pay a higher price, the segment that values intensive raising was differentiated from the other groups by a greater proportion of persons who do not prefer to buy this meat (29.8%), nor are willing to pay a higher price (34.7%). Based on the aspects studied, cattle producers, the meat packing and distribution industries are faced with three segments of consumers in the city of Temuco with different characteristics, preferences and consuming habits. Nevertheless, it is important to indicate that the majority of the consumers perceive animal welfare as a desirable condition to incorporate in meat products, an aspect which constitutes an opportunity to advance toward differentiated products and that should be adequately communicated to consumers. The most numerous segment (58.6%), which in major proportion consumes meat three times per week, does not perceive a negative effect on the animals from the practices of livestock production and has a lower percentage of consumers inclined to prefer and pay a higher price for meat produced with AW. While this group positively values AW, it is also characterized by a positive consideration of raising animals in confinement and feeding based on concentrates. The second group in numeric importance (25.5%) presents the strongest rejection of the use of hormones and feeding with broiler litter and considers feeding based on concentrates to be negative and places a high value on raising animals in free range. In this segment the proportion of persons between 35 and 54 years of age is greater, who have not visited feedlots, who are not familiar with methods of livestock raising and fattening, who do not know if these practices negatively affect the animals and of persons inclined to prefer and pay more for meat produced with AW. The minority segment (15.4%) has a positive valuation for the good treatment of the animal in the feedlot, in transport and at slaughter, a positive valuation of the use of concentrates, but a rejection of raising animals in confinement. This group has a greater proportion of persons under 35 years of age, who consume meat once a week, who have visited cattle and sheep feedlots and who know of the methods used in animal production, in a higher percentage perceive a negative effect on the animals, together with a high preference and willingness to pay a higher price for meat produced with AW. Given this, as a long-term strategy in the Chilean beef and mutton markets, consumer acceptance toward products differentiated by the treatment received by the animal, the type of feeding or system of production requires carrying out productive, educational, informational (María, 2006) and promotional efforts in order to achieve a consistent image of the product in the mind of the consumer (Bernués et al., 2003). Thus, in the area of primary production, practices accepted by consumers should be privileged and traceability should be implemented. In association with this, producers, slaughter houses and the distribution industry should inform and promote the differentiated attributes of the product by means of labels, quality certifications and the development of brands. Finally, the public sector should support this process through instruments that provide mass information about the advantages that accompany animal welfare and traceability, as well as its implementation in the productive chain. CONCLUSIONS Approximately 60% of the consumers surveyed has knowledge about the practices of raising and fattening of cattle and sheep. Among this group of consumers, half considered intensive handling to have a negative effect on the animals; however, only 32.1% had changed their beef and mutton consuming habits owing their negative perception of the handling of animals. Although less than 50% of the consumers has received information about AW, approximately 70% had a knowledge score greater than 50% on the basis of four questions related to the theme. 55.3% of the consumers surveyed perceive high or moderate levels of AW in Chile. A strong preference and willingness to pay a higher price for meat produced according to AW standards was detected, which on average would be an increase of 15.2% over the normal price in Temuco. The proportion of consumers who would be willing to pay a higher price is greater among young people. Meat consumers in general have a positive perception that during raising and fattening animals feeding is based on grazing, that animals are raised free range and that they receive good treatment in the slaughterhouse, in transport and in the feedlot. They reject the use of hormones and feeding with broiler litter, showing a certain degree of indifference in relation to raising animals in confinement and feeding based on concentrates. Through the use of cluster analysis, three segments of consumers in the city of Temuco were distinguished, with significant differences in the perception of the effects on the quality of meat of distinct systems of productive handling, age, frequency of consuming beef, having visited a feedlot, knowledge about livestock production practices and their effect on the animal and on the consumption of meat, and their preference and willingness to pay a higher price for meat produced according to AW standards. The most numerous segment (58.6%), is characterized by valuing intensive raising of fattened animals, consume meat with a higher frequency and an even lower percentage of consumers inclined to prefer and pay a higher price for meat produced under AW standard. The second segment in numeric importance (25.5%) was characterized by valuing the natural raising of animals, present a higher proportion of persons between 35 and 54 years of age and has less experience and knowledge about the methods of livestock raising. The minority segment (15.4%) characterized by greater sensitivity to the issue of animal welfare is composed in large measure by young people, with less frequency to consume meat, more experience and knowledge about livestock production practices and having a greater preference for and willingness to pay a higher price for meat produced under AW standard. ACKNOWLEDGEMENTS The results presented are from Project FIA-PI-C-2005-1-P-010, funded by the Asociación de Plantas Faenadoras AG, Universidad Austral de Chile, Universidad de La Frontera, Pontificia Universidad Católica and the Fundación para la Innovación Agraria (FIA), and DIUFRO Project Nº 120601, funded by the Universidad de La Frontera. LITERATURE CITED
Copyright 2008 - Instituto de Investigaciones Agropecuarias, INIA (Chile). | |||||||||||||||||||||||||||||||||||||||||||||||||||||||||||||||||||||||||||||||||||||||||||||||||||||||||||||||||||||||||||||||||||||||||||||||||||||||||||||||||||||||||||||||||||||||||||||||||||||||||||||||||||||||||||||||||||||||||||||||||||||||||||||||||||||||||||||||||||||||||||||||||||||||||||||||||||||||||||||||||||||||||||||||||||||||||||||||||||||||||||||||||||||||||||||||||||||||||||||||||||||||||||||||||||||||||||||||||||||||||||||||||||||||||||||||||||||||||||||||||||||||||||||||||||||||||||||||||||||||||||||||||||||||||||||||||||||||||||||||||||||||||||||||||||||||||||||||||||||||||||||||||||||||||||||||||||||||||||||||||||||||||||||||||||||||||||||||||||||||||||||||||||||||||||||||||||||||||||||||||||||||||||||||||||||||||||||||||||||||||||||||||||||||||||||||||||||||||||||||||||||||||||||||||||||||||||||||||||||||||||||||||||||||||||||||||||||||||||||||||||||||||||||||||||||||||||||||||||||||||||||||||||||||||||||||||||||||||||||||||||||||||||||||||||||||||||||||||||||||
| |||||||||