 |
| About Bioline | All Journals | Testimonials | Membership | News |
|
||||||
|
||||||
Chilean Journal of Agricultural Research (formerly Agricultura Técnica), Vol. 68, No. 2, Apr-Jun, 2008, pp. 166-174 Research Implications of the Structural Change in Dairy Products Trade on Milk Price Paid to Producers in Chile Implicancias del cambio estructural en el mercado de productos lácteos sobre el precio de leche pagado a productor en Chile Alejandra Engler [1]*, and Laura Nahuelhual [2] [1] Universidad de Talca, Facultad de Ciencias Agrarias, Casilla
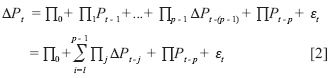
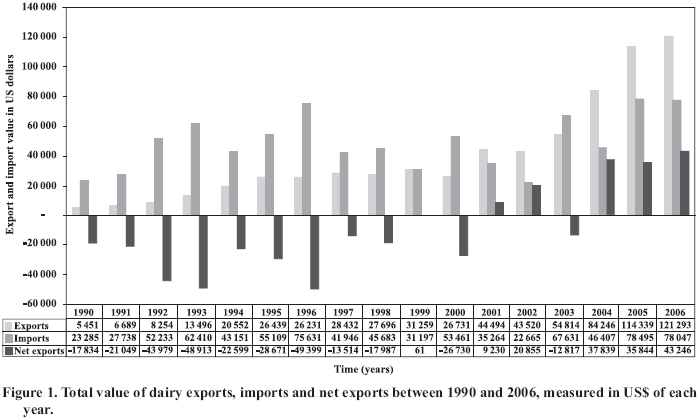
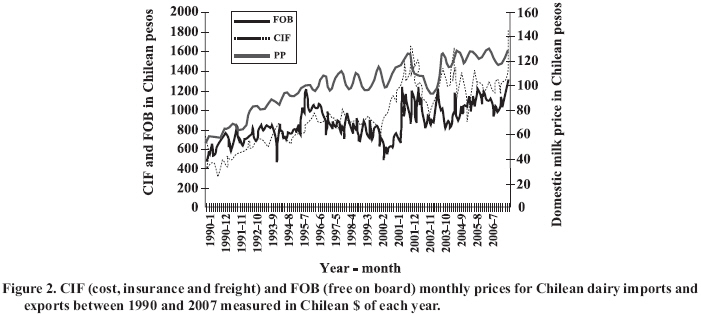
747, Talca, Chile. E-mail: mengler@utalca.cl Received: 16 August 2007. Code Number: cj08016 ABSTRACT Since 1990 row milk production has exhibited a rapid increase from 890 million liters in 1990 to 1,818 million in 2006. The excess production has allowed for the expansion of the export sector, converting Chile in a net exporter in 2001. A relevant question in this new market scenario is how this structural change can affect milk prices paid to producers in Chile. The consequences of this structural change were explored in this study using a Vector Error Correction (VEC) model and cointegration analysis. The results indicated that the domestic, CIF (Cost, Insurance, Freight) and FOB (Free On Board) prices were cointegrated, implying that changes in the import and export prices are transmitted to the domestic market affecting the milk price paid to producers. Prior to 2001, the import price (CIF) was the relevant reference dictating the movements of the domestic price. After 2001, the export price (FOB) became the reference, whereas the CIF price was no longer significant.The parameters of the VEC model suggest that the cointegrating relation between CIF and domestic prices for the first period under analysis (1990-2000) was clearer than that between FOB and domestic prices for the second period (2001-2007/3). The price elasticity for the FOB-domestic price vector had a large confidence interval, which is why it is difficult to draw strong conclusions regarding the impact of future FOB fluctuations on the milk price paid to producers in Chile after 2001. Key words: milk market, international trade, vector error correction, persistence profiles. RESUMEN Desde 1990 la producción de leche ha experimentado un rápido incremento, pasando de 890 millones de litros en 1990 a 1.818 millones de litros en 2006. El exceso de producción de leche ha permitido la expansión comercial, transformando a Chile en exportador neto a partir del año 2001. En este nuevo escenario de mercado, una pregunta relevante es cómo este cambio estructural puede afectar el precio de leche pagado a productor. En este estudio se aborda esta interrogante, utilizando un Modelo de Corrección de Error (VEC) y análisis de cointegración. Los resultados demuestran que el precio doméstico, y los precios CIF (Cost, Insurance, Freight) y FOB (Free On Board) están cointegrados, lo que implica que fluctuaciones en los precios de importación y exportación son transmitidos al mercado doméstico. Antes de 2001 el precio CIF era la referencia relevante para los movimientos del precio doméstico, mientras que a partir de 2001 el precio FOB se transformó en la referencia y CIF dejó de ser significativo. Los parámetros del modelo sugieren que la relación de cointegración entre CIF y el precio doméstico para el primer período de análisis (1990-2000) es más robusta que la relación entre FOB y el precio doméstico para el segundo período (2001-2007/3). El coeficiente de elasticidad precio para el vector FOB-precio doméstico tiene un intervalo de confianza amplio, lo cual no permite concluir de manera robusta la dirección y magnitud del efecto del precio FOB sobre el precio pagado a productor en Chile a partir del año 2001. Palabras clave: mercado de la leche, comercio internacional, vector de corrección de error, perfiles de persistencia. INTRODUCTION Until recently Chile was a net importer of dairy products. Since 1990, milk production has exhibited a rapid increase from 890 million liters in 1990 to 1818 millions in 2006 (ODEPA, 2000; 2006). New technology, higher production efficiency and economies of scale can explain this explosive increase in production levels. On the other hand, domestic consumption has not exhibited the same trend; in 1990 per capita consumption was 101 liters, whereas in 2006 it was only slightly higher, reaching 132 liters (Espinoza, 1998; ODEPA, 2007a). The excess production has allowed for the expansion of the export sector toward new markets overseas. Exports of dairy products started at the beginning of the 90’s and have increased rapidly since then (Figure 1), converting Chile into a net exporter in 2001, as recognized by public authorities and the private sector. Between 1990 and 2000, the exported volume represented 2.6% of total production, while between 2001 and 2006 this participation went up to 10.2%. On the other hand, the imported volume decreased from 6.9% to 5.6% of the total production from the first to the second period (elaborated using information from ODEPA 2007b). According to ODEPA (2007a), during the first trimester of 2007, dairy exports continued to show a significant increase, which is expected to persist due to favorable international prices of most dairy products. Chilean exports are concentrated in certain countries and products. The main importers are Latin American countries, Mexico being the most important. In the first trimester of 2007, 47% of total exports went to Mexico, while Venezuela, Guatemala, Peru and Honduras represented 24%. The main dairy products exported to these markets were cheese, whole fat milk and condensed milk, with a participation of 30.5, 30.4 and 22.7%, respectively (FEDELECHE, 2007). A relevant question in this new market scenario, where Chile has moved from net importer to net exporter of dairy products, is how this structural change can affect milk prices paid to producers in Chile and, consequently, the domestic market as a whole. The price transmission process in the food marketing system has been of considerable interest because of the implications for market efficiency. In a small country, economic theory predicts that the domestic price of a commodity is influenced by the commodity’s international price (Kongsted, 2003). This would imply that a price change in the international market is transmitted to the related domestic market. This co-movement of related price series implied by market efficiency suggests the existence of long run relationships between them. This means, in econometric terminology, that these price series should be cointegrated (Chang and Griffith, 1998), implying that when shocks to the cointegrated system occur, the prices will adjust to restore their long run equilibrium relationship (Sephton, 2003). In cases where a market is not efficient as a result of market imperfection, the price links are weak and the related price series may be found not to be cointegrated (Chang and Griffith, 1998). For the milk market in Chile, Nahuelhual and Engler (2004) showed that the domestic price of milk and the price of dairy imports (CIF) were cointegrated for the period 1995-2003. However, the influence of CIF and FOB prices on domestic milk prices after 2001 has not yet been studied. The analysis of international and domestic prices shows that although FOB and CIF prices seem to move together in a same long run trend, each price has its own cycle in the short run. In turn, the domestic price follows the cycles of both international prices. Figure 2 shows that, prior to 2000, the domestic price tends to follow the CIF price pattern, while after 2002, it appears to adjust better to FOB price fluctuations. The use of the vector error correction model (VEC) allows for the rigorous study of long run and short run price relationships simultaneously. The short run elements describe the dynamics of moving toward a new equilibrium. The long run relationships provide insights of how equilibrium relationships are restored and how new equilibrium levels can be obtained after a shock to the cointegrated system has occurred (Mohanty et al., 1996). Cointegration analysis has been used in several time series studies that attempt to identify the long run relationship among variables within a market system (Goodwin, 1992; Mohanty et al., 1996; Alavalapati et al., 1997; Chang and Griffith, 1998; Miljkovic, 1999; Mohanty et al., 1999; Aguiar and Santana, 2002; Swift, 2004). The objective of this paper was to analyze the impact on the domestic price of milk of the structural change observed in 2001, when Chile passed from being a net importer to being a net exporter of dairy products. To address this goal, cointegration and error correction techniques were used. MATERIALS AND METHODS Variable selection A traditional trade model approach was used to select the relevant variables to include in the VEC model, following Alavalapati et al. (1997). In this trade model, the domestic price within a country is influenced by import prices and the exchange rate when the country exhibits an excess demand. In turn, when there is excess supply in the domestic market, the domestic price will be influenced by export (FOB) prices and the exchange rate. The variables selected for this case study were the domestic price of milk (the price paid to producers in Chile), the price of dairy exports (FOB), and the price of dairy imports (CIF). The FOB price was calculated as the weighted average of the ratio between export values and quantities of the three main exported products, namely condensed milk, whole fat milk, and cheese. The CIF price was calculated as the weighted average of the ratio between import value and quantity of the five most relevant imported products, namely whole dry milk, non-fat dry milk, cheese, butter, and whey. The nominal exchange rate of each year was used to transform international prices from US dollars into Chilean pesos. All variables were transformed into natural logarithms for the estimation of the VEC model, which allows for interpreting vector coefficients as price elasticities. All price series corresponded to monthly data from January 1990 to March 2007, obtained from the ODEPA (2007b) and the Central Bank of Chile (2007). To asses the impact of the structural change on the domestic price of milk, the VEC model was estimated separately for two distinct periods: period 1, from 1990 to 2000, during which Chile was a net importer of dairy products, and period 2, from 2001 to March of 2007, during which Chile was a net exporter. Description of the VEC model Vector autoregressive (VAR) models, error correction models and cointegration are related concepts in time series analysis, used to characterize the relationships between the series being studied. In essence, it can be shown that, with re-parameterization, the error correction model is a standard VAR in first differences augmented by error correction terms. Moreover, according to the Granger Representation theorem, a VEC representation for a set of variables that are integrated of order one (I(1)), implies cointegration among variables and vice versa (Engel and Granger, 1987). The characterization of the finite-order underlying a VAR system of variables can be represented as follows: Pt = A0 + A1 Pt -1 +...+ Ap Pt - p + ε t [1] where Pt is a (nx1) vector containing each of the n variables included in the VAR, which in this case are the domestic, CIF and FOB prices expressed in natural logarithms; P t - 1 y P t – p are vectors of prices for periods t-1 and t-p; A0 is an (nx1) vector of intercept terms; A1 is (nxn) matrices of unknown coefficients with p equal to the lag length; and εt is an (nx1) vector of error terms. A main result of the Granger Representation Theorem is that a cointegrated system can be written as a VEC model (Johansen, 1991). Thus, the error correction representation of the VAR system in equation [1] is:
where ∆Pt is now the vector of prices in first differences. The term ПPt-p is the error correction term and contains information on the long run equilibrium relationship of the variables in Pt. The matrix П contains cointegrating relationships and has a deficient rank r, which represents the maximum number of cointegrating vectors. If cointegration holds, it implies that a long term economic relationship exists such that none of the series can wander too far away for any extended period after a shock to the system has occurred. If the rank r of the matrix П, which is the long run impact matrix, in the term ПPt-p of Equation [2] is equal to zero, a stationary linear combination among the variables in the system does not exist and the model reduces to a VAR in differences (Enders, 1995). To the contrary, if the rank of the matrix П is deficient, there will be two k × r matrices defined as α and β, such that П can be written as П = αβ’, where β is the matrix that contains the r cointegrating vectors and α is the matrix of speed of adjustment coefficients. The magnitude of the speed of adjustment indicates the velocity at which the price variables will react to a shock in the system and return to long run equilibrium. Furthermore, the significance of these parameters allows for identifying the variables responsible for the adjustment after a shock has occurred. Finally, the persistence profiles for the vectors were derived. Persistence profiles show the time it takes for the long run relationships, represented in the VEC by the error correction terms, to return to equilibrium following a system-wide shock (Pesaran and Shin, 1996; Pesaran and Pesaran, 1997), providing information on the speed of convergence of the system of variables. The faster the long run equilibrium is regained, the stronger is the integration of the market. For a detailed derivation of persistence profiles see Pesaran and Shin (1996). The cointegrating VAR was estimated on the levels of the natural logarithms of the three price series with n lags. The number of lags was determined using three selection criteria, namely the Akaike Information Criterion (AIC), the Schwarz Bayesian Criterion (SBC), and the likelihood ratio test (LRT) (Pesaran and Pesaran, 1997). Following lag selection, the cointegrating VAR was specified and estimated. The existence of cointegration was determined based on the maximal eigenvalue statistic and trace statistic. Given the existence of a cointegrating relationship, Johansen’s procedure exactly identified cointegrating vectors, and from them the VEC model was estimated. Treatment of seasonality Milk production and supply are characterized by a clear seasonal behavior, which arises mainly from deterministic factors, such as weather. In time series analysis, seasonal fluctuations are treated differently: i) they can be removed from the series by means of a seasonal adjustment procedure; ii) they can be ignored, in which case raw data are used; iii) or seasonality can be explicitly modeled (Ghysels et al., 1993; Canova and Hansen, 1995; Franses, 1996; Ghysels and Osborn, 2001). As pointed out by Franses and McAleer (1998), although the treatment of seasonality is still subject of debate, there is agreement on the belief that seasonally adjusted data would lead to inferences that are different from the results obtained using unadjusted data. In cointegrating models, the assumptions made about seasonal patterns may be relevant for both, the long run relationship among the variables, as well as the short run dynamics of the cointegrated system. In the case at hand, whereas domestic milk price exhibits a clear seasonal behaviour, CIF and FOB prices displayed almost no seasonal patterns. To verify the features of the seasonal pattern of the domestic milk price series, the Miron (1996) test was applied, which is based on a regression of a first differenced time series on seasonal dummy variables. The results of the test showed that the domestic price exhibited a large deterministic seasonal component, with seasonal dummies, accounting for 64.8% of the price variation as reflected in a R2 equal to 0.648. Based on this result, seasonality was treated as deterministic and addressed by the inclusion of a dichotomous variable equal to 1 for the period January-August and 0 otherwise. While we recognize that the rest of the behavior of the domestic price could be explained by stochastic seasonal components, addressing such components is beyond the scope of this study. RESULTS AND DISCUSSION Unit roots and lag structure of the VEC model The order of integration of the price series was tested based on the augmented Dickey-Fuller (ADF) test (Engle and Granger, 1987). The results indicated that all three price series in levels had unit roots and therefore the log-transformed series LPP (log-domestic price), LCIF (log-CIF price), and LFOB (log-FOB price) were integrated of degree one or I(1). These results are available from the authors upon request. After confirming that the price series were I(1), the next step was to determine the proper lag length for the VEC. Testing for this implies pair-wise comparisons between two standard VAR’s, each having a different lag length. As Pesaran and Pesaran (1997) pointed out, since the aim is to select an optimal order for the VAR, it is important to select a number of lags high enough such that the optimal order will not exceed it. Following this criterion, the selection processes started with a number of 12 lags. The final decision was based on the Schwarz Bayesian Criterion (SBC), Akaike Information Criterion (AIC), and the adjusted likelihood ratio test (LRT). The three selection criteria consistently indicated a number of two lags. Table 1 shows the test results using six lags. Table 1. Results from Akaike Information Criterion (AIC), Schwarz Bayesian Criterion (SBC) and Maximum Likelihood Ratio Test (LRT) to determine the optimal lag number in the autoregressive vector (VAR) and error correction vector (VEC) models of domestic and international dairy prices. Tabla 1. Resultados de los tests de Akaike (AIC), Bayesiano de Schwarz (SBC) y máxima verosimilitud (LRT), para la determinación del número óptimo de rezagos en el modelo vector de autoregresión (VAR) y de corrección de error (VEC) de los precios domésticos e internacionales de leche.
Long run dynamics The VEC model was estimated based on the Johansen procedure, which identifies the number of cointegrating relations. The results, based on the maximal eigenvalue and trace statistics, showed the existence of two cointegrating vectors in the first period and one cointegrating vector in the second period. To facilitate the comparison of the long run dynamics between the two periods under study, the model was restricted to only one vector in both periods. The results of the Johansen test are available from the authors upon request. Equations [3] and [4] show the restricted cointegrating vectors for periods 1 and 2, respectively; standard deviations are indicated below the coefficients. For period 1, the coefficient on the log-transformed FOB price was not significant and therefore it was restricted to 0. This result implies that prior to 2001 the relevant reference for the domestic price was clearly the price of imports as found by Nahuelhual and Engler (2004). The coefficient of LCIF was equal to 0.71 implying that a 10% change in CIF prices will cause a 7.1% change in the same direction in domestic prices, which suggests an inelastic response. For period 2, the cointegrating vector was restricted by setting the coefficient on LCIF equal to 0 as the variable was not significant. After the restriction was imposed, the coefficient on LFOB became significant at 10%. This result has two implications. First, after 2001 import prices (CIF) are no longer the reference for domestic price, and export price (FOB) becomes the one that dictates the movements of domestic price; and second, the domestic price becomes more responsive to fluctuations in the international market as indicated by an elasticity coefficient equal to 1.47. However, it is important to note that this parameter has a large confidence interval at 10% probability [0.27; 2.67]. This implies that it is more difficult to predict how export price fluctuations will be transmitted to the domestic price of milk. Short run dynamics and speed of adjustment coefficients The magnitude and timing of the adjustment of the domestic price is analyzed through the speed of adjustment coefficient and persistence profiles. During period 1, the speed of adjustment coefficient on the export price (-0.005) was not significant, indicating that LFOB does not respond to disequilibriums in the LCIF-LPP vector. Only LCIF and LPP variables respond to bring the system back to equilibrium after an exogenous shock occurs, as indicated by the significance of their speed of adjustment coefficients. The magnitude of the parameters indicates a fast adjustment to disequilibrium by the two variables, being faster in the case of the CIF price (0.36) (Table 2). Table 2. Vector error correction (VEC) equations of domestic and international dairy prices, without an intercept or linear trend (period 1: 1990 to 2000). Tabla 2. Ecuaciones del modelo de corrección de error (VEC) de precios domésticos e internacionales de leche, sin intercepto o tendencia lineal (período 1: 1990 a 2000).
*Significant at 5% probability. Ce indicates the cointegrating vector of each equation; LFOB: natural logarithm of FOB (free on board) price; LCIF: natural logarithm of CIF (cost, insurance, freight) price; LPP: natural logarithm of domestic price; S: dummy variable for seasonality equal to 1 from January to August. In period 2, the speed of adjustment coefficients is significant only for export and domestic prices (Table 3), as only these two variables conform the cointegrating vector after 2001. This result implies that only LFOB and LPP will react to bring the system back to equilibrium. The coefficient in the domestic price equation is much smaller (0.03, as compared to 0.14) indicating that after 2001 domestic prices adjust more slowly to disequilibrium. The lagged coefficients in each equation indicate the variables that react to bring the system to a new equilibrium in each period. In period 1, the coefficient on LFOB is significant in the equation of export price, as expected. The same is true for the coefficient on LCIF in the import price equation. In the equation of domestic price, the lagged coefficient on LCIF (-0.07) was found to be significant. This corroborates that domestic price responds to movements in import price during period 1, but not to movements in the export price as indicated by a statistically non-significant coefficient (-0.02). During the second period the results were also consistent. In the domestic price equation, only the coefficient on LFOB was significant (-0.03), while the LCIF coefficient was statistically non-significant (-0.02) (Table 3). Table 3. Vector error correction (VEC) equations of domestic and international dairy prices, without an intercept or lineal trend (period 2: 2001 to March 2007). Tabla 3. Ecuaciones del modelo de corrección de error (VEC) de precios domésticos e internacionales de leche, sin intercepto o tendencia lineal (período 2: 2001 a marzo 2007).
*Significant at 5%
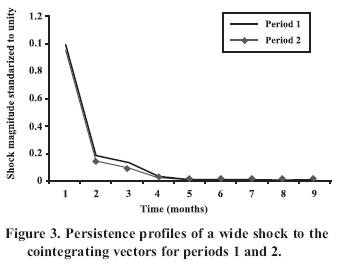
probability. Persistence profiles The persistence profile measures the time needed for the cointegrating vector to return to equilibrium after a shock to the system occurs. The main advantage of persistence profiles analysis compared to impulse response functions, for example, is that the unit of analysis is a shock to the system (a shock to the cointegrating vector) instead of a shock to a specific variable. The persistence profiles for the two periods had in common that effects of shocks were rapidly reduced with almost all of the adjustment (80%) occurring within the first month, which indicates strong market integration (Figure 3). In other words, when there is a system-wide shock that affects the long run equilibrium between the price series, most of the adjustment will occur within the first month. The main implication of this result is that the structural change in international trade, and consequently the price reference from CIF to FOB price, did not change the pattern of adjustment of the total system. This in turn implies that, as expected, the structural change that occurred in 2001 only affects the dynamics of domestic price. After a shock, both profiles converge to their asymptotic values (zero) within four months. As pointed out by Pesaran and Pesaran (1997), the value of the profile must converge to zero as the time horizon tends to infinity if the identified vectors are indeed cointegrating vectors. CONCLUSIONS The results indicated that domestic CIF and FOB prices were cointegrated, implying that a price change in the international market is transmitted to the related domestic market. This co-movement of related price series ensures that when shocks to the cointegrated system occur, prices will adjust to restore their long run equilibrium relationship. However, due to the structural change in the market, the results indicated that there has been a change in the reference for the domestic milk price. Prior to 2001, CIF was clearly the relevant price, dictating the movements of domestic price. After that year, CIF was no longer relevant and FOB became the reference affecting the movements of domestic price. However, it is important to mention that the cointegration relation between CIF and domestic price for the first period under analysis (1990-2000) was clearer than the relation between FOB and domestic price for the second period (2001-2007/3). Price elasticity for the FOB-PP vector had a large confidence interval, which is why it was difficult to make strong conclusions regarding the impact of future FOB fluctuations on the domestic milk market. Despite the price reference, the results indicated that exogenous demand or supply shocks affecting the system are absorbed quickly in both periods, suggesting strong market integration. The persistence profiles in both periods show that the effects of these shocks are quickly reduced with 80% of the adjustment occurring within the first month, which suggests that the change in the structure of international trade and price reference after 2001 did not change the pattern of adjustment of the total system. ACKNOWLEDGEMENT The authors wish to thank Fondo de Fomento al Desarrollo Científico y Tecnológico, FONDEF (Grant DO3i-1151) for its financial and technical assistance to this research work. LITERATURE CITED
Copyright 2008 - Instituto de Investigaciones Agropecuarias, INIA (Chile). The following images related to this document are available:Photo images[cj08016f1.jpg] [cj08016f3.jpg] [cj08016f2.jpg] | ||||||||||||||||||||||||||||||||||||||||||||||||||||||||||||||||||||||||||||||||||||||||||||||||||||||||||||||||||||||||||||||||
| |||||||||

