 |
| About Bioline | All Journals | Testimonials | Membership | News |
|
||||||
|
||||||
Chilean Journal of Agricultural Research (formerly Agricultura Técnica), Vol. 68, No. 3, Jul-Sept, 2008, pp. 264-273 Availability Of Nitrogen, Phosphorus And Potassium From Poultry Litter And Conventional Fertilizers In A Volcanic Soil Cultivated With Silage Corn Disponibilidad de nitrógeno, fósforo y potasio de cama de broiler y fertilizantes convencionales en un suelo volcánico cultivado con maíz. Juan Hirzel[1]* and Ingrid Walter[2] [1]Instituto de Investigaciones Agropecuarias,
Centro Regional de Investigación Quilamapu, Av. Vicente Méndez 515, Chillán,
Chile. E-mail: jhirzel@inia.cl
*Corresponding author Received: 21 September 2007. Code Number: cj08026 ABSTRACT Poultry litter (PL) is an organic matter source used as soil amendment. Besides its important nutrient content, it is a cheap alternative to conventional fertilizers in crop production.The efficient use of PL also helps reduce the environmental problems normally associated with its disposal near poultry production farms. This article reports the relative effects of PL and conventional fertilizers on the availability of soil N, P and K, dry matter (DM) production and total nutrient content in silage corn (Zea mays L.). The field experiment was carried out in a soil derived from volcanic ash (Tipic Melanoxerands) of Central South Chile.Corn was grown for three seasons (2002-2005) and PL and conventional fertilizers were applied in the first two years.The residual effect of the added fertilizer sources was evaluated in the third year.DM production in the fertilized treatments was similar and fluctuated between 30.6 and 37.1 Mg ha-1 for the two years of fertilization, and between 18.9 and 20.4 Mg ha-1 for the year without addition of nutrients. The plant nutrient concentrations were similar between fertilized treatments, except for the second year, in which N and P concentrations were higher with PL. During the third year (without fertilization), N decreased in the whole plant. Soil nutrient availability was similar between fertilization sources for the three years evaluated, the higher concentration being presented in the first two years (with fertilization). These results suggest that PL is an alternative fertilizer source to conventional fertilizers. Key words: poultry litter, soil fertility, corn, nitrogen, phosphorus, potassium. RESUMEN La cama de broiler (PL) es un compuesto orgánico utilizado como enmienda de suelos, cuyo contenido de nutrientes y bajo precio permiten considerarla como una alternativa al uso de fertilizantes. El uso de PL como fertilizante permite disminuir el riesgo de contaminación ambiental en las zonas de acopio. En este trabajo se compara el efecto en producción de materia seca (MS) y concentración de nutrientes en maíz (Zea mays L.) para ensilaje, y disponibilidad de N, P y K en un suelo volcánico (Tepic Melanoxerands) de la zona centro sur de Chile, obtenido con PL, fertilizantes convencionales y un control sin fertilización. El cultivo fue realizado durante tres temporadas consecutivas; en las dos primeras se fertilizó y la tercera temporada permitió conocer el efecto residual de la fertilización. aplicada. La producción de MS fue similar entre los tratamientos con fertilización, y fluctuó entre 30,6 y 37,1 Mg ha-1 para los años con fertilización, y entre 18,9 y 20,4 Mg ha-1 para el año posterior (sin fertilización). La concentración de nutrientes fue similar entre tratamientos fertilizados, excepto para el segundo año, en el cual el N y P fueron mayores con PL. El tercer año, la ausencia de fertilización redujo la concentración de N en los tejidos. En el suelo, la disponibilidad de nutrientes fue similar con ambas fuentes de fertilización, aunque las mayores concentraciones se obtuvieron durante los años en que se aplicaron fertilizantes. Los resultados obtenidos sugieren que PL es una fuente de fertilización alternativa al uso de fertilizantes convencionales. Palabras clave: cama de broiler, fertilidad de suelos, maíz, nitrógeno, fósforo, potasio. INTRODUCTION The poultry industry in Chile has grown at a rate of 2.9% per year in the last decade. Some 193.4 million birds were produced in 2004, with a meat production of 535002 t (INE, 2004); it is estimated that 218542 to 290100 t of poultry litter (PL) is produced per year, considering the generation of 1.13 to 1.5 kg birds-1 yr-1 (Gascho et al., 2001). Currently the growth rate of poultry litter is nearly 15% a year (Poultry Producing Association, unpublished information). PL requires careful management and disposal since it can adversely affect the environment through gas emissions, runoff, and nutrient leaching (Sharpe et al., 2004; Mitchell and Tu, 2006; Tewolde et al., 2007), as well as threatening human health and wildlife due to pathogens (Preusch et al., 2002; Sharpe et al., 2004). A safe and environmentally friendly way of disposing of PL is to use it as a source of nutrients in agricultural production. PL is approximately equivalent to a 3-3-2 grade (N-P2O5-K2O) fertilizer (Mitchell and Tu, 2006) and has been used for the production of corn and cotton (Gossypium hirsutum L.) (Hirzel et al., 2004; Tewolde et al., 2007; Hirzel et al., 2007). Addition of PL to cultivated land helps recycle nutrients and reduce fertilizer costs in crop production systems. Moreover, the soil nutrient availability derived from PL application is not well known. In addition, application of PL or others organic wastes may also generate a positive residual effect that should be taken into account when planning the next crop (Eghball et al., 2004; Hirzel et al., 2007). The residual N effect obtained with organic residues is mainly because some N is adsorbed or incorporated into the clay and organic soil fraction (Jensen et al., 2000) and is immobilized by soil microbial biomass (Jensen et al., 2000; Sainz et al., 2004). Sørensen and Amato (2002) found that the residual N effect associated with the application of pig slurry to a barley (Hordeum vulgare L.) and ryegrass (Lolium perenne L.) crop rotation were about 2 to 4% and 1 to 3% of the N applied as manure in the second and third year, respectively. The aim of the present study was to determine soil availability of N, P and K derived from PL and conventional fertilizer applications, and its relation to corn dry matter yield and total nutrient concentration in corn during three years of study. MATERIALS AND METHODS This experiment was conducted at the Santa Rosa Experimental Farm, of the Agricultural Research Institute, Regional Centre Quilamapu, Chillán (36°36’ S, 71°54’ W), Chile. The soil at the site was a silty loam 0.6 m deep, Arrayán series, corresponding to a Typic Melanoxerands (USDA, 1994). The climate of the area is Mediterranean, with lower temperatures and high rainfall during winter and high temperatures and low rainfall in summer, which under irrigation conditions contributes toincreased N availability for corn crops.The field trial area had been cultivated with spring wheat and oat (Avena sativa L.) in the previous four years. The initial physical and chemical properties of the soil and the chemical composition of PL (samples collected over the experimental period) are shown in Table 1. Table 1. Initial physical and chemical properties of the soil and characteristic of the poultry litter (PL) data in dry matter used in the experiment. Chillán, Chile. 2002.
During 2002-2004, silage corn was cultivated in a field trial established in a randomized complete block design with three treatments and four replicates. The experimental plots measured 5 x 3.5 m, which allowed five rows of corn spaced at 0.70 m. The plots were orientated from East to West, and the soil had 5% of slope. Three treatments were applied (Table 2) in 2002 and 2003. Treatment 1 (T1) was the control without fertilizer; Treatment 2 (T2) involved application of urea, triple super phosphate and potassium chloride at a rate of 400, 300, and 280 kg ha-1 of N, P2O5, and K2O, respectively, which were adjusted to the nutrient content of Treatment 3; and Treatment 3, which was PL used at a rate of 20 Mg PL ha-1. In Treatment 2, urea was applied by hand, 50% one day before sowing and 50% at the six-leaf stage (between 44 to 48 d after sowing each year). Phosphorous and potassium fertilizers were applied once, one day before sowing. >PL was broadcasted by hand one day before sowing. PL was obtained at a poultry farm near the experimental area and the litter bed material was wood shaving. No fertilizer was applied in 2004. All plots were managed to optimize crop growth according to standard management for corn silage in central Chile (Table 3) Table 2. Nutrients applied in the different treatments in the first two seasons (2002 and 2003).
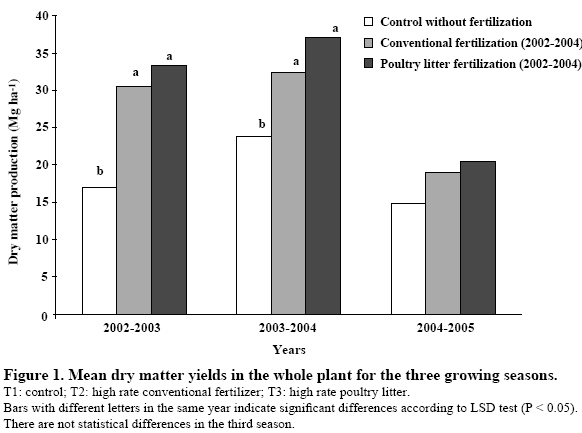
T1: control; T2: high rate conventional fertilizer; T3: high rate poultry litter. Table 3. Crop management information in the three seasons.
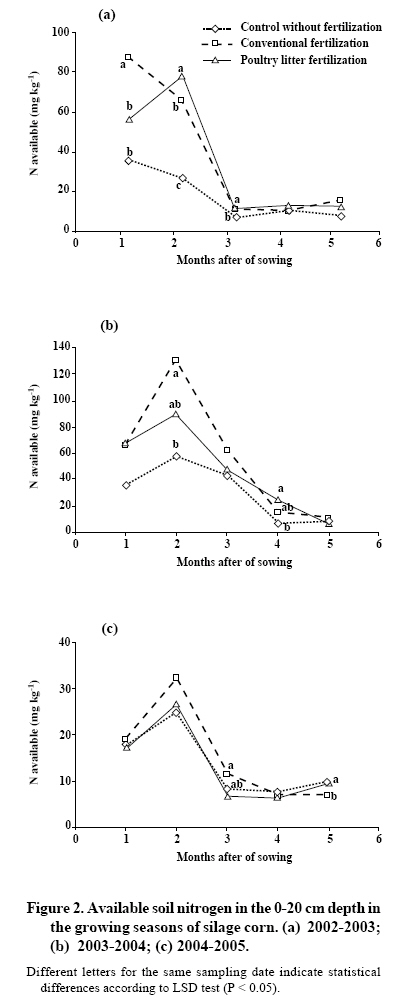
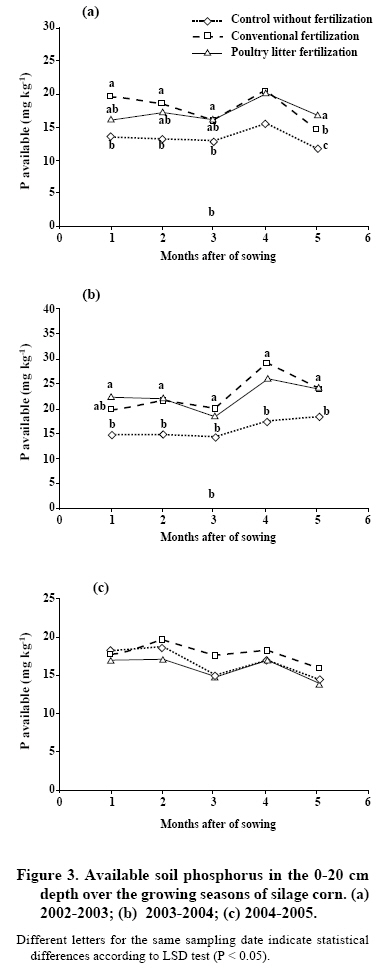
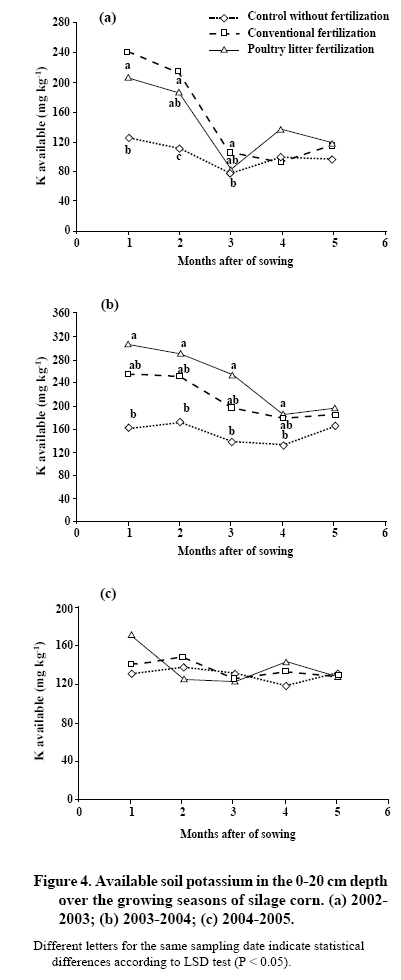
PL: poultry litter The trial site was ploughed in early spring each year before fertilizer application. The soil was prepared with conventional tilling equipment to obtain an acceptable seedbed. Seeds were sown at a rate of 99000 to 110000 plants ha-1 according to the variety used, disinfected with chlorpirifos in dosage of 0.75 g 100 kg-1 seed. Weeds were controlled before sowing with two herbicides (atrazine and acetochlor in dosages of 2 L ha-1) and later were hand controlled. Since early spring rainfall distribution differed between the two years, varieties of different precocity were used (data not showed). At sowing, five polyvinyl chloride (PVC) tubes 20 cm long and 5 cm wide were completely inserted in the center of each treatment plot, between seeded rows (Raison et al., 1987; Eghball, 2000; He et al., 2000). The PVC tubes were collected each 30 d after seeding (Eghball, 2000). The soil was mixed thoroughly in a bucket, air-dried and sieved through a 2 mm mesh before analysis. Soil pH was measured in water (1:2.5 soil/water ratio) (Sadzawka et al., 2006). Available soil P was determined by extracting 2.5 g of soil with 50 mL of 0.5 M NaHCO3 for 30 min, according to the method of Olsen et al. (1954). Available K was determined using 1 M NH4OAc extraction followed by atomic absorption-emission spectrophotometer, as described by Sadzawka et al. (2006). Inorganic N (NO3-N + NH4-N) was extracted using 2 M KCl and determined colorimetrically using a segmented flow autoanalyzer spectrophotometer (Skalar, Sanplus, Breda, The Netherlands). Corn was harvested at silage maturity (30-35% dry matter DM) (Plénet and Lemaire, 2000; Millner et al., 2005). Ten contiguous plants in the central row were cut 10 cm above soil surface, weighed in situ with a portable balance and ground with a mechanical shredder (Craftsman, USA). Plant N was determined by the macro-Kjeldahl procedure (Sadzawka et al., 2001). The P and K concentrations were determined by ashing 2 g sub-sample in a ceramic crucible at 500 °C for 7 h, dissolving the ash in 10 mL of boiling 2 M HCl for 5-10 min, and filtering through Whatman No.5 paper (Sadzawka et al., 2001). The P and K concentrations were measured in the extract by colorimetric method and by atomic emission spectroscopy (Sadzawka et al., 2001). Collected data were analyzed by ANOVA and the least significant difference (LSD) test (P = 0.05) was applied to determine statistical differences between nutrient treatments using the SAS software general model procedure (SASInstitute, 1989). RESULTS AND DISCUSSION Crop dry matter production The highest DM production was obtained during the first two years,those with fertilizer applications, and DM fluctuated between 30.6 and 37.1 Mg ha-1 (Figure 1), similar to the values reported by Hirzel et al. (2004). During this period, DM of fertilized treatments was significantly higher than that of the control treatment. Thedifferences observed between control and fertilized treatments were smaller in the second year, which could be due to the different variety of corn sown in the second year (Heckmanet al., 2003) and to the shorter vegetative period of the crop (Table 3). In the third year, average DM production in the fertilized treatments decreasedby 13.6 Mg ha-1, from 33.3 to 19.7 Mg ha-1 (Figure 1). At the same time, DM production in the control treatment decreased by 5.6 Mg ha-1, from 20.5 to 14.9 Mg ha-1, indicating a limited nutrient supply associated with a lack of fertilization that year and/or a low turnover of soil organic matter. There was no residual effect from the application of fertilizer sources on DM production (Figure 1). Availability of soil nitrogen, phosphorous and potassium Nutrient availability was studied in the first 20 cm of soil, because the greatest changes in concentrations due to changes in fertilization are produced at this depth (Eghball, 2000). Nutrient concentration at deeper layers was similar between evaluated treatments (Hirzel, 2007). Nitrogen Similar dynamics in available N were observed in fertilized treatments during the growing seasons of the first two years (Figure 2). The first year there was higher N availability during the first two months in treatments with fertilization. At the same time, there were some differences between treatments with fertilization, indicating higher N availability in the first month with the conventional fertilization. In contrast, in the second month higher N availability was obtained with PL. These result partly coincide with those published by Dean et al. (2000) and differ from those reported by He et al. (2000). In this experiment, higher soil N concentration was found in the first two months, which differs from the longer period of availability indicated by Dean et al. (2000) for a raspberry (Rubus idaeus L.) crop fertilized with PL. The initial high N availability may be associated with a high concentration of uric acids in PL (Gordillo and Cabrera, 1997). In the first year, the available N fraction in the PL treatment, in comparison to the control, was 12 and 30% of the total N applied, for the first and second month of evaluation, respectively (Figure 2a). In contrast for the same year, the available N fraction was 30 and 40% of the N added as urea during the first and second month, respectively. The lower N availability obtained initially with PL may be associated with greater N immobilization by the active soil microbial biomass growing in the soluble carbon added to the soil through PL (Ma et al., 1999). In the second season, there was a higher availability of N in the first two months (Figure 2b). Moreover, N concentrations during the first three months of evaluation were higher in the second year, and fluctuated between 50 and 130 mg kg-1 in the urea and PL treatments with fertilization, which is similar to what was indicated by Eghball (2000). The available N fraction for the PL treatment was 18 and 20% higher compared to the control for the first and second month of the second year, respectively. For the conventional fertilization treatment, this fraction was 18 and 42% compared to the control for the first and second month of evaluation, respectively. Comparatively, organic N mineralization in the PL treatment was more controlled over time than conventional fertilization, which is an additional advantage to using it as fertilization source, because it allows for decreasing the risk of N-NO3- lixiviation. In the PL treatment, N availability for the first month of evaluation was statistically similar to the mineral fertilization, compared to first evaluation year, suggesting that in the second year there was a residual N supply, which could come from the stable N fraction in the PL applied in the first year. In the third year, the evolution of available soil N was similar between the treatments (Figure 2c), with higher N availability in the first two months. In general, N concentration in the third year was lower than in the first two years of evaluation, because no fertilization was applied the last year. These results are similar to those indicated by Cooperband et al. (2002) and Binder et al. (2002). Phosphorus During the first two years of evaluation with fertilization a similar behavior was observed between treatments with fertilization (T2 and T3), presenting a higher concentration than the control (Figure 3). In the first year, P concentration fluctuated between 15 and 20 mg kg-1 in the treatments with fertilization (Figure 3a). The average relative P availability compared to the control was 28.9 and 32.4% higher in the PL and conventional fertilization, respectively, for all the evaluation period. This results were lower that those indicated by Eghball and Power (1999) and Mitchell and Tu (2006). Available P at the end of the incubation period in the fertilized treatments was slightly higher than in the control without fertilization, in contrast to what was indicated by Cooperband et al. (2002) for a similar investigation in a silty loam soil. This effect responds to the high P fixation capacity of the soil used (Beck et al., 1998; Barreal et al., 2001; Haynes and Mokolobate, 2001; Staats et al., 2004). In the second year, P concentration fluctuated between 18 and 29 mg kg-1 in treatments with fertilization (Figure 3b).Average relative P availability, in comparison to the control, was 40.7 and 42.3% higher in the PL and conventional fertilization, respectively, for all the evaluation period. In general, relative P availability in the second year was slightly higher than in the first year. In the third year (without fertilization), P concentration was lower than in the previous years (with fertilization) and fluctuated between 14 and 20 mg kg-1 in fertilized treatments (Figure 3c). Moreover, P concentration in the control was similar to the other treatments, suggesting that there was no residual effect of P fertilization, which responds to the high soil P fixation capacity (Barreal et al., 2001; Beck et al., 1998; Haynes and Mokolobate, 2001; Staats et al., 2004). Potassium During the first two years, a similar behavior was observed between fertilized treatments (T2 and T3) (Figure 4). In the first year there was a higher K availability in treatments with fertilization during the first two months of evaluation, but only the conventional fertilization application generated a K concentration statistically higher than the control (Figure 4a). In the fourth and fifth months of evaluation there was no difference between treatments, which could reflect a movement of K from the surface horizon to a deeper horizon, as was indicated by Morton et al. (2004) for allophanic soils in New Zealand. K concentration fluctuated between 82 and 240 mg kg-1 in the treatments with fertilization. Average relative K availability for the conventional fertilization and PL treatment was higher by 50.5 and 43.7%, respectively, compared to the control. These values were lower than those reported by Mitchell and Tu (2006) in a similar experiment in a silty loam soil with cotton. In the second year, the highest K availability was obtained in the PL treatment for the whole period of evaluation, and was statistically higher than that of the control (Figure 4b). In general and similar to first year, a higher K availability was observed during the first months after application of fertilization treatments, with decreasing content over time, probably due to K movement in depth, an effect previously discussed. K concentration in treatments with fertilization fluctuated between 179 and 308 mg kg-1, higher than in the first year (Figure 4a). Average relative K availability, in comparison to the control, was higher by 37.3 and 59.9% for the conventional fertilization and PL treatment, respectively. In contrast to the results obtained in the first year, higher relative K availability in the PL treatment was observed. In the third year, K concentration was generally lower than in the first two years (with fertilization) and there were no statistical differences between treatments (Figure 4c). Nutrient concentration in the whole plant A higher N concentration was obtained in fertilized treatments the first year, the same as was indicated by Eghball et al. (2004) and Chantigny et al. (2004), and fluctuated between 9.78 and 9.85 g kg-1 (Table 4), which was consistent with results obtained in soil (Figure 2a). In general, P concentration was not different between the treatments, which coincides with some authors (Mazzarino et al., 1997; Cuevas and Walter, 2004) and fluctuated between 1.79 and 2.23 g kg-1 for fertilized treatments. This effect did not coincide with soil available P (Figure 3a and 3b) and could be due to the higher DM production obtained in the fertilized treatments, which generated a dilution of P uptake and successively a P concentration similar to control. At the same time, the plants presence stimulates an increment in the activity of enzymes specifically for P present in organic compounds (Ibrickci et al., 1994), which could explain the P concentration obtained in the control. The K contents presented higher values in the fertilized treatments, and fluctuated between 9.65 and 10.98 g kg-1. N concentration was lower the second year (Table 4), probably because a different corn variety was used (Heckman et al., 2003). Highest N concentration in plant and DM production in PL treatment could have generated a dilution of soil N concentration. This effect can decrease the differences in soil N concentration between treatments (Figure 2b). At the same time, the highest P concentration was obtained in the PL treatment. Moreover, this effect was not observed in the soil (Figure 3b). For K concentration there were no differences between treatments, probably associated with higher DM production in treatments with fertilization that generated a dilution of K in the plant. Table 4. Nutrient concentration (g kg-1)in the whole plant during the evaluation period.
T1:
control; T2: high rate of conventional fertilization; T3: high rate of poultry
litter. There were no differences in the third year in nutrient concentrations between treatments, which coincides with the low residual effect observed in soil ( Figures 2c, 3c and 4c). CONCLUSIONS The results obtained indicated that PL used as a fertilization source in corn crops generates similar levels of nutrient availability in the soil, DM production, and total nutrient concentrations in plant, without affecting residual concentrations of soil nutrients, so it is an alternative to conventional fertilizers as a nutritional source for crops. LITERATURE CITED
Copyright 2008 - Instituto de Investigaciones Agropecuarias, INIA (Chile). The following images related to this document are available:Photo images[cj08026f1.jpg] [cj08026f2.jpg] [cj08026f3.jpg] [cj08026f4.jpg] | ||||||||||||||||||||||||||||||||||||||||||||||||||||||||||||||||||||||||||||||||||||||||||||||||||||||||||||||||||||||||||||||||||||||||||||||||||||||||||||||||||||||||||||||||||||||||||||||||||||||||||||||||||||||||||||||||||||||||||||||||||
| |||||||||
