 |
| About Bioline | All Journals | Testimonials | Membership | News |
|
||||||
|
||||||
Chilean Journal of Agricultural Research (formerly Agricultura Técnica), Vol. 68, No. 4, Oct-Dec, 2008, pp. 352-359 Research Prediction of the chemical composition and fermentation parameters of pasture silage by near infrared reflectance spectroscopy (NIRS) Predicción de la composición química y parámetros fermentativos de ensilajes de pradera mediante espectroscopía de reflectancia en el infrarrojo cercano (NIRS). Lorena Ibáñez S.M. [1]*, and Daniel Alomar[2] [1]Instituto de Investigaciones Agropecuarias, Centro Regional de Investigación Quilamapu, Vicente Mendez 515, Casilla 426, Chillán, Chile. E-mail: libanez@inia.cl *Corresponding author. [2]Universidad Austral de Chile, Facultad de Ciencias Agrarias, Instituto de Producción Animal, Casilla 567, Valdivia, Chile. E-mail: dalomar@uach.cl. Received:
23 October 2007. Code Number: cj08037 ABSTRACT The capability of near infrared reflectance spectroscopy (NIRS) was evaluated to predict the content of total ash (TA), crude protein (CP), crude fiber (CF), neutral detergent fiber (NDF), acid detergent fiber (ADF) and metabolizable energy (ME); as well as pH and ammonia nitrogen content (N-NH3), in pasture silage, with and without additives. Nine hundred and twenty dried and ground samples of pasture silage, with known chemical composition, were scanned over the visible and NIR region (400 to 2500 nm) at 2 nm intervals. Calibration equations were developed by modified partial least square regression models (MPLS) with different mathematical treatments and light scatter correction as standard normal variation and Detrend (SNV & D) of the spectra. For each parameter, the optimum calibration was evaluated on the basis of the cross validation determination coefficient (1-VR) and standard error of cross validation (SECV). NIRS showed a high predictive ability, with 1-VR > 0.89 and SECV (%) of 5.14, 6.69, 9.96, 16.01 and 9.15 for A, CP, CF, NDF and ADF, respectively. NIRS showed moderate accuracy for ME, with 1-VR > 0.87, SECV: 0.07Mcal kg-1 and low accuracy, although with feasibility as a ranking method, for pH and N-NH3, with 1-VR > 0.72 and SECV of 0.14 and 1.49, respectively. It is concluded that the equations obtained can be used to predict the nutritional composition of pasture silages. Key words: nutritional composition, silage, pasture, spectroscopy, NIRS. RESUMEN Se evaluó la capacidad de la (NIRS) para predecir la composición química: en ensilajes de pradera con y sin aditivos. Se tomaron espectros (400 a 2500 nm, cada 2 nm) de muestras secas y molidas (n = 920) de ensilajes de pradera con composición química conocida. Se desarrollaron calibraciones evaluando diferentes tratamientos matemáticos del espectro y corrección de dispersión de luz como la variación normal estándar y Detrend (SNV & D) y se ajustaron ecuaciones de predicción mediante regresión de cuadrados mínimos parciales modificados (MPLS). Las mejores ecuaciones se seleccionaron considerando el coeficiente de determinación (1-VR) y el error estándar (SECV), obtenidos en una validación cruzada. NIRS mostró alta capacidad predictiva con 1-VR > 0,89 y SECV (%) de 5,14; 6,69; 9,96; 16,01 y 9,15 para, respectivamente. La confiabilidad fue razonable para EM, con 1-VR > 0,87 y SECV de 0,07 Mcal kg-1; y poco confiable, pero con posibilidad de uso en clasificación por rangos, para pH y N-NH3, con 1-VR > 0,72 y SECV de 0,14 y 1,49%, respectivamente. Se concluyó que las ecuaciones obtenidas pueden ser usadas para predecir la composición nutricional de ensilajes de pradera. Palabras clave: composición nutricional, ensilaje, pradera, espectroscopía, NIRS. INTRODUCTION One of the keys to improve the profitability of milk production in the temperate rainy areas of southern Chile is the production of high quality silage, since about 30% of the pasture output is preserved as silage (Anrique et al., 1999). The nutritional quality of silages can be determined through traditional laboratory chemical and/or biological techniques. In general, these techniques require instrumentation, are costly and time-consuming, and can cause contamination (Deaville and Flinn, 2000). However, there is an alternative technique, near infrared-reflectance spectroscopy (NIRS), which has been developed in recent decades and is a valuable analytical tool, since it is multi-analytical, non-destructive, rapid, non-contaminating, and highly precise. However require appropriate reference laboratory (“wet chemistry”) techniques to develop suitable calibration equations (Deaville and Flinn, 2000; Osborne, 2000). The NIR region is the wavelength range between 700 and 2500 nm in the electromagnetic spectrum (Norris, 1989; Deaville and Flinn, 2000). When a sample is scanned, radiant energy is absorbed selectively according to the frequency of the specific vibrations of the molecules present in the sample, resulting in a spectrum which is unique for that sample. All of the organic bonds (i.e., C-H, N-H and O-H) have absorption bands in the NIR region, while minerals can only be detected in organic compounds Consequently, NIRS can detect the bonds of fractions of proteins, fats and carbohydrates in forage. Optical data stored as NIRS spectra together with chemical or reference data are modeled by regression analysis to provide equations which are then used to predict relevant variables, as nutritional fractions, in a given samples (Park et al., 2005). As NIRS is a secondary technique, several studies have provided results with NIRS calibrations to predict both nutritional components and fermentative parameters in silage (Peldoza, 1999; Park et al., 2005). In work previously done at the Universidad Austral of Chile equations have been obtained on the nutritional quality of silage from the south of Chile (Peldoza, 1999). However, the use of additives in the silage process constitutes a variable that has not been considered as a relevant factor in predictive quality. The use of additives in the preparation of silages is aimed to improving forage fermentation and conservation. Among the most commonly used additives are organic acidificants, mainly formic acid, which is used to reduce the pH of the herbage mass. It also has anti-bacterial properties that restrict the activity of different microorganisms, including lactic acid bacteria, resulting in greater availability of residual soluble carbohydrates as a source of energy for the rumen ecosystem (Elizalde et al., 1996). Other kinds of additives are of biological type, as the inoculants containing the homo-fermentative lactic acid bacteria, or mixtures of these with enzymes that hydrolyze polysaccharides to increase the availability of fermentable substrate. The objective of the present study was to develop and evaluate the application of NIRS in predicting the nutritional composition of pasture silage, with and without additives, from the temperate-rainy region of southern Chile, with the aim of verifying the predictive potential of the technique. MATERIALS AND METHODS Samples Samples of pasture silage (n ≤ 920), mainly derived from perennial ryegrass (Lolium perenne L.), were obtained from farms located in the temperate rainy region of southern Chile (39°05’ to 41°30’ lat. S), in the period 2004 to 2006. Of the total number of silage samples analyzed, 464 were without additives and 456 were with different types of additives. Of the samples with additives, 246 can be identified as follows: 12 samples contained formic acid; 36 samples had Biomax 5®: Lactobacillus plantarum with PA-28 and K-270 strains (Chr. Hansen Biosystems, Milwaukee, Wisconsin, USA); 88 samples contained and 110 samples presented Sil All®: L. plantarum, Pediococcus acidilactici, Enterococcus faecium, L. salivarius, cellulase, hemicellulase, amylase and pentosanase (Alltech, Nicholasville, Kentucky, USA). Reference analysis The fresh samples were analyzed in duplicate at the Animal Nutrition Laboratory of the Universidad Austral de Chile, Valdivia. Dry matter content was determined by drying at 60°C for 48 h in a forced-air oven. Dried samples were ground through a 1 mm screen in a Wiley grinder laboratory mill (Arthur H. Thomas Co., Philadelphia , Pennsylvania, USA) and stored in polyethylene bags until the collection of their spectra and analysis with the reference technique. Total dry matter (DM) was determined by eliminating residual moisture in an oven at 105 ºC for 12 h. Total ash (TA) was obtained by calcination in an oven at 550-600 ºC for 5 h (Bateman, 1970; AOAC, 1996). The crude protein (CP) content, calculated as the content of nitrogen N × 6.25, was determined by the Kjeldahl method, adding selenium as a catalyst (Bateman, 1970). The Weende method was used to determine crude fiber (CF) (AOAC, 1996). Neutral detergent fiber (NDF) and acid detergent fiber (ADF) were determined according to the procedure of Van Soest and the AOAC (Van Soest, 1991; AOAC, 1996). Metabolizable energy (ME) was obtained from the equation: ME (Mcal kg-1) = 1.279 + 0.0325 D, where the value D is the content of digestible organic material (%) in the DM, determined in vitro (Tilley and Terry, 1963). The pH value was obtained by potentiometric measurement (pH meter) of the extract (Playne and McDonald, 1996). Ammoniacal N (N-NH3) was calculated with a titrimetric determination prior to Kjeldahl distillation (AOAC, 1996). All the parameters were expressed on a DM basis. Not all the samples (n=920), were analyzed for all the reference fractions, since only chemical values requested by each farmer were determined. NIR spectra collection Silver Spring, Maryland, USA) with a spinning module, placing the sample in a circular cell of anodized aluminium with a quartz window 35 mm in diameter and 10 mm deep. A personal computer with WINISI 1.04 software (Infrasoft International, 1992) was used to manage the equipment, process the optical data and develop the calibrations. The spectrum of each sample was obtained by average of 16 successive readings, exposing the samples to electromagnetic radiation in the visible-NIR range, between 400 and 2500 nm, at intervals of 2 nm, resulting in a spectrum of 1050 data points for each sample. All spectra were stored as the reciprocal reflectance logarithm [log10 (1/R)]. Calibrations The calibration equations were obtained by modified partial least square (MPLS) regression (Hruschka, 2001). To avoid over-fitting, limit the number of terms and select the best equations, a cross validation was used, dividing the calibration set into four groups. In this process, the standard error of cross validation (SECV) (uncertainty estimator) and the proportion of observed variance, 1-VR (certainty estimator) were determinated (Infrasoft International, 1992; Shenk and Westerhaus, 1994). Evaluations were made with or without pre-treatment of spectral data, combining the standard normal variance (SNV) and Detrend (SNV & D), which are algorithms that reduce the effect of the particle size and improve the accuracy of the calibration (Infrasoft International, 1992; Deaville and Flinn, 2000). Mathematic treatments described by four digits were tested (e.g., 2, 4, 4, 1), where the first digit indicates the subtraction order or pseudo-derivative, the second number is the gap or subtraction interval, and the third and fourth digits indicate a first and second smoothing segment (Osborne, 2000). These treatments were applied with the objective of extracting relevant spectral information and reducing the quantity of data by means of subtracting smoothed segments of the spectra. A protocol was defined for the detection and elimination of outliers or aberrant samples both in their spectral character (H), and with regard to the magnitude of the deviation between the value predicted by NIRS and the reference value (T). The critical values for H and T outliers were set at 10 and 2.5, respectively. The best calibration equations were selected by the lower SECV value, the higher 1-VR value, and the best relation between the standard deviation of the reference data of the calibration set and the SECV, known as the ratio performance deviation (RPD). According to Williams (2001), RPD values of less than 2.4 are equations with low reliability for predictive purposes. With RPD ratios of between 2.4 and 3.0, the predictive quality increases and the equation can be applied with the aim of approximation or classification in ranges. When the RPD is higher than 3.0, the quality of the equation is acceptable for prediction. RESULTS AND DISCUSSION Chemical composition of the samples The number of samples, average, range and standard deviation for the chemical components is presented in Table 1. The wide range of chemical composition observed in the samples represents the typical range of pasture silage for the Los Lagos and Los Ríos regions of southern Chile, in accordance to the CP (12-20%) and ME values (2.35 Mcal kg1) indicated by Elizalde et al. (1995). A wide variation in the composition among the samples of the calibration set is a desirable condition to develop robust predictive equations, as they represent better the product to be predicted later, in routine analysis (Murray, 1988). Table 1. Chemical composition of pasture silage samples used as reference values to perform near infrared reflectance spectroscopy (NIRS) calibrations (dry matter basis).
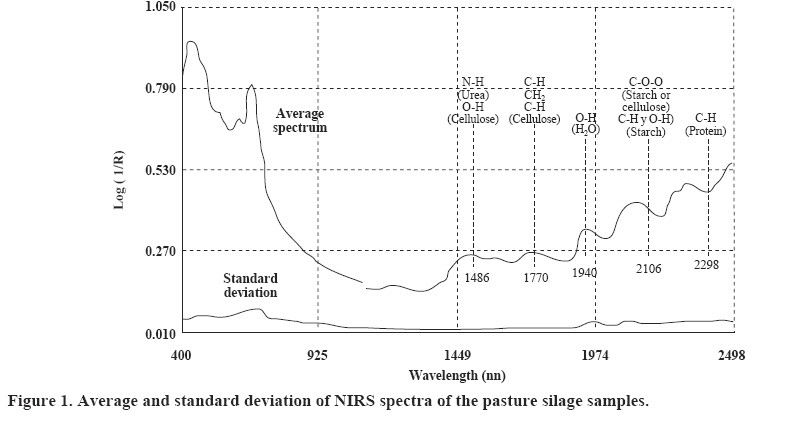
TA: total ash; CP: crude protein; CF: crude fiber; NDF: neutral detergent fiber; ADF: acid detergent fiber; ME: metabolizable energy; N-NH3: ammoniacal nitrogen. NIRS spectra of the samples The average spectrum of the 920 silage samples in the visible and near infrared range is presented in Figure 1. In multiple absorption bands of C-H, O-H and N-H bonds are observed on the NIR region, but the most important combinations of absorption bands related to C-H bonds occur between 2000 and 2500 nm, while the combinations of H-O absorption bands, associated with the water content of the sample, are observed between 1940 and 2080 nm. Meanwhile, the absorption bands of C-H bonds, related to lipids and fatty acids, are located between 1730 and 1750 nm. Finally, there are absorptions bands corresponding to C-H bonds and their combinations between 2100 and 2400 nm (Osborne, 2000). The best equations (Table 2) were selected according to the 1-VR, SECV and RPD statistics, from a total of 48 calibrations developed for each fraction. All the selected equations resulted from calibrations including scatter correction (SNV & D) and a second derivative of the spectra. Table 2. Mathematical treatments and statistical indicators of the best calibrations developed for the fractions predicted.
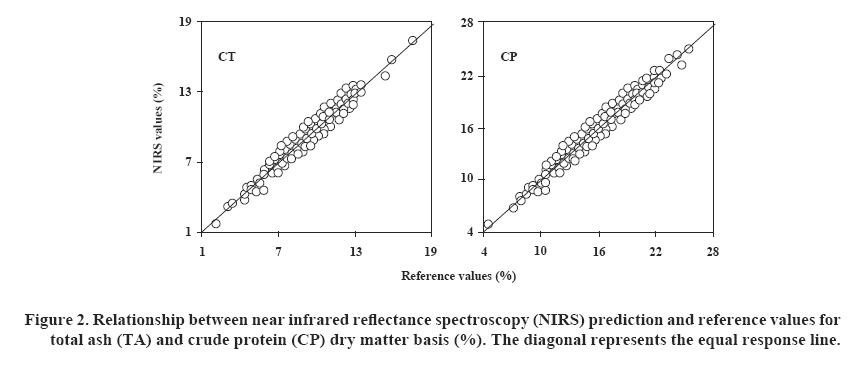
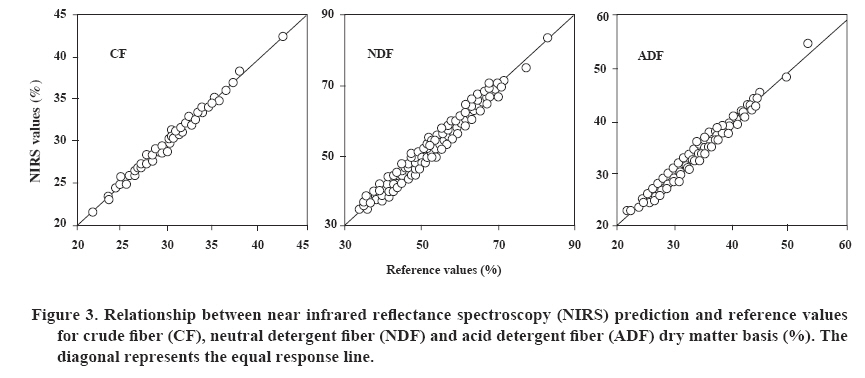
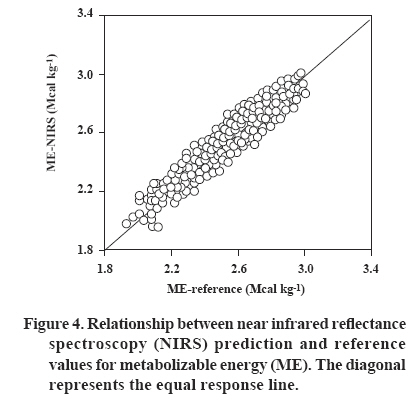
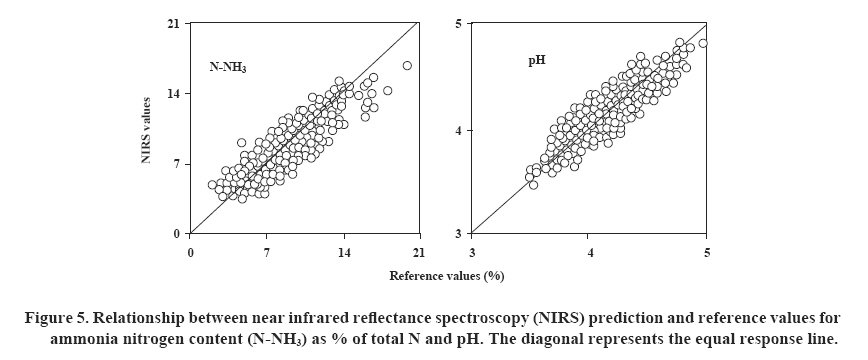
TA: total ash; CP: crude protein; CF: crude fiber; NDF: neutral detergent fiber; ADF: acid detergent fiber; ME: metabolizable energy; N-NH3: ammoniacal nitrogen; NIRS: near infrared reflectance spectroscopy; MT: mathematic treatment; R2: calibration determination coefficient; SCE: standard calibration error; 1-VR: cross validation determination coefficient; SECV: standard error of cross validation; RPD: ratio performance deviation. The results obtained from the NIRS models were variable in their predictive quality, according to the fraction involved. Models were obtained with a high predictive value for TA, CP, CF, NDF and ADF, with values of 1-VR > 0.89. This concurs with values of RPD > 3. The high predictive quality of these models can be explained in part by the manner of obtaining the chemical data, given that the reference data were obtained by gravimetric and chemical analysis, techniques that present low variability (high precision) in comparison to other techniques that include biological elements. Among the models obtained, is worth mentioning the high predictive value of the TA equation, which was unexpected given that it corresponds to inorganic and mineral substances that do not have absorption in the near infrared region; although these compounds can be associated with organic structures through oxides, chelates or other compounds, which can allow for their indirect estimation using NIRS (Shenk and Westerhaus, 1994; Cozzolino et al., 2003). The TA and CP parameters had a high determination coefficient (R2 > 0.93) reflecting the strong relationship between NIR absorption bands and the reference data (Figure 2). The values of the TA equation are slightly higher (Table 2) than those of Peldoza (1999) and Žnidaršič et al. (2006), who obtained models with RPD values equal to 2.42 and 2.9, respectively. The NIRS calibrations for CP showed results higher than those obtained by Castro (2002), with SECV = 0.89 and slightly lower than those obtained by Villamarín et al. (2002), with RPD = 5.0. It could be expected that in complex fractions, such as CF, NDF or ADF, NIRS would have a low predictive power given that these are empirical entities that represent complex structures of the cellular wall, while the spectral data obtained by NIRS responds with exactitude to the real chemical groups of the sample (Alomar and Fuchslocher, 1998; Cozzolino et al., 2003). The strong relationship in this study between the data predicted by NIRS and the reference data is notable, which considerably raises the predictive quality of the equations for fiber, in the case of fiber obtained by detergent techniques (NDF and ADF), with RPD > 4.46 and 1-VR > 0.96, the reliability is made more robust by the large number of samples used in calibration and validation. In the case of the equations for CF and NDF, the RPD values obtained were slightly lower than those obtained by Villamarín et al. (2002) with values of 4.5 and 4.6, respectively. On the other hand, the equation for ADF, presented an RPD value greater than that registered by De la Roza and Martínez (2000) and Villamarín et al. (2002), who respectively obtained 3.7 and 3.4. When plotting NIRS against reference values for fiber fractions (Figure 3), it can be seen that samples, although different in numbers, are concentrated close to the equal response line, which suggests that the spectra respond accurately to changes in chemical composition for these fractions, consequently allowing the development of good predictive models. The resulting calibrations for ME showed a moderate predictive quality, with 1-VR = 0.87 and RPD < 3, which can be explained by the fact that the ME values tend to be more variable and less precise, given that in vitro digestion value can be affected by several factors, such as the dilution of ruminal liquor, microbial concentration, conditions and time for collection of ruminal liquor, the type of buffer used, the particle size of the sample, the milling system and the type of diet that the donating ruminant receives (Murray, 1988; Stern et al., 1997; Deaville and Flinn, 2000). Besides, eventual changes in the pH of the ruminal liquor, could affect cellulolytic bacteria that are more sensitive to low pH than amylolytic species. Hence, when there is a reduction in pH, there is less digestion of fiber and consequently a lower ME value is predicted (Murray, 1988; Stern et al., 1997). Therefore, as the reference technique used for ME is in turn a prediction based on a regression model relating in vitro with in vivo digestibility of organic matter, all the errors of this method are added to errors of the NIRS technique. Consequently, it is not surprising that calibrations for EM resulted poorer in comparison to other fractions. Despite of the above, the ME values predicted by NIRS have a strong relation with the reference values (R2 = 0.89) as shown in the concentration of samples around the equal response line, when plotting NIRS vs. reference values (Figure 4). The decision to use NIRS predictions in practice should take into consideration, on one hand, the level of uncertainty (error) that the technical advisor or the farmer are prepared to accept, and, on the other hand, the possibility of having a result in a considerable shorter time than that required by the reference technique. Finally, NIRS models obtained showed low or poor predictive quality for the pH and N-NH3, parameters with 1-VR > 0.72 and RPD < 2 (Figure 5). The preceding is confirmed by the lower correlations among the reference values of pH and N-NH3 and their respective spectrum (R2 > 0.73), which can be attributed, at least in part, to the fact that both chemical analyses were made with fresh samples, while the spectra were obtained on dry samples. In the determination of pH by NIRS, there is an association with the OH groups of the sample, mainly in correspondence to the moisture content (Cozzolino et al., 2003). Consequently, in spite of the poor equations obtained, NIRS succeeds in rescuing a chemical signal of what was present in the fresh sample in relation to these fractions. This can be observed graphically as a greater dispersion of the values around the equal response line, especially at higher values. Nevertheless, calibrations for these fractions, although not reliable for predictions, could be of value as an approach for ranking or classifying purposes. CONCLUSIONS The reliability of the NIRS predictions obtained for pasture silage, with and without additives, is considered high for TA, CP, CF, NDF and ADF content; reasonable for ME and poor for pH and N-NH3. The best equations were obtained with mathematic treatments that included a subtraction (derivative) of second order and correction of light scatter (SNV & D). The high number and variability of the samples used in this work provided robust equations that can be used to predict the nutritional composition of pasture silage, with and without additives. LITERATURE CITED
Copyright 2008 - Instituto de Investigaciones Agropecuarias, INIA (Chile). The following images related to this document are available:Photo images[cj08037t2.jpg] [cj08037f5.jpg] [cj08037f1.jpg] [cj08037f4.jpg] [cj08037f3.jpg] [cj08037f2.jpg] [cj08037t1.jpg] | ||||||||||||||||||||||||||||||||||||||||||||||||||||||||||||||||||||||||||||||||||||||||||||||||||||||||||||||||||||||||||||||||
| |||||||||
