 |
| About Bioline | All Journals | Testimonials | Membership | News |
|
||||||
|
||||||
Chilean Journal of Agricultural Research (formerly Agricultura Técnica), Vol. 69, No. 1, Jan-Mar, 2009, pp. 3-11 RESEARCH Evaluación del Consumo de Agua de un Cultivo de Tomate en Invernadero Usando el Método de Priestley-Taylor Evaluation of Water Requirements for a Greenhouse Tomato Crop Using the Priestley-Taylor Method Héctor Valdés-Gómez1, 2*, Samuel Ortega-Farías2, and Mauricio Argote2 1 Universidad de Talca, Facultad de Ingeniería, Escuela de Ingeniería en
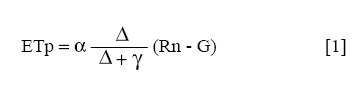
Bioinformática, Casilla 747, Talca, Chile. Received: 20 August 2007. Code Number: cj09001 ABSTRACT The Priestley-Taylor (PT) model was evaluated for estimating the real evapotranspiration (ETreal) of a drip-irrigated greenhouse tomato (Lycopersicon esculentum Mill.) crop. The net radiation incorporated in the PT model was estimated using meteorological variables. For this experiment, an automatic weather station (AWS) was installed inside the greenhouse to measure solar radiation (Rgi), net radiation (Rn), air temperature (Ta) and relative humidity (RH). Another AWS was installed over a grass cover to measure atmospheric conditions outside the greenhouse. The experiment was carried out at the Panguilemo experimental station (35°23' S, 71°40' W, 110 m.a.s.l.) from August to December 2000. The PT model was evaluated using the ETreal obtained from the water balance (WB) method. In this case, values of ETreal by PT model were calculated using: a) Rgi and soil heat flux (G) = 0; b) Rgi and G ≠ 0; c) solar radiation measured outside the greenhouse (Rge) and G = 0; and d) Rge and G ≠ 0. For these cases, results indicated that PT model was able to compute ETreal with errors less than 5%. Also, Rn was calculated with a relative absolute error and a mean deviation lower than 6% and 0.07 mm d-1, respectively, using Rgi or Rge. Daily soil heat flux values equal to zero did not affect the calculation of ETreal values. Thus, the PT model evaluated in this study could be used for scheduling irrigation for a greenhouse tomato crop, using internal measurements of air temperature and relative humidity, and external measurements of solar radiation. In this case, PT model predicted the ETreal with an error of 6.1%. Key words: irrigation, Lycopersicon esculentum, model, crop coefficients, net radiation, soil heat flux. RESUMEN Se evaluó el comportamiento del modelo de Priestley-Taylor (PT) para la estimación de la evapotranspiración real (ETreal) de un cultivo de tomates (Lycopersicon esculentum Mill.) en condiciones de invernadero. La radiación neta incorporada en el modelo de PT fue calculada usando variables meteorológicas clásicas. Para este experimento, una estación meteorológica automática (AWS) fue instalada dentro del invernadero para medir radiación solar (Rgi), radiación neta (Rn), temperatura del aire (Ta) y humedad relativa (RH). Una segunda AWS fue establecida sobre una cubierta herbácea para medir las condiciones atmosféricas al exterior del invernadero. El experimento se condujo en la Estación Experimental Panguilemo (35°23’ S, 71°40’ O, 110 m.s.n.m.) durante los meses de agosto a diciembre del 2000. Las estimaciones de ETreal obtenidas por el modelo PT fueron comparadas con los valores calculados por el método del balance hídrico (WB). En este estudio los valores de ETreal obtenidos por PT fueron calculados usando: a) Rgi y flujo de calor del suelo (G) = 0; b) Rgi y G ≠ 0; c) radiación solar medida al exterior del invernadero (Rge) y G = 0; y d) Rge y G ≠ 0. Para estos casos los resultados indicaron que el modelo de PT fue capaz de estimar la ETreal del tomate con errores menores que un 5%. Asimismo, la Rn fue calculada con un error absoluto relativo y una desviación media de no más del 6% y 0,07 mm d-1, respectivamente, ya sea utilizando Rgi o Rge. La utilización de un valor igual a cero para valores diarios de flujo de calor del suelo no afectó el cálculo de los valores de ETreal. Así, el modelo de PT evaluado en esta investigación podría ser usado para programar el riego de un cultivo de tomates bajo invernadero usando mediciones internas de temperatura y humedad relativa, y mediciones externas de radiación solar. En este caso, el modelo de PT predijo la ETreal con un error de un 6,1%. Palabras clave: riego, modelo, Lycopersicon esculentum, coeficientes de cultivo, radiación neta, calor del suelo. INTRODUCTION A correct determination of irrigation scheduling (irrigation timing and frequency) is one of the main factors in achieving high yields and avoiding loss of quality in greenhouse tomato (Yuan et al., 2001). To do this, it is fundamental to know the crop water requirements or real evapotranspiration (ETreal), which depends on specific interactions among soil, tomato crop and atmospheric conditions. For greenhouses, ETreal have been estimated by measuring water evaporation with a Piche evaporimeter or modified evaporation pan (Kirda et al., 1988, Yuan et al., 2001). Also, the Penman-Monteith and Priestley-Taylor (PT) models, which have solid physical principles, could be used to estimate the tomato water requirements for greenhouses (Zhang and Lemeur, 1992; Ortega-Farías et al., 2004b). These models require as input atmospheric condition measurements inside the greenhouse. The main limitations of Penman-Monteith model to compute tomato evapotranspiration is that it requires the parameterization of surface canopy resistance (rc) and aerodynamic resistance (ra), which are difficult to measure or estimate in greenhouse conditions. On the other hand, the PT model avoids this problem by integrating ra and rcv in a constant factor (α) within the formula. In this regard, Vuscovich (2001) indicated that PT model simulated ETreal for a greenhouse tomato crop with a root mean square error and relative root mean squared error less than 1 mm d-1 and 18%, respectively. THEORETICAL FRAMEWORK Priestley and Taylor Method (PT). Priestley and Taylor (1972) proposed that potential evapotranspiration (ETp, mm d-1) of different types of vegetation can be estimated as:
where α is an empirical coefficient, Δ is the slope of the saturation vapor pressure curve (kPa °C-1), Δ is the psychrometric constant (kPa °C-1), γ is the net radiation (mm d-1), G is the soil heat flux (mm d-1). The value of α depends on vegetation type and could be related to sensible heat flux of the surface (Pereira and Villa Nova, 1992), and vapor pressure deficit (Vuscovich, 2001). Considering that the PT equation predicts the potential evapotranspiration rate (ETp), and consequently does not consider the crop development stage, the real evapotranspiration rate (ETreal) of the greenhouse tomato crop should be calculated according to Equation [1] multiplied by a crop coefficient (Kc) (Allen et al., 1998). The Kc is an empirical coefficient that integrates the non-linear interaction among soil, crop and climatic conditions. Net radiation and soil heat flux. Equation [1] requires Rn and G as input parameters, which are expensive to measure inside the greenhouse. To solve this problem, daily values of Rn could be calculated using the following expression (Antonioletti et al., 1999): Rn = [(1 - ζ )Rgi + εa σTa4 - εcvσTcv4] FC-1 [2] where Rn is expressed in mm d-1, Rgi is the incoming shortwave solar radiation inside the greenhouse (MJ m-2 d-1), x is surface albedo, ea is atmospheric emissivity,ecv is the crop emissivity, Ta is the air temperature (ºK), Tcv is the canopy temperature (°K), s is the Stefan-Boltzman constant (4.903 10-9 MJ K-4 m-2 d-1) and FC is a conversion factor (2.45 MJ m-2 d-1 mm-1). The atmospheric emissivity can be estimated using the following equation (Idso, 1981): εa = 0.179 (ew )1/7 exp (350/Ta) [3] where ew is the vapor pressure (kPa). In general G is negligible in the daily calculation of reference or ETreal because G is small on daily basis (Allen et al., 1998; Ortega-Farías et al. 2004b). Thus, Stanghellini (1987) and Vuscovich (2001) suggested a G value equals to zero to compute ETreal for a greenhouse tomato using the Penman-Monteith and PT models, respectively. Since there not enough information in Chile about the modeling of greenhouse tomato evapotranspiration, the objective of this research was to evaluate the Priestley-Taylor method for estimating real evapotranspiration for greenhouse tomato. Table 2. Statistical comparison between observed and simulated daily values of net radiation (Rn) using solar radiation measured inside (Rgi) or outside (Rge) tomato greenhouse. A sensitivity analysis was included by varying temperature gradient between air (Ta) and canopy (Tcv) temperatures.
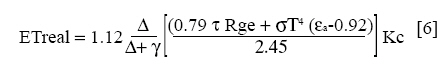
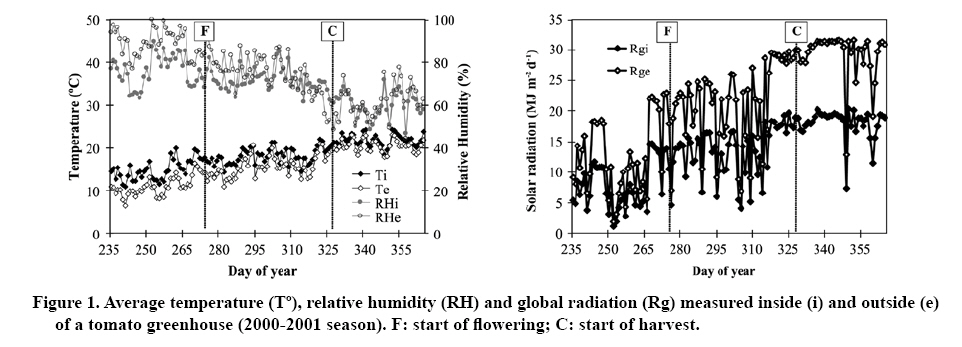
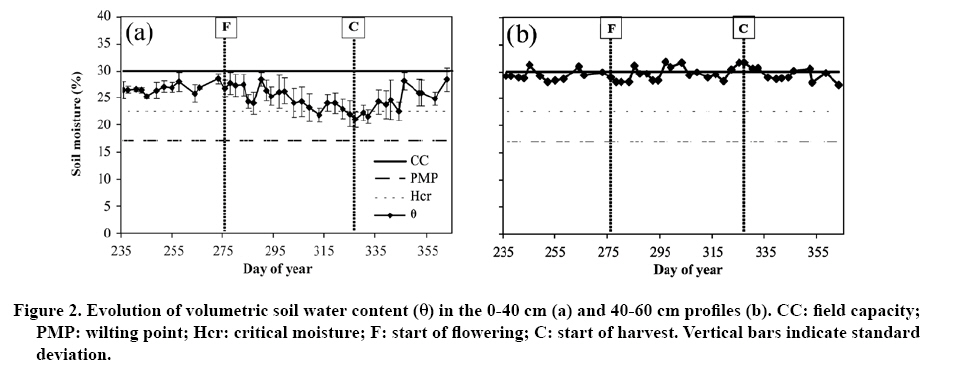
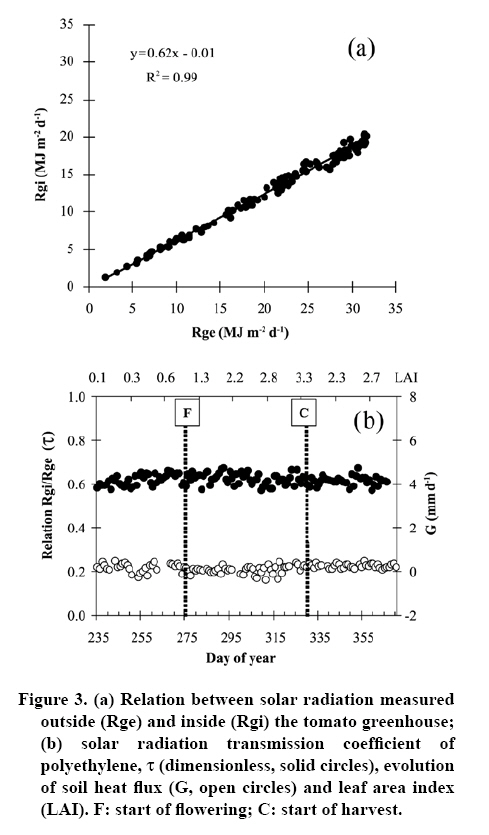
MD: mean deviation; RMSE: root mean square error; ARE: absolute relative error; R2, β and a are the determination coefficient, the slope and the intercept of the lineal regression, respectively. T: true hypothesis (β = 1, a = 0); F: false hypothesis (β¹ 1, a ¹ 0). MATERIALS AND METHODS The experiment was carried out in a greenhouse located at the Universidad de Talca Panguilemo Experimental Station (35°23’ S, 71°40’ W, 110 m.a.s.l.) from August to December, 2000. For this study, a detailed description of the type of greenhouse structure, soil and crop management was presented by Ortega-Farias et al. (2003). The four replicates (7.2 m2 each), corresponding to 100% of ETreal were used in the present study. The climatic conditions inside and outside the greenhouse for the study period are presented in Figure 1. The tomato plants (cv. Presto) distributed in single rows were conducted vertically following a V system, where one plant was guided to the left and the other to the right along the row, resulting in two rows per crop table. The values of the leaf area index (LAI) were estimated with the STICS model (Brisson et al., 2003), which was calibrated for greenhouse tomato. Irrigation was carried out using two irrigation tapes (T-Tape, TSX 310) separated by 30 cm on the crop table, discharging a volume of 5 L h-1 m-1. Irrigation tapes were placed 15 cm to the left and right of the tomato rows allowing the homogeneous watering of the greater part of the crop table. Soil water content (q) was measured every 3 to 5 d using the reflectometry technique (TDR, Trase System, Soil Moisture Equipment Corp, Santa Barbara, California, USA) (Figure 2a). These measurements were taken just before irrigation to check if soil water content was above the management allowed depletion (MAD). Four pairs of stainless steel rods were installed in the soil to measure θ from the tomato transplanting to 50% of harvest. In this case, the maximum soil water extraction (or critical soil moisture, Hcr) was 23%, which was calculated using a MAD value of 50%. An automatic weather station (AWS) was installed in the central part of the greenhouse, to measure net radiation (Rn), soil temperature (Ts), air temperature (Ta), relative humidity (RH) and solar radiation (Rgi). The height of the Rn sensor (Campbell Sci., REBS-Q7, Logan, Utah, USA) was moved from 0.5 m above the soil surface at the beginning of the season up to 2 m above the soil when tomato crop reached a maximum height of 1.70 m. In this case the sensor was maintained at 0.3 m above the crop throughout growing season, which ensured that most of the Rn measurements came from the tomato canopy (Domingo et al., 2000). To measure the soil heat flux two thermocouple probes (Campbell Sci., TCAV, Logan, Utah, USA) located at 0.02 and 0.06 m below the soil, were used, together with two soil heat flux plates (Campbell Sci., HFT3-L, Logan, Utah, USA) placed 0.08 m below the soil surface. The temperature and relative humidity sensors (Campbell Sci., HMP 35C, Logan, Utah, USA) were installed at a height of 1.2 m, while the solar radiation sensor (Adcon Telemetry, A730, Klosterneuburg, Austria) was located at a height of 2 m. A second AWS, similar to that used in the greenhouse, was installed above a grass cover to measure atmospheric conditions outside the greenhouse. The temperature, relative humidity and solar radiation sensors were placed at heights of 2 m. Due to the high cost of solar radiation sensors, it was proposed to estimate solar radiationinside the greenhouse as follow: Rgi = τ Rge [4] where τ is the coefficient of solar radiation transmission of the plastic (dimensionless) and Rge is solar radiation measured outside the greenhouse. Rge and Rgi are in MJ m-2 d-1. The following assumptions were considered to compute net radiation: i) Tcv = Ta, since Tcv is difficult to obtain from a simple and low cost sensor (Antonioletti et al., 1999); ii) εcv = 0.92. This value is the result of the weighting of the three main components of the crop system that emit longwave radiation on the surface, such as the tomato crop (e = 0.95, Pieters and Deltour, 1997), the plastic mulch (ε = 0.53, Zhu et al., 1998) and the bare soil of the inter-rows (ε = 0.95); iv) ζ = 0.21. Thus, the Rn model becomes: Rn = (0.79 τ Rge + σT4 (εa - 0.92)) FC-1 To corroborate that the use of a single net radiation sensor located over a replicate was sufficient to represent the net radiation of all replicates, leaf temperature measurements were made at noon with a porometer (Delta-T Devices Ltd., modelo AP4, Cambridge, UK) at different phenological stages of the crop (data not shown). These measurements showed that leaf temperature did not differ among replicates (no more than 1 ºC), which would indicate that plant water status, sensible heat emission, and energy balance were very similar in the replicates. The following assumptions were considered to compute ETreal: i) G = 0 since G is very small on daily basis; ii) α = 1.12. The selection of this value was based on the studies of Pereira and Villa Nova (1992); iii) Kc values were selected from Castilla and Fereres (1990) (Table 1). Replacing Equation [5] in [1] and incorporating all the assumptions described above, daily values of ETreal can be calculated as follows:
Table 1. Crop coefficients (Kc) of greenhouse tomato crop.
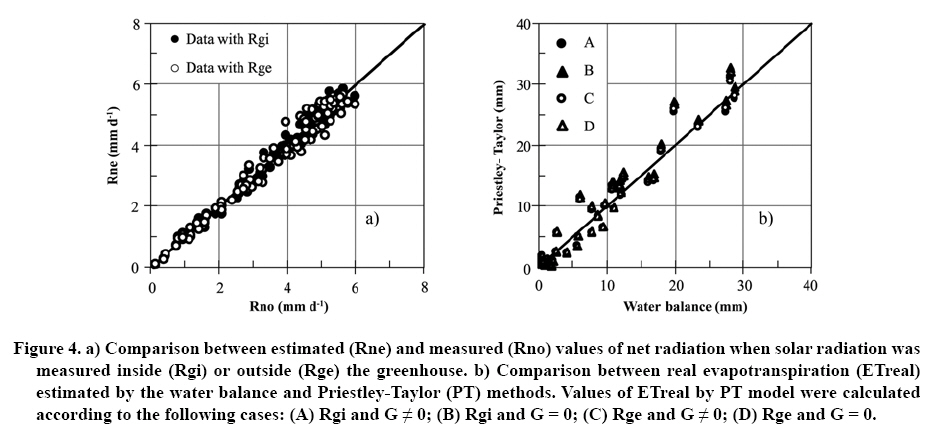
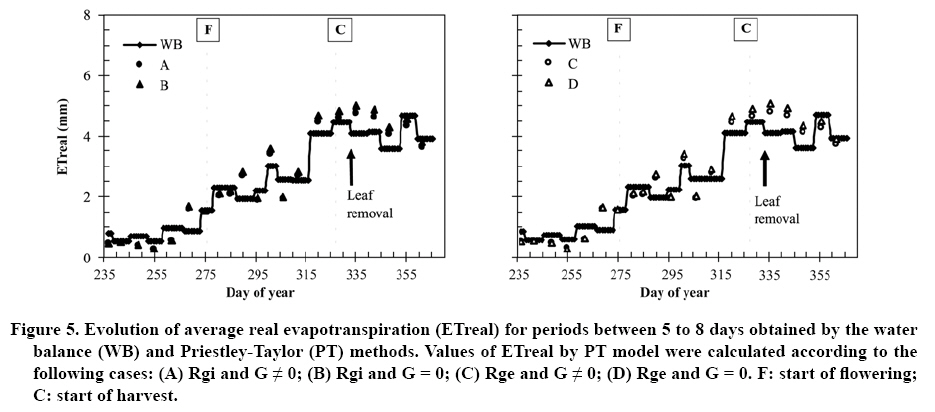
1 Values proposed by Castilla and Fereres (1990). Using Equation [6] it is possible to compute the tomato water requirements using only Ta and RH measured inside the greenhouse. Also, external measurements of solar radiation are required to simulate Rn. ETreal values obtained from the water balance (WB) method were used to validate the ETreal estimated by PT model. The WB method is described as follows (Yuan et al., 2001): ETreal = R +Δθs - Es - Pp [7] where ETreal is the real evapotranspiration of the crop (mm d-1); R is the amount of irrigation water supporting the system (mm d-1);Δθs is the variation of soil water content (mm d-1); Es is the surface runoff (mm d-1); Pp is the water flow toward the deepest horizons (mm d-1). This balance did not consider surface runoff given that a drip irrigation system was used and there was a plastic cover over the soil that impeded lateral runoff of the water. Deep percolation below root level and upward flow from the water table were also considered negligible, given that below 40 cm there is a layer with low hydraulic conductivity that limited the normal water flow and root growth. The construction of two rhizotrons, which two walls were glass plates and the upper part was covered with mulch, allowed for seeing the wetting bulb and also observing that there was no hanging water table. Likewise, the rhizotrons showed that the greater part of the roots was distributed in the first 30 cm of the soil. On the other hand, soil water measurements at 40 and 60 cm depths using the TDR indicated that soil water content between 40 and 60 cm depths remained relatively constant and close to field capacity, indicating that there were not crop water consumption below 40 cm and upward flow (Figure 2b). In this respect, the variation of the soil moisture values below 40 cm was between 28 and 31%, which is within the precision range of the TDR. Due to this small variation in soil water measurements below 40 cm depth, deep percolation was equal to 0. Thus, Equation [7] becomes: ETreal = R + Δθs To evaluate the behavior of the Rn model, the estimated net radiation fluxes (Rne) were compared to observed net radiation fluxes (Rno) using the net radiometer located inside the greenhouse. The ETreal estimated by the PT model was compared to the ETreal obtained from the water balance. In this case, values of ETreal by PT model were calculated using: (A) Rgi and G ≠ 0; (B) Rgi and G = 0, (C) Rge and G ≠ 0 (D) Rge and G = 0. The comparison between the observed and estimated values included the mean deviation (MD), the root mean square error (RMSE) and the absolute relative error (ARE) as statistical parameters.As well, a regression analysis was made between observed and estimated values, in which the Z test was used to evaluate if the slope of this regression was equal to 1 and the intercept was equal to 0. A sensitivity analysis was made to evaluate the effect of considering Ta = Tcv (ΔT = 0) on the estimation of net radiation. For this analysis, data of air temperature measured in AWS were compared with leaf temperature measured with porometer to determine ΔT variation range. RESULTS Climatic measurements inside the greenhouse showed that the conditions until the beginning of flowering were unfavorable to rapid growth and high transpiration rates (Figure 1). More than 50% of the days in this first period were completely or partially cloudy and mean temperatures fluctuated between 10 and 20 ºC, relative humidity was between 70 and 90% and global radiation did not exceed 15 MJ m-2 d-l. Under these climatic conditions the tomato water consumption (ETreal < 1.6 mm d-1) was only a fifth of the total water requirement from transplanting to the end of harvest. Also, Figure 1 indicates that temperatures inside the greenhouse were higher than exterior temperatures throughout the season, but this was not the case with relative humidity, which was lower inside of the structure until the middle of the season (third bunch set). From this point (Day of Year [DOY] 308), the greenhouse ventilation produced a greater gas exchange that balanced interior and exterior relative humidity. In general, soil moisture fluctuated between field capacity and critical value (Figure 2a) indicating that the irrigation was adequate. The values of θ were below the critical value (θ = 22.5%) only between DOY 325 and 332, nevertheless this did not significantly affect crop growth. On those days, soil moisture content varied between 20.9 and 22.1%. The high tomato yield (152 t ha-1) obtained in this study indicates that the crop yield was not restricted by water stress. Interior solar radiation The daily solar radiation values measured inside the greenhouse were on average 62% of the observed exterior solar radiation values (Figure 3a). In this case, the ratio of Rgi to Rge was quite constant throughout the season (Figure 3b). The statistical analysis indicated a linear regression through the origin because the intercept was not significantly different from 0 (Z test with p < 0.01). Thus it was established that the parameter τ presented in Equation [4] has an average value of 0.62 for the plastic cover used in this experiment, which is lower than the value (τ = 0.68) observed by Vuscovich (2001) for a polycarbonate cover. Net radiation and heat soil flux Table 2 indicates a good performance of the net radiation model using Rgi or Rge. In both cases R2 was greater than 0.97 with ARE value of 6%. Also, MD and RMSE values were less than 0.08 and 0.28 mm d-1, respectively. These results are similar to those reported by Ortega-Farías et al. (2004a) for a field tomato crop (RMSE = 0.24 mm d-1 and ARE = 4.1%). Figure 4a indicates most of the points were close to 1:1 line indicating that estimated and observed values were similar. The statistical test indicated that the slope and the intercept of the lineal regression between Rne and Rno were not statistically different from 1 and 0, respectively, both for Rn estimated with Rgi or Rge (Table 2). This result suggests that it is possible to compute Rn using measurements of Rge. The sensitivity analysis indicated that the model could underestimate Rn by about 26% when temperature gradient (DT) between Tcv and Ta was equal to 3 °C (Table 2). Also, RMSE was 0.65 mm d-1 and DM was 0.61 mm d-1 . In this study, cumulated ETreal from August to December was 333.5 and 290.2 mm for ΔT = 0 and ΔT = 3 °C, respectively. In this regard, Ortega-Farías et al. (2004a) indicated errors less than 4.1% on the estimation of Rn over a well-irrigated tomato crop when assuming ΔT = 0. In this study, more than 60% of the data showed DT values less than 3 ºC for field tomato crop. For our experiment, comparison between Tcv and Ta indicated that in over 98% of data DT variation was less than 3 ºC. The Figure 3b indicates that daily values of G presented small variations from transplanting (LAI = 0.1 m2 m-2) to the beginning of harvest (LAI = 2.7 m2 m-2). Maximum and minimum values of G were 0.5 mm d-1 (1.2 MJ m-2 d-1) and -0.4 mm d-1 (-0.9 MJ m-2 d-1), respectively. This data analysis support the assumption of using G = 0 in the PT model to estimate the ETreal for a greenhouse tomato crop. Evapotranspiration The Figure 4b indicates the comparison between ETreal estimated by WB method and PT model. For the PT model, values of ETreal were calculated using (A) Rgi and G ≠ 0; (B) Rgi and G = 0; (C) Rge and G ≠ 0, and (D) Rge and G = 0. For all these cases, points were close to the 1:1 line indicating a good comparison between ETreal estimated by WB method and PT model. For cases A, B, C and D the Table 3 shows that PT model tended to overestimate cumulative value of ETreal with errors between 1.6 and 6.2% from transplanting (DOY = 220) to 50% of harvest (DOY=365). PT model overestimated the total ETreal by about 20 mm when G was assumed negligible (cases B and D). In general, PT model was able to reproduce tomato evapotranspiration during the study period (135 d), with maximum values of ETreal observed from DOY 320 to 355 (Figure 5). These maximum mean values of ETreal were around 5 mm d-1, which are lower than the 6 mm d-1 measured by Vuscovich (2001) in the area of Chillán. This difference could be due, on one hand, to the tomato cultivar used in the experiment of Vuscovich (2001), or the higher transmisivity of the polycarbonate than compared to the polyethylene, allowing more radiation inside the greenhouse. Finally, Figure 5 also shows that the PT method over-estimates the values of ETreal obtained by WB after leaf removal (DOY = 332). Likewise, a slight under-estimation of ETreal was observed in the first stage of the crop (until DOY = 270). DISCUSSION The assumptions proposed for calculating net radiation did not produce major errors from the point of view of the use of this model for irrigation scheduling using the PT equation. When ΔT was equal to 3 °C, errors in the estimation of net radiation (RMSE < 0.7 mm d-1) was not significant. Concerning crop emissivity, a short calculation indicates that a change of 0.01 in the emissivity value is equivalent to ΔTof 1 °C. Also, increasing the value of emissivity used in this study (0.92) by 0.03, the errors would not go beyond 0.7 mm d-1 in the calculation of Rn. The good performance of the Rn estimations using solar radiation measured outside the greenhouse opens the possibility of using a solar radiation sensor located outside in order to characterize the internal shortwave radiation. For this purpose, the transmission properties of the covering material should be considered. Various relevant points for discussion emerge from the ETreal estimation with the PT method calculated using the Rn model and with measured G values or G values equal to 0: i) The use of an a value equal to 1.12, different from the value of 1.26 commonly described in the literature, seems correct for the conditions of this experiment. McAneney and Itier (1996) pointed out that under stable weather conditions (with little wind, as is the case of a greenhouse) the value of a can be different from 1.26. In this respect, research, such as that of Vuscovich (2001), indicates that the avalue can vary with changes in the vapor pressure deficit, even reaching values close to 2 for periods with a high deficit of humidity in the air. ii) Overestimation at the beginning of harvest probably was originated from leaf removal and from small irrigation problems that arose in this period. In the first case, leaf removal management removed a large amount of foliage (eight lower leaves), notably changing the LAI of the crop (reduced from 3.5 to 2) and consequently the tomato transpiratory surface, a situation that is not considered by the model nor by the crop coefficients used. In the second case, the reduction of available soil water, precisely at the beginning of harvest, probably reduced ETreal for some days, which was not considered by the PT model. This model does not consider a physiological regulation by the plant under water stress conditions, as the Penman-Monteith model does. iii) The use of measured G or its omission in the calculation of ETreal produces similar results (Figure 4b, Table 3). This indicates that application of the PT equation for irrigation scheduling, excluding G, does not produce major errors in the estimation of tomato water requirements.iv) The use of the crop coefficient proposed by Castilla and Fereres (1990) allowed an acceptable estimation of ETreal. Nevertheless, it is necessary to note that the small under-estimation observed at the beginning of the season could be associated with the value of Kc used (0.4), which was probably a little low. As well, the problems of over-estimation observed after leaf removal indicate that it is necessary to correct the Kc values to capture the effect that major leaf removal can have. Thus, new research should propose specific Kc for the variety and above all for the type of crop management carried out in the Talca area. Table 3. Cumulative evapotranspiration (ETreal) for different phenological stages of a tomato crop calculated with water balance (WB) and estimated by Priestley-Taylor (PT) method.
1 Values of ETreal by PT model were calculated
according to the following cases: (A) Rgi and G ≠ 0; (B) Rgi and G = 0;
(C) Rge and G ≠ 0; (D) Rge and G = 0. CONCLUSIONS Results indicated that net radiation could be calculated with an absolute relative error and a mean deviation less than 6% and 0.07 mm d-1, respectively, whether solar radiation measured internally or externally was used. This result suggest that only one radiation sensor located outside the greenhouse, together with measurements of temperature and relative humidity inside of the greenhouse would be sufficient to characterize the net radiation of the tomato crop. In this context, shortwave radiation inside of the greenhouse can be calculated by knowing external solar radiation and the transmission properties of the greenhouse cover. Also, the study indicates that Priestley-Taylor model could estimate tomato evapotranspiration assuming G = 0. The evaluated method could be used for scheduling irrigation of greenhouse tomatoes using internal measurements of temperature and relative humidity and external measurements of solar radiation. In this case, PT model predicted the ETreal with and error of 6.1%. ACKNOWLEDGEMENTS This study was funded by the FONDECYT Project Nº 1970309 and the CONICYT Bicentennial Project PSD-86/2006. The authors are grateful to former students of the Universidad de Talca, colleagues Ben-Hur Leyton, Gonzalo Enríquez and Jenny Pino for their participation in gathering data. We also thank Dr. Hernán Paillán for providing the infrastructure and materials used in conducting this experriment. LITERATURE CITED
Copyright 2009 - Instituto de Investigaciones Agropecuarias, INIA (Chile). The following images related to this document are available:Photo images[cj09001f1.jpg] [cj09001f5.jpg] [cj09001f3.jpg] [cj09001f2.jpg] [cj09001f4.jpg] | ||||||||||||||||||||||||||||||||||||||||||||||||||||||||||||||||||||||||||||||||||||||||||||||||||||
| |||||||||
