 |
| About Bioline | All Journals | Testimonials | Membership | News |
|
||||||
|
||||||
Chilean Journal of Agricultural Research (formerly Agricultura Técnica), Vol. 69, No. 1, Jan-Mar, 2009, pp. 12-20 RESEARCH Effect of the Irrigation Canal Network on Surface and Groundwater Interactions in the Lower Valley of the Cachapoal River, Chile Efecto de la Red de Canales de Riego en las Interacciones de Agua Superficial y Subterránea en la Parte Baja del Valle del Río Cachapoal, Chile. José Luis Arumí1*, Diego Rivera1, Eduardo Holzapfel1, Peter Boochs2, Max Billib2, and Alexander Fernald3 1Universidad de Concepción, Facultad de Ingeniería Agrícola, Av. Vicente Mendez 595, Chillán, Chile. *Corresponding
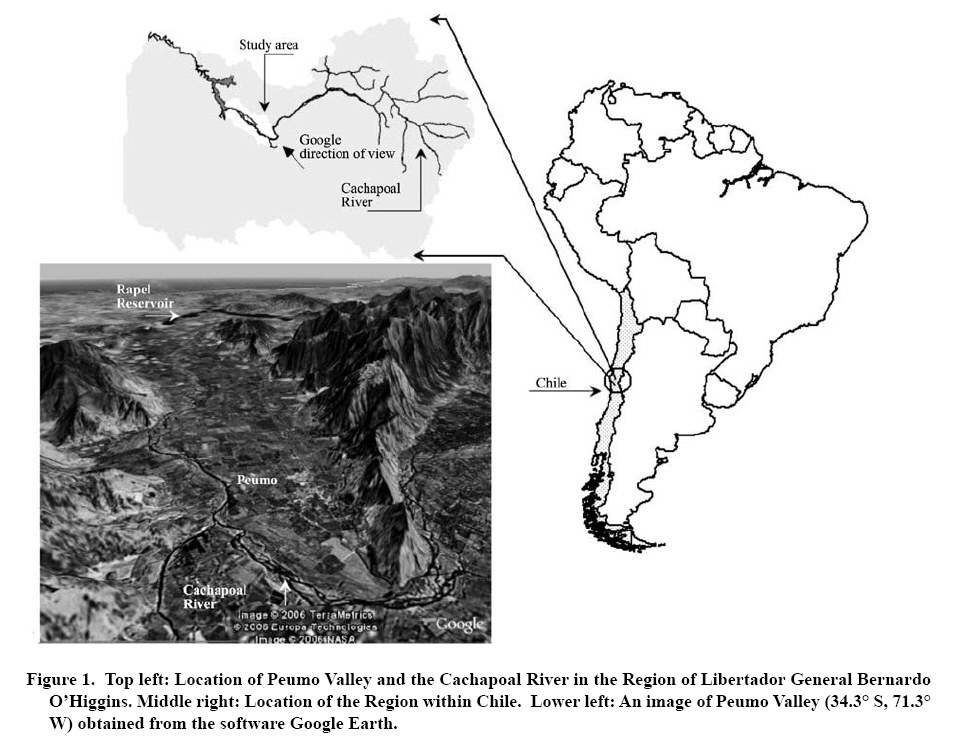
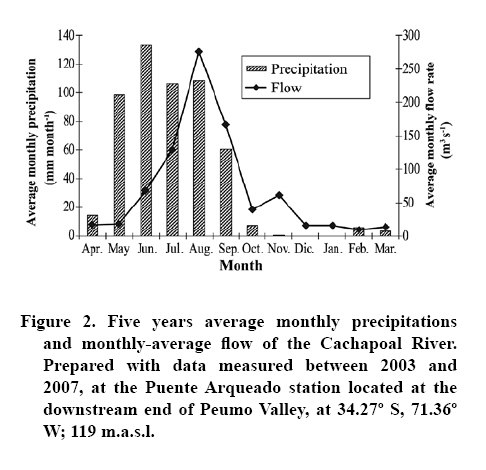
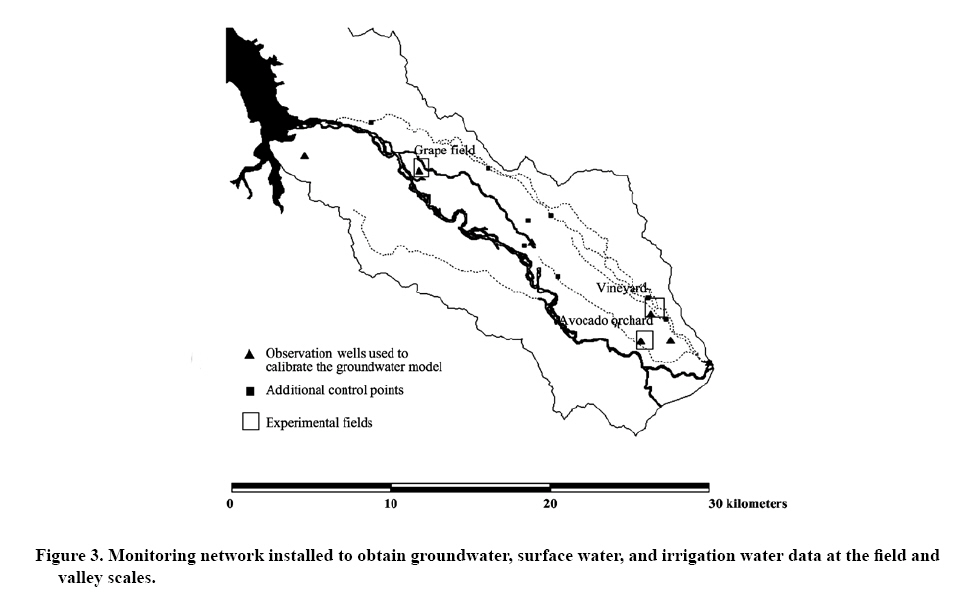
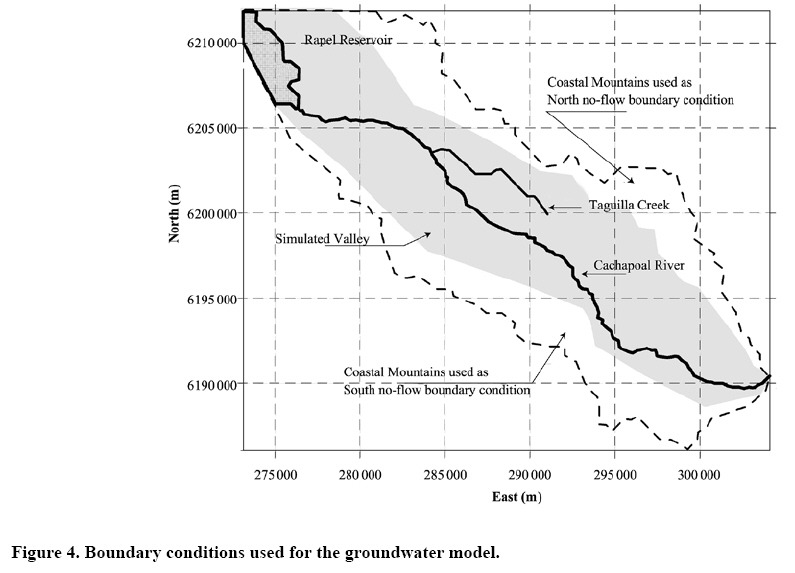
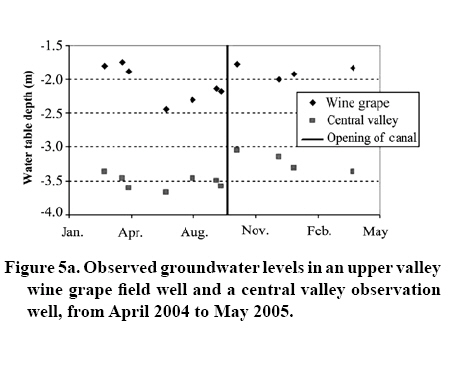
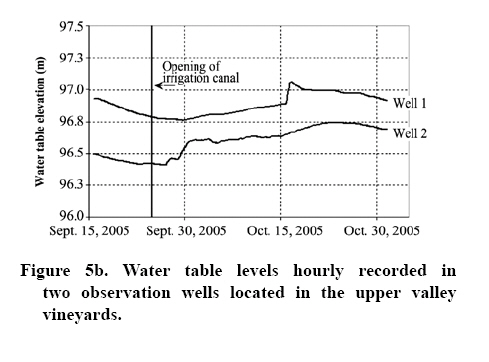
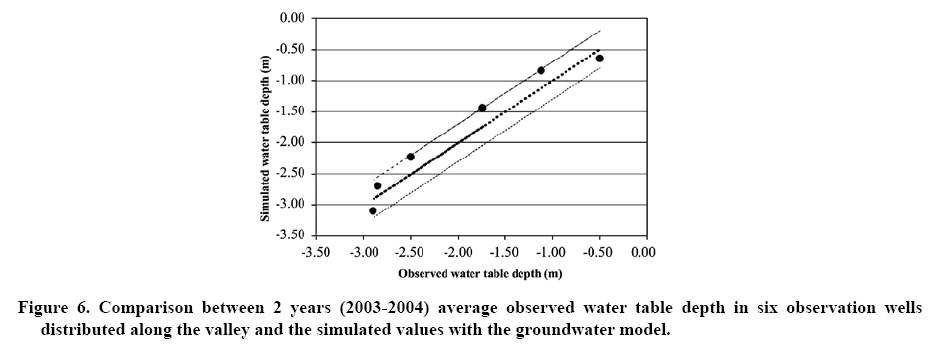
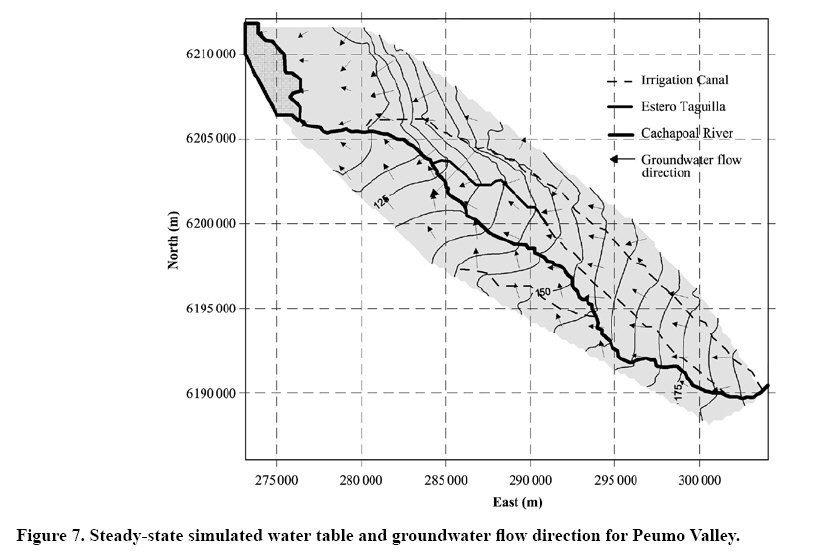
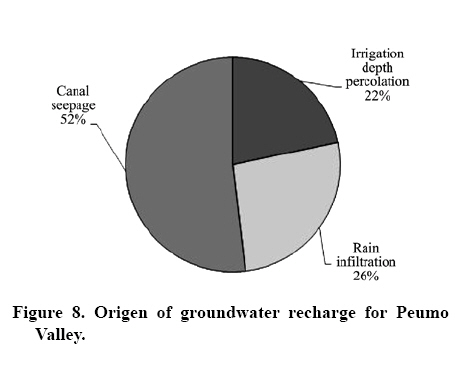
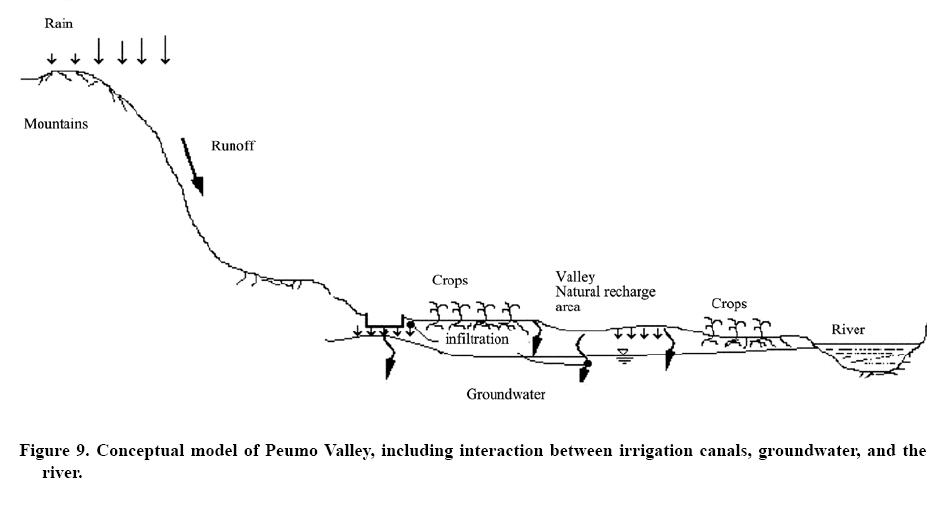
author (jarumi@udec.cl ) Received: 15 November 2007 Code Number: cj09002 ABSTRACT Agricultural production of high value crops in Chile's Central Valley is highly dependent on surface and groundwater resources. They are connected and together form an integrated hydrological system, the individual components of which have to be studied. This research is addressed to answering two questions: 1) to what extent doirrigation and canal seepage contribute to groundwater recharge and 2) what is the influence of the interactions between the Cachapoal River and ground water. The study was carried out from 2003 to 2007 in Peumo Valley (34.3° S, 71.3° W). In winter, the irrigation canal network intercepts and diverts surface runoff, which flows to flat areas and recharges groundwater. In summer, infiltration from the canals recharges the aquifer directly and partially compensates for water uptake from plants and evaporation. The effects of both interactions keep groundwater at a relatively constant level over the whole year. The water balance of the valley is strongly affected by agricultural practices, groundwater recharge mainly originating from irrigation loss (22%) and canal seepage (52%). It is important to know how management decisions, such as change in irrigation practices or canal lining, can affect the hydrological system and agricultural production within the valley. Key words: agriculture, Chile, groundwater, irrigation seepage, MODFLOW, surface water-groundwater interactions. RESUMEN La producción agrícola de exportación en la Zona Central de Chile es altamente dependiente de los recursos hídricos superficiales y subterráneos, los que a su vez están conectados formando un solo sistema hidrológico a través de procesos que no están bien estudiados. Esta investigación apunta a responder dos preguntas de trabajo: 1) Entender el efecto de las filtraciones de los canales de riego en la recarga de los sistemas de aguas subterráneas; y 2) Identificar los patrones de interacción entre las aguas subterráneas y superficiales en el valle de Peumo. Este estudio se ejecutó entre los años 2003 y 2007 en el valle de Peumo, localizado en la Tercera Sección del Río Cachapoal, Región del Libertador General Bernardo O´Higgins, Chile (34,3° S, 71,3° O). En invierno, la red de canales que no transporta agua actúa como una red de drenes interceptores que desvía la escorrentía invernal, que en otro caso llegaría a las zonas planas y recargaría el acuífero. En verano, la infiltración desde los canales recarga el acuífero compensando las demandas de agua por evapotranspiración. El efecto de esta interacción es la estabilidad de los niveles freáticos durante todo el año. La hidrología del valle es afectada por las prácticas agrícolas; la recarga de agua subterránea proviene principalmente de pérdidas de riego (22%) e infiltración desde los canales (52%), por esa razón es importante entender de qué forma las decisiones de manejo, como el revestimiento de canales, pueden modificar el balance de aguas en el valle y su potencial productivo. Palabras clave: aguas subterráneas, filtraciones por riego, MODFLOW, interacciones aguas superficiales-subterráneas. INTRODUCTION Winter demand from the northern hemisphere for fresh agricultural products has led to growth of export agriculture in the Central Valley of Chile, resulting in increasing production of products such as vegetables, fruits, and wine grapes (Arumi et al., 2005). To maintain this increased productivity, farmers take advantage of both surface and subsurface water resources. Throughout the Central Valley, intensive agriculture relies heavily on irrigation systems. using river-fed irrigation canals and groundwater-supplied pressure systems. Surface water and groundwater resources are treated (both legally and operationally) as two distinct systems. However, recent hydrologic conceptualization has recognized that they are intricately connected (Winter et al., 1998). Irrigation canal managers, for example, concerned about seepage from unlined canals in Peumo Valley (the area of this study) have considered lining canals in order to reduce seepage or piping surface flow to add the benefit of hydroelectric power generation. These activities may affect the hydrological system and agricultural production within the valley. Seepage from irrigation canals can be an important source for recharging shallow groundwater aquifers. It has been shown that recharge from irrigation canals causes groundwater to rise directly beneath the canals (Maurer, 2002), though larger valley aquifer effects have not been documented. In northern New Mexico it was shown that canal and field seepage increases water tables under farms during irrigation season (Fernald et al., 2007). Effects on a larger scale have only been documented in a few situations. In the North Platte River Valley (USA), for example, stable isotope studies confirmed that irrigation canal seepage was the origin of recharge, causing a rise in local groundwater levels (Harvey and Sibray, 2001). Lining irrigation canals was shown to reduce the availability of shallow groundwater that supplied wells to irrigated cropland (Calleros, 1991). Modeling studies have illustrated the effect of canal seepage on shallow alluvial aquifers (Yussuff et al., 1994; Ram et al., 1994). If lining canals reduces seepage rates, there may be less recharge to shallow groundwater. The objective of this study was to determine and quantify the interactions between surface and groundwater in Peumo Valley , Chile, which is important for a prognosis ofpossible impacts of modifying the irrigation system on agricultural production. This research was addressed to answering two questions: 1) to what extent irrigation and canal seepage contribute to groundwater recharge, and 2) what is the influence of the interactions between the Cachapoal River and ground water. MATERIALS AND METHODS Site description Peumo Valley is located (34.3º S; 71.3º W; 192 to 112 m.a.s.l.) 100 km south of Santiago, Chile (Figure 1). The study area encompasses the northern half of the lower part of the Cachapoal River basin, between the town of Peumo (34.41°S; 71.14°W; 192 m.a.s.l.) and the Rapel Reservoir (34.26° S; 71.42° W; 112 m.a.s.l.). The Cachapoal River headwaters are in the Andean Mountains, and its watershed covers approximately 6500 km2. After crossing the Central Valley, the river dissects the Coastal Range, forming a gap that is the narrow southeast to northwest oriented Peumo Valley (Figure 1). In the 160 km2 Peumo Valley, the predominant agricultural activity is fruit production. Hydrologically, the valley has well defined boundaries. The Coastal Mountain Range defines the northern and southern border of the valley. The Cachapoal River flows after a bend at the upper end of the valley in the middle from west to east. At the downstream end of the valley is the Rapel Reservoir (695 Mm3), which was constructed in 1970. All surface water inputs to the valley, except precipitation, come from the river. The water for irrigation comes mainly from the river and to a lesser extent from groundwater wells within the valley. The irrigation canal network covers the entire valley and is composed of unlined earthen canals. Most of them are more than 100 years old. Figure 2 presents average values for monthly precipitations and the monthly-average flow of the Cachapoal River, based on data measured between 2003 and 2007 at the Puente Arqueado station, which is located at the downstream end of Peumo Valley (34.27º S; 71.36º W; 119 m.a.s.l.). The valley´s hydrologic regime may be divided into three main periods, characteristic of the Central Valley of Chile (DGA, 1987): (a) The period from March to September is the rainy season, with abundant surface runoff both in the river and in the streams that drain the slopes of the Coastal Mountain Range. Irrigation canals are closed during this period to avoid flood damage. (b) The period from September to November is characterized by occasional rain, with less surface runoff than during the rainy period. Some of the smaller rivers dry up, while the Cachapoal River continues to receive snowmelt inputs from the Andes. Between the middle and the end of September, irrigation diversions are opened. (c) The period from November to March has very low precipitation, but high evapotranspiration. The smaller rivers are dry and the flow of the Cachapoal River is highly reduced in large sections due to diversions for irrigation. The groundwater system in the valley consists of an unconfined aquifer, which is 70 m at its deepest. The aquifer is composed primarily of sand and gravel from fluvial deposits. The saturated hydraulic conductivities range from 30 to 100 m d-1 (Hauser, 1990; Rodriguez et al., 2002; DGA, 2005). The highly permeable layers are traversed by the irrigation canal network, which gives the possibility for groundwater recharge by seepage from leaky canals (Rivera et al., 2005). Monitoring network A monitoring network was installed to obtain groundwater, surface and irrigation water data. Data were collected at an experimental field and at some points in the valley (Figure 3). The measuring period ranged from 2003 to 2006. Data were taken monthly and more frequently from October to April, during the irrigation season. Observation wells were installed to study the effect of irrigation systems on the water table at the field scale. The wells were steel pipes with an interior diameter of 5 cm, with the bottom meter of piping screened over. There were driven into the ground manually to a depth approximately 1.5 m below the lowest seasonal water table, covering the normal fluctuation of the water table. Wells were installed at three study fields: 1) six wells in a vineyard at the upstream end of the valley; 2) four wells in an avocado orchard, also at the upstream end of the valley; and 3) seven wells in a table grape field at the lower end of the valley (Figure 3). In six of the wells, measurements were taken hourly with a water height sensor (Tru track WT-HR 200 Water Height Datalogger, Christchurch, New Zealand), reported to be precise to 2 mm. Water levels in the remaining wells were measured manually with an electronic water level indicator (Eijkelkamp, Sounding apparatus, Giesbeek, The Netherlands) precise to 0.5 cm. To characterize shallow groundwater flow and study the influence of irrigation canal seepage on the groundwater table at the scale of the valley, additional groundwater monitoring locations were sampled manually. In the middle of the valley, three unused irrigation wells were added to the monitoring network (Figure 3). Water levels were also measured at surface water locations throughout the valley: at upper and lower valley locations on the river, in five irrigation canals, and four locations in irrigation drainage canals. Water quality sampling points were also established at 20 locations corresponding to the same network of groundwater and surface water hydrology sampling locations. In addition to the river, irrigation canals, and drainage canals, there were two sampling points on the upper and lower ends of the Taguilla Creek, which drains the central part of Peumo Valley. Monthly samples were analyzed: 1) in the field for pH, electrical conductivity, and dissolved oxygen with an multiparametric probe (Yellow Springs Instruments, YSI 556 probe, Yellow Springs, Ohio, USA); 2) in the lab for nitrate with a photometer (Yellow Springs Instruments, YSI 9000 Series analysis kit, Yellow Springs, Ohio, USA); and 3) for fecal coliform by independent laboratories. Groundwater model A groundwater model was developed using geological and hydrogeological information obtained from previous studies (Hauser, 1990; Rodriguez et al., 2002; DGA, 2005). The numerical model was built using the software PMWIN 5.1 (Chiang and Kinzelbach, 2001), which is based on the MODFLOW simulation model of McDonald and Harbaugh (1988). The study area was discretized by a uniform quadratic grid with a cell size of 250 by 250 m2. The boundary conditions for the model were: i) the Coastal Mountains, located along the north and south border of the valley, designed as no-flow boundaries; ii) the Cachapoal River and Taguilla Creek, used as general head boundaries (Anderson and Woessner, 1992); and iii) the Rapel Reservoir, used as a downstream fixed head boundary (Figure 4). Groundwater recharge was estimated using a monthly hydrological model from Orrego (2003), which included precipitation and irrigation. Data for the topography were obtained from SRTM (Shuttle Radar Topography Mission) data from NASA (http://www2.jpl.nasa.gov/srtm/), with a resolution of 90 m. RESULTS Effect of irrigation canal seepage on groundwater recharge Interactions between irrigation canals and groundwater can be found throughout the valley. Examples are measurements of the groundwater level data of a well in an upper valley vineyard and of a central valley observation well. After dropping during winter (from April to August), the water table rises by 40 cm 3 to 4 weeks after the beginning of irrigation canal operations in September (Figure 5a). Around late spring (November) and early summer (January-February), water levels drop again. The different water table depths (Figure 3) can be explained by the location of the wells. The upper valley vineyard is located in an area where groundwater is recharged by seepage from the main irrigation canals. The central valley observation well is located near a major drainage creek that stabilizes the water level. More detailed information on groundwater response to irrigation seepage was observed with the automated sampling locations in the upper valley vineyard (Figure 5b). Both wells showed a water table rise of 35 cm, after the opening of irrigation diversions (usually after 20 September), with the timing of this increase related to their distance from the irrigation canal. Well 1 was located 110 m from the irrigation canal and the water table peak was observed 22 days after the opening of irrigation diversions. Well 2 was located 390 m from the irrigation canal and the water table peak was observed 28 days after the opening of irrigation diversions. An ongoing process-level study, combined with basic water balance concepts, leads to the following interpretations of these seepage and groundwater patterns. On the annual scale, water levels drop until June because there is no recharge from precipitation or runoff. There is a delay in water table rise after the beginning of the irrigation season corresponding to the time required to fill the available soil water capacity. Declines in the water table in spring and early summer correspond to the period of increased plant evapotranspiration demand. After the beginning of the irrigation season, the difference of about 5 days between the water table peaks of Well 2 and Well 1 is a function of the travel time of seepage water moving from the irrigation canal under croplands. Both wells are located on the same line perpendicular to the irrigation canal. Though the peaks (Figure 5b) represent different travel times of seepage pulses, water table decline is at the same time at the two locations, because it is caused by evapotranspiration demand. Groundwater model The groundwater model was calibrated assuming steady state conditions. As a basis for comparison of calculated and measured groundwater levels, the average values of measurements from two years (2003-2004) from six observation wells were used (Figure 6). Additionally, the model was validated by a consistency analysis of the water balance. On the basis of the first model approximation, irrigation canal effects on groundwater were negligible. However, by monitoring network data, incorporating field observations and modeling, it was shown that this was incorrect. Thus, the main irrigation canals were incorporated into the groundwater model. The model results show that groundwater flow is strongly affected by the valley longitudinal gradient (0.3%). The model revealed that the Cachapoal River changed from infiltration at the head of the valley to exfiltration at the central and bottom parts of the valley (Figure 7). The model results are consistent with field observations. At the upstream end of the valley, the water table is very high, less than 50 cm below the soil surface, and farmers must install drainage systems to lower the water table to produce crops. On the other hand, at the lower end of the valley, where the water table is above the stream stage, several river bank springs were observed. Furthermore, the irrigation canals interact with the aquifer and contribute more than 50% of groundwater recharge (Figure 8). DISCUSSION In the absence of a complex irrigation network, recharge processes in Peumo Valley and similar valleys in the region would involve winter wet season surface and subsurface runoff from the Coastal Range uplands into the valley floor. This runoff would recharge groundwater in winter, leading to higher water tables. In the summer dry season, plant evapotranspiration demand and lack of precipitation or upland runoff would lead to lowered water tables. However, in Peumo Valley, where there is now a highly developed irrigation canal network, the large main irrigation canals bound the edge of the valley, intercept upland runoff, and transport the water to the river at the lower end of the valley. This runoff interception by canals greatly reduces the valley aquifer recharge by upland runoff. Irrigation canal seepage serves to recharge the shallow aquifer in summer, unlike natural recharge that would take place in winter, leading to higher water tables in late spring (Figure 9). It is important that land and water managers know how the reduction or removal of canal seepage affects the interactions between surface water and groundwater. The current shallow groundwater levels of the valley depend mainly on recharge from irrigation canal seepage. Modifications to the canals, such as lining them with impermeable materials, could lead to a reduction of groundwater recharge and changes in crop production patterns due to lowered groundwater levels. In terms of ecological functions supported by this agricultural landscape, riparian vegetation along irrigation canals play an important role in diffuse source pollution control and wildlife habitat, both aquatic and terrestrial (Cirmo and McDonnell, 1997; Cey et al., 1999). Field campaigns identified high riparian vegetation production along irrigation canals in Peumo Valley, and foliar analysis of this riparian vegetation showed high N concentrations (1000 mg kg-1) similar to local fertilized wine grapes. Accordingly, riparian vegetation acts as a biofilter that naturally contributes to maintenance of lowered N concentrations in surface waters (Novotny, 2002). It is likely that the riparian vegetation contributes to improved water quality by reducing turbidity and conductivity, important for agricultural management and aquatic habitat, though further studies are necessary to fully characterize these functions (Fernald et al., 2007). Relatively low (< 10 mg L-1) nitrate concentrations were identified in Peumo Valley groundwater study wells (Arumí et al., 2005). A single well with higher nitrate concentration (~ 30 mg L-1) was identified in 2006; this high nitrate concentration was attributed not to current farm operations, but to the close proximity of wells (< 50 m) to a former confined animal feeding operation. Predominantly low nitrate levels in groundwater and drainage surface water are likely due to possible denitrification under local conditions of a high water table, low oxygen, high temperature, and high dissolved organic carbon (Arumí et al., 2005). Therefore, even though N fertilizers are leaching from irrigated fields (Matta, 2007), nitrate is not present in elevated concentrations in the groundwater. However, we need to develop further studies to understand some water quality aspects related to sediment transport and pesticide management in Peumo Valley. CONCLUSIONS The Peumo Valley irrigation canal network has a strong influence on the valley's hydrologic system, defining the spatial and temporal patterns of groundwater recharge. Once the irrigation diversions are opened, they produce sustained elevated water tables due to irrigation canal seepage, contributing to more than half of groundwater recharge. Land and water managers who are planning to line irrigation canals should know how the reduction or removal of canal seepage affects the interactions between surface water and groundwater. Current shallow groundwater levels of the valley depend mainly on recharge from irrigation canal seepage. Modifications to the canals, such as lining them with impermeable materials, could lead to a reduction of groundwater recharge and changes in crop production patterns due to lowered groundwater levels. Acknowledgements The authors wish to express thanks for the support given by the Chilean Government through the project FONDEF D02I-1146, and the BMBF-CONICYT project CHL 06/008. The production of this manuscript was also supported in part by the Cooperative State Research, Education and Extension Service, U.S. Department of Agriculture under Agreement No. 2005-34461-15661. LITERATURE CITED
Copyright 2009 - Instituto de Investigaciones Agropecuarias, INIA (Chile). The following images related to this document are available:Photo images[cj09002f7.jpg] [cj09002f4.jpg] [cj09002f6.jpg] [cj09002f3.jpg] [cj09002f5b.jpg] [cj09002f8.jpg] [cj09002f9.jpg] [cj09002f1.jpg] [cj09002f2.jpg] [cj09002f5a.jpg] |
| |||||||||
