 |
| About Bioline | All Journals | Testimonials | Membership | News |
|
||||||
|
||||||
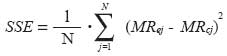
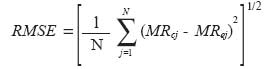
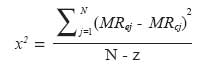
Chilean Journal of Agricultural Research, Vol. 69, No. 2, April-June, 2009, pp. 171-178 Research Kinetic Study of convective drying of blueberry variety O'neil ( Vaccinium corymbosum L.) Vega-Gálvez A, Lemus-Mondaca R, Tello-Ireland C, Miranda M, Yagnam F Universidad de La Serena, Departamento de Ingeniería de Alimentos, Av. Raúl Bitrán s/n. Box 599, La Serena Correspondence Address:Universidad de La Serena, Departamento de Ingeniería de Alimentos, Av. Raúl Bitrán s/n. Box 599, La Serena avegag@userena.cl Date of Submission: 04-Jan-2008 Date of Acceptance: 14-Apr-2008 Code Number: cj09020 Abstract The aim of this research was to study and to model the drying kinetics of the blueberry ( Vaccinium corymbosum L.) at three temperatures (60, 70 and 80 ºC) with an airflow of 2.0 ± 0.2 m s -1 . Modeling of the desorption isotherm was carried out with the GAB (Guggenheim, Anderson and de Boer) equation, showing a good fit to experimental moisture data, giving as a result a monolayer moisture level of 0.084 g water g -1 dm. Newton, Henderson-Pabis, Page, Modified Page and Logarithmic mathematical models were applied in the study and in the modeling of the drying kinetics of this fruit. Kinetic parameters k of each model showed dependence on temperature, and were evaluated by an Arrhenius-type equation, with an activation energy of between 36.2 and 54.5 kJ mol -1 . Logarithmic and Modified Page models gave the best fits for each drying curve, based on the statistical test determination coefficient, sum square error, root mean sum errors and Chi-square. In consequence, both models are excellent tools for estimating the drying time of this product.Keywords: blueberry, GAB, drying, modeling, statistical tests. Introduction The blueberry variety O′Neil belongs to the genus Vaccinium , of the family Ericaceae , native of North America. It is in the product grouping of berries that includes strawberry, blackberry, raspberry, and others (USHBC, 2007). It was introduced in Chile in 1990 with very good adaptive results, with the result that Chile is now considered as the main producing country of this product in the Southern Hemisphere and the third largest producer worldwide. Of the total production, 85 to 90% is exported, mainly as fresh-cooled, and a small amount is shipped frozen (Chilealimentos, 2007). The production that does not meet whole-berry quality standards is generally converted to clarified and/or concentrated juice, and other technological alternatives are being explored in order to successfully market second quality material, including convection drying with previous pretreatment (osmo-drying, high pressure drying, etc.). Blueberries are almost spherical, depending on the species and cultivation conditions, and between 0.7 and 1.5 cm in diameter, with a dark blue color. They contain up to 100 very small seeds in a central core (Stückrath and Petzold, 2007). In Chile, blueberries mature between December and late January, depending on the cultivation zone, and extending over a period of 4 to 5 wk. These berries are a rich source of antioxidant phytonutrients, which are believed to be associated with the antioxidant activity of anthocyanin pigments, flavonoids, and other phenolic compounds containing about three times the total phenolic compounds found in other berries (Skrede et al ., 2000). Blueberries have become very popular with consumers because of the research findings that associate their consumption with improvements in human health (Nindo et al ., 2007). However, seasonality, market accessibility and costs commonly limit the consumption of fresh fruits and vegetables, so dehydrated products are preferred over fresh products for their convenience, availability and shelf life (Azzouz et al ., 2002). Hot air drying is one of most widely used methods for food preservation. The advantage of dehydrated foods is that decreased moisture content reduces thermodynamic water activity, thus preventing the growth of microorganisms that cause spoilage reactions (Babalis and Belessiotis, 2004). The optimization of dehydration processes in the agro-food industry has led to choosing the technological variables involved in the process itself. Good experimental designs, along with statistical programs, help to obtain a higher yield from the operational and capital points of view. This must be done considering a product of the highest quality, depending on the present variables, one of the most important being the time of the drying process. Prior to the study of the drying of any food, it is necessary to recognize and evaluate the moisture sorption isotherms, as these mathematically describe the relation between the water activity and the equilibrium moisture content of the product under study (Vega-Gálvez et al ., 2008). The use of mathematical equations is necessary for the simulation of the kinetics of matter transfer (water) that occurs during this unit operation (Vega et al ., 2007). There are several empirical equations used to simulate the drying process that are exceptionally practical for the study, the modeling of kinetics and the process optimization, as well as for dryer design (Senadeera et al ., 2003). Notably among these equations are those proposed by Newton, Henderson-Pabis, Page and Modified Page, etc. (Doymaz, 2004; Akpinar and Bicer, 2006). The aim of the present study was to determine and model the drying kinetics and desorption isotherm of the blueberry variety O′Neil, using mathematical equations for both phenomena, and to evaluate the influence of drying air temperature on the kinetic parameters. Materials and Methods Raw material and proximate analysis Blueberries of the variety O′Neil ( Vaccinium corymbosum ) were cultivated and purchased in the province of Salamanca, Chile. Samples were selected to provide a homogeneous group, based on their date of harvest, color, size, and freshness according to visual analysis. The moisture content was determined according to AOAC methodology No. 934.06 (AOAC, 1990), using a vacuum oven (Gallenkamp, OVL570, Leicester, UK) at 70 ºC for 72 h, and an analytical balance (CHYO, Jex120, Kyoto, Japan) with an accuracy of ± 0.0001 g. Crude protein content was determined using the Kjeldahl method with a conversion factor of 6.25. Lipid content was analyzed gravimetrically following Soxhlet extraction. Crude fiber was estimated by acid/alkaline hydrolysis of insoluble residue. Crude ash was estimated by incineration in a muffle furnace at 550 ºC. Acidity was determined by the adapted AOAC methodology No. 942.15A (AOAC, 1990), pH was measured using a potentiometer (Extech Instruments, Microcomputer pH-Vision 246072, Waltham, Massachusetts, USA), and sugar content was measured using an Abbe refractometer (ATAGO, 1-T, Tokyo, Japan). All the analyses were made in triplicate and expressed in g 100 g -1 sample. Isotherm experiments Desorption isotherms were measured at 60 ºC. A known mass of sample (in triplicate) was allowed to come to equilibrium with the atmosphere (relative humidity) inside a hermetically sealed flask, which contained a glass dish with a saturated salt solution of known water activity. This standard gravimetric method was recommended by The European Cooperative Project COST 90, which deals with the physical properties of foods (Spiess and Wolf, 1983). The weight of the samples was taken every 15 days until reaching constant weight (equilibrium condition). The salts used to obtain a range of water activity of 0.10 to 0.95 included LiCl, KC 2 H 3 O 2 , MgCl 2 , K 2 CO 3 , NaNO 2 , KI, NaCl and KNO 2 (Lim et al ., 1995). Thymol was added separately in a Petri dish to the recipients containing saturated salt solutions with a relative humidity higher than 75% in order to avoid microbial growth, especially mould (Vega et al ., 2007). Once equilibrium was reached, the moisture content of the samples was determined in triplicate. The relationship between equilibrium moisture content and water activity of blueberries was expressed by the equation proposed by Guggenheim, Anderson and de Boer, commonly termed GAB (Equation The criteria to evaluate the fit quality of GAB mode l were the statisticals determination coefficient (r 2 ) and mean percent square error (%E) (Equation [2]) (Vega et al ., 2007), where X we is the equilibrium moisture content (g water g -1 dm), a w is the water activity (dimensionless), X m monolayer moisture (g water g -1 dm), C o and K o are constants of GAB model (dimensionless), X ei is the experimental moisture content (g water g -1 dm), X ci is the calculated moisture content (g water g -1 dm), N is the number of data values and i is the number of terms. Drying experiments The drying experiment was carried out using a convective dryer designed and built in the Faculty of Engineering of Universidad de La Serena [Figure - 1], La Serena. Three temperatures were used in the study of the drying kinetics (60, 70 and 80 ºC). Drying air velocity was held constant at 2.0 ± 0.2 m s -1 and measured with an omnidirectional anemometer (Extech Instrument Inc., 451112, Waltham, Massachusetts, USA). The inlet relative humidity was 62.0 ± 5.2%, measured by an ambient digital hygro-thermometer (Extech Instrument Inc., 445703, Waltham, Massachusetts, USA). All the drying experiments were carried out in triplicate, using a sample mass of 100.0 ± 2.4 g and the charge density was 8.5 ± 0.3 kg m -2 . Prior to the drying of the samples, they were pretreated with a Pectinex® solution, concentration 0.8% (Novo Nordisk Ferment Ltd., Flawil, Switzerland). The mass was measured on an analytical balance (Ohaus, SP402, New Jersey, USA) with an accuracy of ± 0.01 g at defined time intervals, connected by a interface system (Ohaus, RS232, Pine Brook, New Jersey, USA) to a PC, which recorded and stored the data. The experiments were finished at the point of reaching constant weight (equilibrium condition). The dried samples were packaged in polypropylene bags. Modeling of drying kinetics Drying kinetic was modeled by means of five empirical equations widely used in most organic and biological materials. These equations use a relationship termed moisture ratio (MR) as a dependant variable (Eq.3), relating the gradient of the sample moisture in real time (X wt ) with initial moisture (X wo ) and equilibrium moisture (X we ) (Babalis and Belessiotis, 2004). These are Newton (Eq.4), Henderson-Pabis (Eq.5), Page (Eq.6), Modified Page (Eq.7) and Logarithmic (Eq.8). In this research, the shrinkage and external resistance were assumed as negligible. Where k is kinetic parameters (min -1 ), n and a are empirical parameters (dimensionless) and t is drying time (min). ntbl Akpinar and Bicer (2006) ntbl Vega et al . (2007) ntbl Vega-Gálvez et al. (2008) ntbl Doymaz (2007) ntbl Menges and Ertekin (2006) Akpinar and Bicer (2006) In order to observe any influence of drying temperature on the kinetic parameters k , an Arrhenius-type equation was applied (Equation Statistical analysis of the models The fit quality of the experimental data to the desorption isotherm and all the models proposed for drying kinetics were evaluated using the determination coefficient (r 2 ), sum squared errors (SSE, Equation Simal et al . (2005) Toðrul and Pehlivan (2003) Doymaz (2007) Results and Discussion Experimental analysis and desorption isotherm The proximate analysis of blueberry variety O′Neil gave an initial moisture content of 78.13 ± 0.05 g 100 g -1 sample (a w = 0.99 ± 0.01); crude protein (nitrogen x 6.25) of 0.62 ± 0.12 g 100 g -1 sample; total lipids of 0.40 ± 0.04 g 100 g -1 sample; crude fiber of 6.51 ± 0.27 g 100 g -1 sample; ash of 1.20 ± 0.03 g 100 g -1 sample; non-nitrogen extract (by difference) of 12.90 g 100 g -1 sample; acidity of 2.21 ± 0.12% (monohydrated citric acid); pH 2.72 ± 0.09, and soluble solids of 15.01 ± 0.07 ºBrix. [Figure - 2] shows the experimental data of the equilibrium moisture contents of the blueberry desorption isotherm at 60 ºC, where equilibrium moisture content increases as water activity increases from 0.10 to 0.95. The tendency of this isotherm could correspond to that of type II isotherms, according to Van der Waals′ classification (Brunauer et al ., 1938). Various authors working with other types of foods have observed this behavior (Kiranoudis et al ., 1993; Timmermann et al ., 2001; Kaymak-Ertekin and Gedik, 2004). The type II isotherm appears when the bonding energy between the water and the primary layer is less than that occurring among water molecules (Lomauro et al ., 1985). It was observed the good fit on the experimental data obtained by GAB (r 2 = 0.97; %E = 8.64) for a whole range of water activity [Figure - 2]. The sorption parameters obtained were X m = 0.084 g water g -1 dm, C o = 13.319, and K o = 0.933. Similar results of monolayer moisture have been observed in raisins, figs, plums, potatoes, onions and tomatoes with 0.212-0.087 g water g -1 dm for 30-60 ºC (Kiranoudis et al ., 1993); in red and green peppers with 0.113-0.038 g water g -1 dm for 30-60 ºC (Kaymak-Ertekin and Sultanoðlu, 2001); in grapes, apples, potatoes and apricots with 0.220-0.095 g water g-1 dm for 30-60 ºC (Kaymak-Ertekin and Gedik, 2004). Monolayer moisture (X m ) is an important parameter since it has a physicochemical behavior that represents the first layer of water molecules, which can thermodynamically interact with other food compounds (Lim et al ., 1995; Yu et al ., 1999). Behavior of drying curves For all drying experiments, an average outlet temperature of drying air of 60.0 ± 4.2 ºC was obtained. For this reason, the desorption isotherm modeled by the GAB equation was used to estimate the equilibrium moisture content to each temperature, with X we = 0.031 g water g -1 dm for 60 ºC; X we = 0.027 g water g -1 dm for 70 ºC and X we = 0.026 g water g -1 dm for 80 ºC. In general, for all drying experiments, the equilibrium moisture content was lower than 18%, which gives product stability from the commercial and hygienic points of view (Karathanos and Belessiotis, 1999). Increasing the drying temperature decreased drying time [Figure - 3]. The shortest time (500 min) was obtained at 80 ºC in comparison to drying at 70 and 60 ºC, which required times of 800 and 1400 min, respectively. Other research on fruit and vegetable drying present the same tendency and behavior of the drying curves, such as Azzouz et al . (2002); Krokida et al . (2003); Babalis and Belessiotis (2004); Simal et al . (2005); Akpinar and Bicer (2006); Vega et al . (2007); and Doymaz (2007). Modeling of the drying process Drying curves [Figure - 3] showed a clear exponential tendency and only a falling rate period was observed, which is very common in fruit and vegetable drying processes (Toðrul and Pehlivan, 2003; Kingsly et al ., 2007). Under these conditions, the use of the five empirical models is suggested, as mentioned before. [Table - 1] shows the values for the kinetic parameters k of the five models for each drying temperature evaluated. A value of p < 0.05 for a confidence level of 95% was obtained by ANOVA, using Statgraphics Plus® 5.1 software (Statistical Graphics Corp., Herndon, Virginia, USA), suggesting there are statistically significant differences among these kinetic parameters with respect to temperature. In order to prove the dependence of these parameters on the drying temperature, an Arrhenius-type equation [Figure - 4] was applied, showing r 2 ≥ 0.95. The activation energy obtained for each kinetic parameter was 51.05 kJ mol -1 (Newton), 54.45 kJ mol -1 (Henderson-Pabis), 36.20 kJ mol -1 (Page), 46.39 kJ mol -1 (Modified Page), and 48.34 kJ mol -1 (Logarithmic). Several authors have presented very similar activation energy values, including Azzouz et al . (2002); Babalis and Belessiotis (2004); Simal et al . (2005); Akpinar and Bicer (2006), Doymaz (2007) and Vega et al . (2007). Kinetic parameter k (min -1 ) also showed a clear tendency of increasing as the working temperature increased [Table - 1]. Similar results were obtained by Karathanos and Belessiotis (1999) working with figs, plums and raisins; Toðrul and Pehlivan (2003) with apricots; and Akpinar and Bicer (2006) in strawberry drying. The empirical parameters n of Henderson-Pabis, Page, Modified Page and Logarithmic, as well as the empirical parameter a , did not show statistically significant differences (p value > 0.05), suggesting they probably depend more on the characteristics of the tissue and the drying air flow (Akpinar and Bicer 2006; Menges and Ertekin 2006). Azzouz et al . (2002), working with grapes, concluded that the parameter n was in function of air flow rate and that the parameter k of Page depended on the temperature and the initial moisture of the product. Karathanos and Belessiotis (1999), working on skinned and non-skinned fruit dehydration, proposed that parameter n increased with the existence of the outer skin depending on its thickness and the kind of product to be dried. Statistical analyses of models Logarithmic and Modified Page models provided good fits to the experimental data for a whole drying process [Figure - 5]. All the models presented high values for the determination coefficient (r 2 ≥ 0.95) at three temperatures (60, 70 and 80 ºC). Furthermore, the lowest SSE, RMSE and c2 values were selected as optimal criteria in order to evaluate the fitting quality of the five models proposed. A good fit was observed based on this evaluation, since low SSE (< 0.0027), RMSE (< 0.0495) and c2 (< 0.0029) values were obtained by Logarithmic and Modified Page models; followed by Henderson-Pabis, Page and Newton. Other authors have also obtained good results when applying these models in drying kinetics of other food and foodstuff (Krokida et al., 2003; Toðrul and Pehlivan, 2003; Doymaz, 2004; Simal et al ., 2005; Menges and Ertekin, 2006; Doymaz, 2007). [Figure - 6] shows the experimental and calculated values for the drying curves represented by MR vs. time for the two best models found in this investigation (Logarithmic and Modified Page). Both models gave similar results over the whole drying process from the beginning to the end, considering the middle stage of the drying process. The good estimations obtained by these two models represent results that are not usually given by many models, since the middle stage of the drying process is the segment where most of the water is removed from the food. Thus, a good simulation is required for the estimation of the optimum drying time.[32] Conclusions The results of this study showed that the GAB model provided a good fit to the experimental data of desorption isotherm, with 8.64 %E and r 2 = 0.97. Drying of blueberries presents a clear dependence on drying air temperature, showing only a falling rate period, and reaching an average equilibrium moisture close to 0.03 g water g -1 dm. All models used to describe the dehydration kinetics were useful. Nevertheless, Logarithmic and Modified Page models gave the best fit quality to drying experimental data at the three temperatures used, based on the statistical tests used for evaluation. All the kinetic parameters k were dependant on the drying temperature, giving an activation energy of 48.34 and 46.39 kJ mol -1 for Logarithmic and Modified Page, respectively. In consequence, both models are excellent tools for estimating the drying time of this product. Acknowledgements The authors wish to thank the Research Office of the Universidad de La Serena (DIULS ) and Ricardo León Alcarraz of Agrícola Estero Camisas for the financial support given to the publication of this research. Resumen El objetivo de esta investigación fue estudiar y modelar la cinética de secado del arándano ( Vaccinium corymbosum L.) a tres temperaturas (60, 70 y 80 ºC) con un flujo de aire de 2,0 ± 0,2 m s -1 . El modelado de la isoterma de desorción se llevó a cabo con la ecuación de GAB (Guggenheim, Anderson y de Boer), mostrando un buen ajuste sobre los datos experimentales de humedad, dando como resultado una humedad de la monocapa de 0,084 g de agua g -1 ms. Se aplicaron los modelos matemáticos de Newton, Henderson-Pabis, Page, Page modificado y Logarítmico para el modelado de la cinética de secado de esta fruta. Los parámetros cinéticos k de cada modelo presentaron dependencia con la temperatura, evaluadas por una ecuación de tipo Arrhenius, con una energía de activación entre 36,2-54,5 kJ mol -1 . Los modelos Logarítmico y Page modificado obtuvieron el mejor ajuste para cada curva de secado, basado en las pruebas estadísticas como coeficiente de determinación, suma de errores cuadrados, raíz media de los errores cuadrados y Chi-cuadrado. En consecuencia, ambos modelos son excelentes herramientas para estimar el tiempo de secado de este producto. Palabras claves: arándanos, GAB, secado, modelado, pruebas estadísticas. References
Copyright 2009 - Chilean Journal of Agricultural Research The following images related to this document are available:Photo images[cj09020f4.jpg] [cj09020f3.jpg] [cj09020f2.jpg] [cj09020f1.jpg] [cj09020f5.jpg] [cj09020t1.jpg] [cj09020f6.jpg] |
| |||||||||

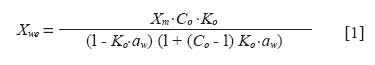 , Quirijns et al. , 2005; Blahovec and Yanniotis, 2008). GAB is commonly used in moisture sorption experiments in different foods, because of its important parameters and physiochemical description, as monolayer moisture (X m ) and the parameters C o and K o (Yu et al ., 1999; Timmermann et al ., 2001). These parameters were obtained by nonlinear regression analysis, using the EXCEL® program of Microsoft® Windows® XP (Redmond, Washington, USA).
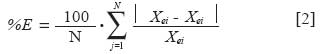
![[Figure - 1]](/showimage?cj/photo/cj09020f1.jpg)
![[Figure - 2]](/showimage?cj/photo/cj09020f2.jpg)
![[Figure - 3]](/showimage?cj/photo/cj09020f3.jpg)
![[Table - 1]](/showimage?cj/photo/cj09020t1.jpg)
![[Figure - 4]](/showimage?cj/photo/cj09020f4.jpg)
![[Figure - 5]](/showimage?cj/photo/cj09020f5.jpg)
![[Figure - 6]](/showimage?cj/photo/cj09020f6.jpg)