 |
| About Bioline | All Journals | Testimonials | Membership | News |
|
||||||
|
||||||
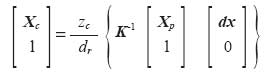
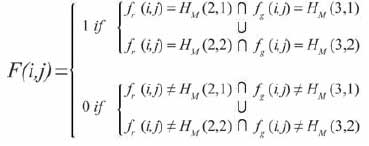
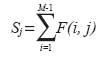
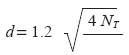
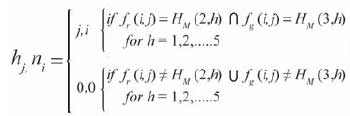
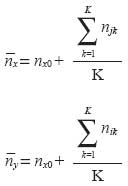
Chilean Journal of Agricultural Research, Vol. 69, No. 2, April-June, 2009, pp. 179-187 Research Location and classification of moving fruits in real time with a single color camera Reyes JoseF, Chiang LucianoE Universidad de Concepcion, Facultad de Ingeniería Agricola, Av. Vicente Mendez 595, Chillan Correspondence Address:Universidad de Concepcion, Facultad de Ingeniería Agricola, Av. Vicente Mendez 595, Chillan jreyes@udec.cl Date of Submission: 18-Mar-2008 Date of Acceptance: 16-Jun-2008 Code Number: cj09021 Abstract Quality control of fruits to satisfy increasingly competitive food markets requires the implementation of automatic servovisual systems in fruit processing operations to cope with market challenges. A new and fast method for identifying and classifying moving fruits by processing single color images from a static camera in real time was developed and tested. Two algorithms were combined to classify and track moving fruits on image plane using representative color features. The method allows classifying the fruit by color segmentation and estimating its position on the image plane, which provides a reliable algorithm to be implemented in robotic manipulation of fruits. To evaluate the methodology an experimental real time system simulating a conveyor belt and real fruit was used. Testing of the system indicates that with natural lighting conditions and proper calibration of the system a minimum error of 2% in classification of fruits is feasible. The methodology allows for very simple implementation, and although operational results are promising, even higher accuracy may be possible if structured illumination is used.Keywords: fruit classification, color image feature, servo visual control, look-and-move. Introduction When it comes to fresh fruit automatic processing, real time methodologies to accomplish classification tasks are desirable to improve efficiency of fruit processing lines. Visual servo robotic manipulators are able to perform intelligent fruit manipulation based on image plane information in real time if suitable image processing algorithms are provided. Many visual servo control architectures and strategies have been analyzed and classified in the literature (Stavnitzy and Capson, 2000; Xiao and Todo, 2001; Gans et al. , 2003), with a mobile camera, either mounted on the effector or in a fixed position to get visual feedback from the workspace. Control strategies can be position-based if control input is defined in terms of absolute position; or image-based if control input is defined according to changes in position of image features on the image plane. The choice of particular servoing architecture relies on aspects such as the inherent geometry of the robotic task, reliability, accuracy, speed and cost. In many cases the motion of a target, for example an object on a conveyor, is most conveniently expressed in a Cartesian reference frame; therefore most systems dealing with moving objects have used position-based methods (Taylor and Kleeman, 2004; Deng et al. , 2005). One of the major applications of visual servo control for robotic manipulators in industry deals with grasping objects from a static or mobile surface, mainly to substitute manual labor in inspection, identification, selection or classification operations (Penman, 2001; Recce et al ., 1998). In applications such as processing lines for fruits and vegetable selection, a monocular static camera arrangement is the simplest and most economical implementation, configured to simultaneously image the target fruits and the effector. Color image processing has been used to develop methodologies to assess the maturity levels of fruits. There are discriminator methods based on neural perceptron networks (Leemans et al. , 2002) to overcome the fuzzy nature of the class membership identification. Generally, the approach is statistically based and uses a Bayesian type of discriminate analysis (Leemans et al. 2002; Blasco et al. 2003). When these methods make the conversion from red, green and blue (RGB) to hue, saturation and value (HSV) space and the classification functions are multivariable expressions. More computer processing time is required, which is undesirable for real time applications. In color segmentation of an image, the objective is to spatially separate regions based on similarities inside each region and differences among distinct regions. The way to undertake the segmentation of color varies from the empirical evaluation of various color spaces (Horiuchi, 2006), to modeling based on physical principles (Gheissari and Bab-Hadiashar, 2003). The primary difference between color segmentation and recognition is that the first utilizes color to separate objects without prior knowledge of the specific surfaces, while the second tries to recognize colors knowing the chromatic characteristics of the surface. Although the two problems are conceptually different; the results of the segmentation can be used in recognition. The concept of color indexing in recognition, implies the use of histograms to index objects in images (Berens et al. , 2000), trying to exploit color as a useful aspect for quick detection. Theoretical considerations Image to space transformation. Mapping from space to image was done according to proper geometrical modeling of the visual system. Geometric correspondence between space and image is illustrated in [Figure - 1], along with the camera calibration rig. A point P 0 in space on the calibration rig will be considered, characterised by the coordinate vector X c = [ x c y c z c ] T in the camera reference frame. The coordinate of P 0 with respect to the calibration rig is therefore X 0 =[ x 0 y 0 z 0 ] T . Once a spatial view geometry analysis is performed (Reyes and Chiang, 2003), the position of point P 0 in camera coordinate system can be written as:
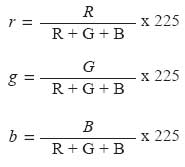
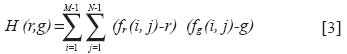
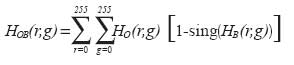
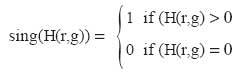
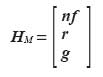
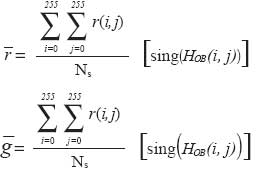
where: X c are coordinates of the space point in the camera frame; z c is the distance from the camera frame origin to the space point along the Z c axis; d r accounts for the radial distortion factor; K is the calibration matrix of the camera; X P are the projected coordinates of the point on the image plane and dx is the tangential distortion vector. Color feature learning. For a M×N color image with components ( R,G,B) , the chromaticity coordinates ( r,g,b ) are the normalized components, which are expressed as: where r + g + b = 255 , and color can be represented in the chromaticity diagram ( r,g ) (Vertan and Boujemaa, 2000). Given a M×N color image f characterised by the normalised color components f r and f g ; each term of the color distribution histogram matrix H (256× 256) can be expressed as: with d( f - c ) = 1 if f = c or f = 0 if f ¹ c . Since the ultimate goal is to recognize an object (effect or object) from the background; a differential histogram H OB between object histogram H O and background histogram H B can be evaluated. The H O histogram is evaluated using Eq.[3] from images of objects including its background, while the H B histogram is obtained by applying Eq. [3] to images of the background while it does not contain any object. Each term of the differential histogram HOB can then be written as: where: The differential color histogram eliminates the color similarities between the object and the background. In order to use the information contained in the differential histogram matrix of Eq. where: nf is a file vector containing the color non-zero frequencies in descending order of magnitude; r and g are file vectors containing the ( r , g ) pairs corresponding to each color frequency of the vector nf . The objective of this research was to develop a robust and simple methodology that combines color feature extraction algorithms for tracking and classifying fruits as they are moving on a processing line. The main objective was the development and testing of a dual task tracking-classifying algorithm that combines low computational burden with acceptable accuracy to be implemented in commercial fruit processing facilities. The new feature of the methodology is that it employs a single camera, dual-task algorithm suitable for real time applications introducing a new concept in RGB space called a main components matrix (MCM). Materials and Methods Camera calibration The images were captured using a charge coupled device (CCD) color webcam pixel view XC75B/465, (Philips, Lisboa, Portugal), with capture card and output image size of 640 480 pixels using the standard National Television System Committee (NTSC). The webcam was equipped with a 3.8 mm F 2.0 lens and a viewing angle of 39º. Images were processed with a personal computer (PC) Pentium-S/166 MHz and 64 MB in random access memory (RAM). A geometrical camera calibration procedure was applied to estimate a set of camera intrinsec and extrinsec parameters for mapping between three-dimensional (3-D) space and two-dimensional (2-D) image coordinates (Bouget, 1999). In order to carry out the calibration of the camera, the analytical approach described by Samtaney (1999) was selected as appropriate for the architecture of our simulated system. The procedure employs a minimum of three check board images, 640 480 pixels in size, taken at different orientations that are then processed with Matlab software (Bouget, 2001), to obtain intrinsec and extrinsec calibration parameters. In the present case, 12 calibration images of a check board with 15 15, 30 mm squares were used. An additional image calibration for the check board resting on the working plane was added in order to obtain the extrinsec parameters of the task surface, which it is necessary to determine the distance from the camera frame to any point on the working surface. Object recognition and position estimation A method for color feature extraction is proposed in order to recognize the class or type of object and determine its position in the image. The method involves two steps. In the first step, the goal is to locate any point belonging to the object. To do this, a matrix F ( M N ) of the same size of the image with zero valued elements is created. Once the image is acquired, color components ( r,g ) of each pixel are computed and compared against the first, or the first and the second columns of matrix MCM. When equality is found, F is set to one at the corresponding pixel position. The operation can be expressed as follows: The two highest frequencies of MCM used to recognize the object have to be determined as (r, g) averages of a sample of a group or universe of objects of a certain class in order to have a high probability of finding a pixel of the object image containing any of these two high frequency colors. Once the entire image is processed with the logical operation of Eq. [7], matrix F is searched for the column with maximum non-zero elements (ones) to locate the horizontal position of a pixel inside the object. The sum Sj of all row values for each column of F can be written as: therefore the horizontal position n x of the pixel pertaining to the object is equal to the j value such that S j is maximum in Eq. [8]: so that S j is maximum For the vertical positioning in the image, a search along the column n x is made until the first non-zero value (one) is found. The expression for the n y position of the point belonging to the object, is then: for first value of F ( i , n x ) ≠ 0 the second step involves a refinement of the first process, in order to locate the approximate center of area of the image projection of the object. Here more columns of MCM are considered to include the maximum number of chromatic components of the object and therefore the maximum number of image points pertaining to the object. The acceptable number of columns or selective color components from matrix MCM to be used in the recognition process will depend on the degree of accuracy desired with respect to the best estimation feasible. Experimentally it has been shown that at least five columns of MCM are required to obtain a good approximation of the center of area (Reyes, 2002), which means an error of about 2%. The final step employs the pixel position ( n x , n y ) inside the object image, located previously, as the center pixel of a processing window around the object. The window is selected as a 2 d 2 d square centered at ( n x ,n y ) [Figure - 2]. To estimate d in pixels, the previous image sampling of the largest size N T (in pixels) of a certain object class or type, was considered. Estimation of d can then be made as: [11] Eq. [11] assumes a circular projected object shape, but shape deviation is allowed by increasing the searching region by 20%. The origin of the window positioning ( n xo ,n yo ) is then: The chromaticity ( r,g ) of each pixel in the window is compared to the first five columns of the MCM. The respective coordinates ( n j ,n i ) of each pixel, with respect to the origin of the window position (upper left corner) are evaluated through the following numerical operation: where: i , j = 1, 2, 3........2 d . If K is the number of pixels where the pair ( n j ,n i ) in Eq. [13] is non-zero; and n jk ,n ik ( k = 1, 2, 3..... K ) are the corresponding coordinates, the approximate position of the center of area of the object projection is calculated as follows: the coordinates obtained in Eq. [14] corresponds to the components of the vector , which represents the distorted projection of the point on the image plane. Classification of fruits This methodology allows discrimination between objects from the same generic class, for example any fruit at some specific state of ripening. In order to implement an algorithm for the identification of objects by color features, a procedure is explored based on the chromatic data contents in the differential histogram defined in Eq. [4] and [5]. The differential histogram targets the segmentation of the object from the background (separation of the object and background pixels) hereby referred to as the Background Object Segmentation (BOS). First, we group objects according to chromatic similarity (degree of ripening in the case of fruits), by calculating the average ( , ) of the normalized chromaticity components r and g of each object in a group (fruits with the same degree of ripeness), by means of the expressions:
where N S is the number of pixels obtained from object segmentation. To estimate the average color representative of a given group (similar degree of ripening), the average of averages ( , ) within the group of n objects is evaluated:
The next step is to evaluate the longest Euclidean distance D M on the rg plane, between each of the n points ( , ) corresponding to an object of the group and the point ( ), which characterize the group: maximum where i = 1, 2,........ m and j = 1, 2, ......... n . The critical distances ( D M ) i for each group can be employed as a parameter for the classification of any object in one of the m possible groups. To select objects belonging to any of the m groups, we have m components ( ) that can be utilized to identify the ownership of each object. The proposed selection criterion involves evaluating the Euclidian distance ( d o ) i in the rg plane from the point ( , ) for each object to the reference point ( , ) of each one of the m groups:
where i = 1, 2, ........ m . To classify any object, the system has to determine which group i satisfies the following relationship:
On the other hand, to locate and track the object, it is also possible the estimation of the position of its center of area by processing the pixels obtained by means of the Eq. [4] and Eq. [14]. Fruit recognition Testing of the procedure was performed using four types of fruits: nectarine, orange, apple and kiwi. The background of the working surface was painted opaque black in order to enhance the discrimination of color features between the environment and fruits. Indirect natural daylight was used from a distant window and filtered by an existing shadowing curtain to avoid reflections caused by direct incident rays. Images of a group of twenty fruits of each type were taken along with an image of the plain background. From each fruit an image window was processed by removing the background pixels and replacing them with pixels of a black color, ( R,G,B ) = (0,0,0). Files of the modified windows were processed to get average normalized ( r,g ) histogram defined in Eq. [3]. At the same time, a normalized histogram of the background image was also quantified. The differential histogram of each fruit with respect to the background was evaluated by means of Eq. [4], followed by the MCM matrix defined in Eq. [6]. To locate the center of area of the fruit, a two step computer routine was implemented, where the first step included Eq. [7] to [10] and the second, Eq. [11] to[14]. These equations yield the two first columns of MCM matrix and the five first columns of MCM respectively. Experimental classification tests In order to test the procedure for fruit classification, oranges and apples with distinct color appearance were used. For each type of fruit, 50 fruits with acceptable commercial color were selected and isolated from other group of 50 fruits with deficient color appearance. This procedure was accomplished by using human vision, as is normally done in some manual classification operations. From each of these groups, 11 fruits were randomly grouped to extract color indexes. First the histogram of an image of the isolated background was evaluated, and then the histogram of a window around each fruit. The segmentation of each fruit was finally done by subtracting the average background histogram from the histogram pertaining to each fruit using Eq. [4]. For each of the oranges tested, the average of the normalized components ( , ) was evaluated according to Eq. [5]. The following step involved the estimation of the average of averages ( , ) for each group of similar ripening level, with Eq. [16]. Then the maximum permissible distance to this point for each group was determined, by means of the Eq. [17]. The averages ( , ) calculated for oranges and apples, along with the maximum permissible Euclidian distance D M of Eq. [17], were inserted into the algorithm used to test the methodology. Classification and tracking in real time Simulated and real tests were performed by means of a multi-thread computer code written in API Windows/C++ that incorporates the analytic formulation of the method described previously. An initial scanning window of 50 50 pixels was used along with the dual step MCM algorithm in order to first locate one pixel that belongs to the mobile fruit, and then to estimate its approximate center of area on the image plane. Once position on the image plane is evaluated, the BOS methodology to segment and classify fruit was applied. After object classification was accomplished, the instantaneous center of area was then employed as reference to position and translate a small tracking window of 30 30 pixels. The continuous evaluation of the center of area of a fruit inside the tracking window, along with the image to space transformation, was used to simulate the positioning of a virtual Selective Compliant Assembly Robot Arm (SCARA) manipulator in real time. Results and Discussion Fruit recognition The averages of five main color components of each type of fruit are shown in [Figure -3]. Output images in [Figure - 4] depict the center of area of four fruits (one at a time). In the left image, white crosses indicate the first pixel detected within a fruit. It is important to point out that when there were more than one occurrence (i.e., more than one unit of a type of fruit); the algorithm picked up the object located on the column where more pixels of highest color frequency were found (Eq. [7] to [10]). The right frame of [Figure - 4] illustrates the final output of the method, with white crosses indicating the estimated position of the center of area of every kind of fruit. Classification of fruits In [Figure - 5] an example of background-object segmentation (BOS) for an orange is illustrated, after applying Eqn [4]. The pixels painted in black are those identified as belonging to the object. The observed discontinuities are due to noise and color coincidences among the background and the object. For the purpose of the present analysis, only two regions were identified [Figure - 6]. The first corresponds to the fruits whose level of ripening is adequate to be accepted (good degree of ripening), while the second region includes those fruits that do not fit the color ripening condition and should be rejected. In this case the objective was testing the method and therefore only two regions were utilized. More generally, it is possible to establish a greater number of regions representing intermediate levels of ripening. The values ( , ) for both groups are shown as the center of circles forming each region [Figure - 6]. The radius of the circle indicates the maximum distance allowed for an object with components ( , ) to be considered as belonging to the group. Based on this analysis, many groups of fruits can be allocated or classified. Classification and tracking in real time A simulated sequence of the method while locating and classifying oranges is shown in [Figure - 7]. Note that the simulated position of the manipulator in the image plane is reproduced virtually using a look-and-move procedure to position the end effector. In the first frame, the border of the initial scanning window is depicted. The second frame shows a random instant captured, while in the third frame the scanning window is still working. In the fourth frame an orange has been classified and tracked with the smaller window. Numerical results of experimental tests carried out with the method are presented in [Table - 1]. Apples and oranges were visually classified and separated into ripened and unripened. In both cases 50 unripened fruits mixed with 50 ripened fruits were tested using two values of the classification parameter D M of Eq. (17) and (19) previously evaluated using each fruit group. Three repetitions of the test were performed with the same sample. The first value of D M for each type of fruit [Table - 1] is the value given by Eq. [17] and the second incorporates a 20% increase in D M in order to try to improve performance. Outcomes indicated an error fluctuating between 2.0% and 4.6% depending on the value of D M , and demonstrated that it is possible to get a proper adjustment of the value of D M for optimum response. Even thought it is possible to adjust the size of the tracking window; the velocity of the center of this window is determined by the sampling rate of the camera. For the trials carried out in this research, typical processing times of each image frame were around 50 to 60 ms, which is less than the speed permitted by the capture rate of our equipment at 66 ms per frame corresponding to 15 images per second. For a square window of 30 pixels, the tracking operation can be done at a maximum speed of about 450 pixels s -1 . This speed corresponds in spatial coordinates to a translation velocity of about 0.5 m s -1 , a magnitude that is consistent with the speed of conveying systems used in commercial classification lines for vegetables and fruits. Conclusions The methodology presented here uses a single color camera as the sensing device, along with an image to space tracking and classification procedure for fruits. The algorithm proved to be an efficient alternative in classifying and tracking mobile fruits using color feature extraction. The control architecture of a manipulator using the algorithm is beyond the scope of this research, therefore the tracking method was tested assuming a constant moving speed of the fruits. Additional work has to be done in order to evaluate in detail the dynamic behavior of a manipulator employing the methodology developed. Since the proposed methodology was tested under natural lighting conditions, uniform structured lighting may be necessary in order to check operating accuracy of the system. Even though an acceptable classification error was observed, considerable improvement of the proposed method may be achieved using artificial lighting. In summary, the significant and interesting aspect of this study comprise the deployment of conventional microcomputers and color cameras in devising new automated image-based methodologies to achieve the same objectives as more complex automated architectures. Acknowledgements The authors are grateful to the Comisión Nacional de Ciencia y Tecnología (CONICYT), and all the people of the Departamanto de Mecánica e Ingeniería Metalúrgica of Escuela de Ingeniería, Pontificia Universidad Católica de Chile, for their help to the research that supported this publication. Special thanks to Doctor Shahriar Negahdaripour for his excellent suggestions about the presentation of this document. Resumen Localización y clasificación de frutas móviles en tiempo real con una cámara individual a color. El control de calidad en frutas y hortalizas para satisfacer mercados cada vez mas exigentes, requiere la implementación de sistemas automáticos servo visuales en operaciones de de procesamiento de frutas para responder a estos desafíos de mercado. En está trabajo se desarrollo y evaluó un nuevo método para identificar y clasificar frutas en movimiento mediante el procesamiento en tiempo real imágenes a color capturadas por una cámara individual estática. Se combinaron dos algoritmos para clasificar y rastrear frutas en movimiento en el plano de imagen utilizando aspectos representativos de color. El método permite clasificar las frutas en base a segmentación de color y estimar su posición en el plano de imagen, lo cual proporciona un algoritmo confiable para ser implementado en un brazo robótico.de manipulación de frutas. Para evaluar la metodología se empleo un sistema experimental simulando una correa transportadora real de movimiento de frutas. La evaluación del sistema indico que en condiciones de iluminación natural es posible obtener un error mínimo de 2% en la efectividad de clasificación de frutas, con una calibración apropiada del sistema. El método es de implementación sencilla y aunque los resultados experimentales son promisorios se podría obtener una mayor precisión si se emplea luz estructurada. Palabras clave : clasificación de frutas, aspectos de color, control servo visual, mirar y mover. References
Copyright 2009 - Chilean Journal of Agricultural Research The following images related to this document are available:Photo images[cj09021t1.jpg] [cj09021f6.jpg] [cj09021f3.jpg] [cj09021f4.jpg] [cj09021f2.jpg] [cj09021f7.jpg] [cj09021f1.jpg] [cj09021f5.jpg] |
| |||||||||


 [15]
[15]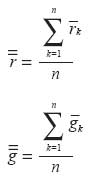 [16]
[16] 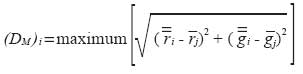 [17]
[17]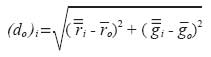 [18]
[18]![[Figure - 1]](/showimage?cj/photo/cj09021f1.jpg)
![[Figure - 2]](/showimage?cj/photo/cj09021f2.jpg)
![[Figure -3]](/showimage?cj/photo/cj09021f3.jpg)
![[Figure - 4]](/showimage?cj/photo/cj09021f4.jpg)
![[Figure - 5]](/showimage?cj/photo/cj09021f5.jpg)
![[Figure - 6]](/showimage?cj/photo/cj09021f6.jpg)
![[Figure - 7]](/showimage?cj/photo/cj09021f7.jpg)
![[Table - 1]](/showimage?cj/photo/cj09020t1.jpg)