 |
| About Bioline | All Journals | Testimonials | Membership | News |
|
||||||
|
||||||
Chilean Journal of Agricultural Research, Vol. 69, No. 3, July-Sept, 2009, pp. 366-372 RESEARCH Glycogen Determination in Bovine Muscle: A Proposal for Rapid Determination Determinación de glucógeno en músculo de bovinos. Una propuesta de medición rápida Antonio Hargreaves B.1*, Luis Barrales V.1, Daniela Barrales Z.1, José Luis Riveros F.1, and Iván Peña R.1 1 Pontificia Universidad Católica de Chile, Facultad de Agronomía e Ingeniería Forestal, Casilla 306-22, Santiago, Chile.*Corresponding author (ahargrea@uc.cl)(lbarrale@uc.cl) Received:
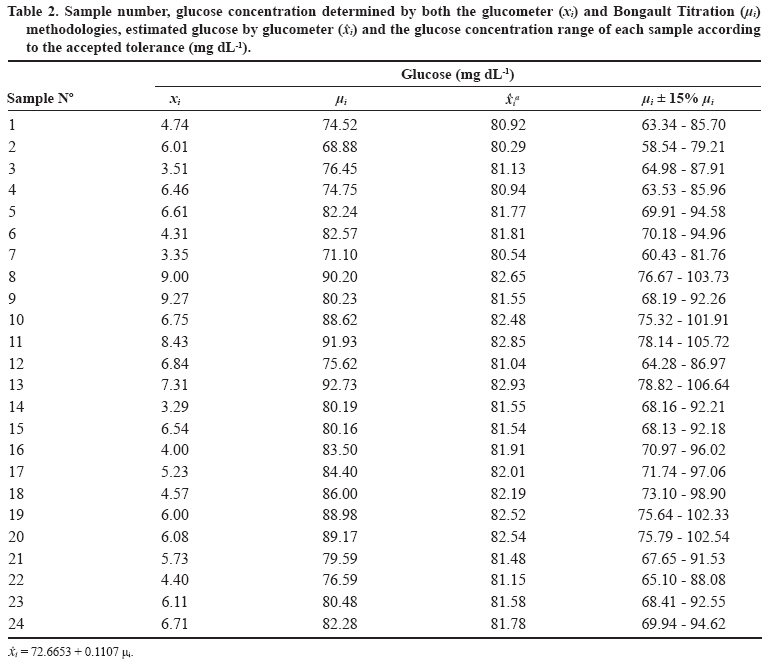
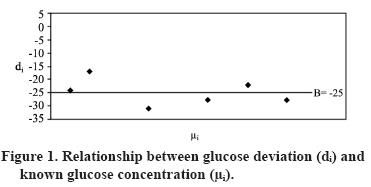
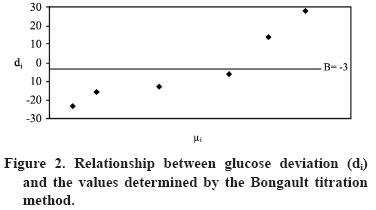
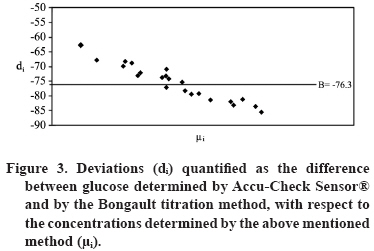
11 December 2007. Code Number: cj09044 ABSTRACT A practical, rapid and inexpensive method for muscle glucose determination is proposed. The method is based on acid digestion of the sample, followed by neutralization of the solution and the subsequent glucose determination using a domestic glucometer for human blood glucose level control. In a pre-experimental phase, the accuracy of this methodology and the titration method was determined, comparing results to pre-established glucose concentrations. There were significant differences between the glucose reading given by the glucometer and the pre-established glucose concentrations and the results given by the titration method. Nevertheless, when discrepancies (bias) were identified, differences resulted non-significant (P = 0.85). Subsequently, muscle glucose concentration (n = 24) was validated in the experimental phase and significant differences were shown between glucose concentration values given by the glucometer and the titration method, the latter considered as a standard method or as a reference (P < 0.0001). Once the sources of discrepancies were identified and removed, the differences observed between the values given by the two methods were not statistically significant (P = 0.99). It was concluded that the glucometer is a potential method for muscle glucose determination, but must be improved. Key words: muscle, glucose, glycogen, titration, glycolytic potential RESUMEN Se propuso un método práctico, rápido y de bajo costo, para determinar glucosa en músculo, basado en una digestión ácida de la muestra de músculo, seguida por una neutralización de la solución y posterior determinación de glucosa, utilizando un glucómetro doméstico, para el control de la glicemia sanguínea. En una etapa pre-experimental se determinó la exactitud de esta metodología respecto al método de titulación, comparando sus lecturas, con concentraciones conocidas de glucosa a través de la dócima de exactitud, resultando diferencias significativas entre las lecturas de glucosa, las concentraciones de glucosa conocidas y las entregadas por el método de titulación. Sin embargo, identificadas las causas de las discrepancias (sesgos), las diferencias resultaron no significativas (P = 0,84 y P = 0,86, para ambos casos, respectivamente). En la etapa experimental, se validaron las concentraciones de glucosa en músculo (n = 24), resultando valores diferentes entre concentraciones de glucosa y la obtenida por el método de titulación, considerado como método de referencia o estándar (P < 0,0001). Una vez identificada y removida la fuente de las discrepancias, los valores entregados por ambos métodos fueron similares (P = 0,99). Se concluyó que el glucómetro es un método potencial para la determinación de glucosa en músculo, más aún cuando se afine la técnica en relación al procesamiento de las muestras, tanto en la extracción de la glucosa desde el músculo, como en el método de comparación de los valores entregados por el glucómetro. Palabras clave: músculo, glucosa, glicógeno, potencial glucolítico. INTRODUCTION The glycolytic potential defines the energy reserve in muscles (Fernández et al., 1996; Wulf et al., 2002; Young et al., 2004a; 2004b), allowing the estimation of muscle glucose content in cattle before slaughter. There is a direct relationship between glycolytic potential and final pH (Wulf et al., 2002), so that if the glycolytic potential is known, final pH can be estimated. However, determination of the glycolytic potential is a complicated biochemical process and takes several days (Young et al., 2004a). A study cited by Young et al. (2004a) on glycolytic metabolites in semimembranosus muscle of 52 bovine carcasses 30 min after slaughter reached the conclusion that at any pH level, only glycogen and lactate are good indicators of final pH, given that the intermediaries of glycolisis are a minor group and do not greatly affect pH. This behavior is maintained even 1 h after slaughter of the animal (Young et al., 2004a). Glycogen concentration in muscle is highly variable and depends on numerous factors, such as the type of fiber that is predominant, the species, nutritional state and the level of stress of the animal in the period prior to slaughter (Lahucky et al., 1998; Immonen et al., 2000a; Hargreaves et al., 2004), and factors such as the transport distance and time, the time animals wait in pens (Gallo, 2003), the sex of the animal (Scanga et al., 1998) and genetics. There are also post-slaughter factors that influence final pH, such as the packaging and the freezing speed of the meat (Moreno Grande et al., 1999; Hargreaves et al., 2004). To this is added the intrinsic variability of the cattle (Wulf et al., 2002). In synthesis, it is a multifactorial situation that is difficult to predict. Studies by Schaefer et al. (1990) and Jones et al. (1992) have reported that animals treated with special diets, such as those high in grains, which increase the production of ruminal propionate, and with a treatment with electrolytes before slaughter, show a significant reduction in muscle glucose. These authors found that the glycogen value in muscle by itself is a good estimator of the final pH of the carcass, because of which it is not necessary to determine lactate concentration. The determination of glucose concentration in cattle blood is not representative of the quantity of muscle glucose. A study by Tadich et al. (2000), showed a significant increase (P < 0.05) in the concentration of blood glucose during and after transport, which was attributed to the gluconeogenesis produced by catecholamine and cortisol released as a response to stress. This glucose comes from the liver and not from skeletal muscle, given that the latter does not have the glucose 6-phosphatase enzymes that allow for exporting glucose to the blood flow. With a simple methodology, the measurement of glucose originating from muscle could be a good estimator of the quantity of muscle glucose. The objective of the present experiment was to evaluate the feasibility of using an instrument developed for measuring blood glucose to estimate concentration of muscle glucose. MATERIALS AND METHODS Sample collection Twenty-four samples of meat were obtained from the bovine slaughterhouse of Frigorífico Valledor, a company belonging to Automotriz Arica Sociedad Anónima (AASA). The samples were taken from the Longissimus dorsi (Immonen et al., 2000b), between the fourth and fifth lumbar vertebrae, approximately 20 min after slaughter and following bleeding and division of the carcass (Immonen et al., 2000a). The samples were cut into pieces with a scalpel, removing as much fat as possible. The pieces were then placed in test tubes, duly labeled and then immediately frozen in a tank with liquid nitrogen (-168 ºC) in accordance with techniques described in the literature (Apple et al., 1995; Fernandez et al., 1996; Gardner et al., 1999; Immonen et al., 2000b; Young et al., 2004a). The samples were kept at -18 ºC until processing. Samples processing The test tubes were broken to extract the samples. Each sample of frozen muscle was submitted to the following process: 0.5 g of frozen meat was weighed per test tube, avoiding the inclusion of any fat, and then placed in a 10 mL test tube that contained 2 mL of HCl 2 N. The sample was submerged in the acid with the aid of tweezers to ensure that all the muscle was exposed to the acid. The tubes were stopped with aluminum paper in which a small opening had been made. The samples were then submitted to acid digestion for 2 h at 85-90 ºC, dry boiled, to provoke digestion and denaturalization of the proteins and the conversion of glycogen into glucose (Adamo and Graham, 1998). Afterward, the samples were filtered and the test tubes changed to remove the denaturalized proteins from the bottom of the tubes and the fat floating on the surface of the solution. In this manner, a clean and homogenous solution was obtained. A glucometer was used that is normally employed for measuring and controlling blood glucose in humans (Accu-Check Sensor Comfort®, Roche). The glucose concentrations that the instrument can adequately read were determined in thepre-experimental phase. Subsequently, with the aid of micropipettes (from 1000 to 100 μL and from 200 to 20 μL), the samples were neutralized with NaOH 2 N (Adamo and Graham, 1998), reaching a pH of 7.0 to 7.3 (similar to blood pH). The volume applied was determined and the pH was measured (Digital pH-meter, Knick model, Germany), which had been calibrated previously with standard solutions of pH 7.0 and 4.0. At the same time, with the objective of mixing the NaOH with the solution, the tube was agitated each time the soda was added, using a circular agitator (Super-mixer, Lab-Line Instruments, Arthur Thomas, Philadelphia. Pennsylvania, USA). The samples were kept at 38 ºC before the glucose reading so that the temperature of the solution would be similar to that of blood. Determination of muscle glucose Determination of muscle glucose was done comparing two methods: the glucometer (Accu-Check Sensor Comfort®), which was the technique to be validated, and the Bongault titration method (Ribereau-Gayon and Peynaud, 1962; Fox and Whitesell, 2000; Skoog et al., 2001) considered as a standard. Reactive strips were used for the quantitative determination of glucose with the glucometer in the value range between 10 and 600 mg dL-1 (0.6 to33.3 mmol L-1). The glucometer cannot read the quantity of glucose outside this range and provides an error message, LO or HI (low and high, respectively). The test results were provided in 26 s after placing a drop with an approximate volume of 20 µL of previously digested and neutralized meat solution on a reactive strip (with the aid of a micropipette). The level of accuracy of the two techniques for measuring glucose was determined in the pre-experimental phase. Solutions with known glucose concentrations were used. The solutions were prepared following the same protocol that was used for the muscle samples (they were placed in a test tube with HCl and neutralized with NaOH). The glucose concentrations in the solutions were measured in duplicate using the titration and glucometer methods. In the experimental phase the accuracy of the glucometer in measuring muscle glucose was compared to that of the Bongault titration method. The determinations of muscle glucose (xi) in 24 meat cuts were made with the Accu-Check Sensor Comfort® glucometer and compared to the respective determinations made on the same meat using the standard Bongault titration method (mi). Statistical analysis An experimental design was not considered in the research, but rather an observational study. The level of accuracy of the glucometer was evaluated in both the pre-experimental and experimental phases using the chi-square accuracy test proposed by Freese (1960) and extended by Barrales et al. (2004). For the effect of this study it was considered acceptable that the glucose reading of the glucometer (Accu-Check Sensor Comfort®) was within 15% of the glucose measurement by the standard Bongault titration method, which was assumed as the true values of the glucose present in the meat, with a a = 0.05 level of significance. RESULTS AND DISCUSSION The known concentrations of the solutions in the pre-experimental phase, determined by the titration method and the glucometer, are presented in Table 1. The Bongault titration method systematically underestimated known and pre-established concentrations of glucose in solutions. However, these discrepancies were not statistically significant (χ2 = 6.02; P value = 0.42). Consequently, this method was considered to accurately measure the glucose levels of the solutions according to the imposed conditions. The glucose determinations by the glucometer also systematically underestimated the glucose values of the samples, but the discrepancies exceeded the limit with respect to the known concentrations (χ2= 75.68; P value < 0.0001) and also compared to the determinations obtained by the titration method (χ2 = 69.17; P value < 0.0001). The measurements of glucose levels in 24 samples of digested and neutralized meat made in the experimental phase using the two evaluated methods are presented in Table 2. A significant discrepancy can be observed between the glucose values determined by the two methods (χ2 = 7294.42; P value < 0.0001). The identification of bias in the measurements made with the glucometer in both the pre-experimental and experimental phases, as well as the adjustments made to the measurements by the glucometer and the incorporation of the bias in the procedures of the statistical test allowed for showing a relationship between the glucose measurements obtained by the two methods. The results of the pre-experimental phase (Table 1) indicated that, given the discrepancy observed in the glucose measurements made by the glucometer compared to the predefined glucose concentrations and the measurements provided by the titration method, this instrument would not be adequate for measuring glucose in a context other than that for which it was designed. This confirms what was reported by Young et al. (2004b) in that the glucometer tends to underestimate the real glucose value. The precision test (Freese 1960), on which the preceding assertion is based, rejects a measurement technique for being inexact, independent of the source of the inaccuracy (bias, lack of precision, or both). However, this author indicates that some measurement techniques can provide a high degree of accuracy if the potential bias in their measurements can be removed. The study of the origin of the discrepancy (inaccuracy) between the glucose measurements by the glucometer and the predefined glucose concentrations determined the presence of a constant bias in the measurements of this instrument, the values of which was -25 (Figure 1). This value, added in absolute terms to the glucose values provided by the glucometer, gives the glucose concentration estimated by the instrument and corrected by the bias of the same. The precision test that considered this bias (Barrales et al., 2004) showed that the glucose determinations by the glucometer did not differ statistically from the predefined glucose concentrations in the solutions (χ2 = 1.99; P value = 0.85). Based on this result, it was concluded that the glucomter measures glucose in solutions with accuracy, once its determinations are corrected for the presence of bias in the measurements. Subsequently, the accuracy of the glucose measurements of the glucometer was validated in comparison to the determinations obtained by the titration method. Based on the methodology of Freese (1960), and considering the same previously imposed conditions, in terms of the accepted magnitude of discrepancy between the two techniques and the level of significance, it was determined that the differences observed between the two methods differed significantly (χ2 = 69.17; P value < 0.0001). In studying the cause of the inaccuracy, we determined that the differences between the measurements of the two methods varied from positive to negative for high and low glucose concentrations, respectively (Figure 2), which indicated the presence of a variable bias in the measurements made by the glucometer. Upon correcting these measurements for the variable bias or equivalently incorporating the bias into the test (Barrales et al., 2004), it was observed that the glucose concentrations determined by the glucometer did not differ statistically from the glucose measurements determined by the titration method (χ2 = 1.34; P value = 0.85). From the results of the pre-experimental phase, we can conclude that the glucometer is adequate for determining glucose in a context other than that which it was created for, providing the source of inaccuracy (bias) is eliminated from its measurements. Considering the results of the pre-experimental phase in terms of the potential of the glucometer to determine glucose, its capacity to measure glucose in meat was studied in the experimental phase. The glucose determinations by the glucometer showed a significant underestimation (P value < 0.0001) (Table 2) compared to the determinations obtained by the titration method (mi). To study the origin of the discrepancy the differences observed from the readings from these methods and the glucose concentrations measured by the Bongault titration method were graphed in a coordinate plan (Figure 3). A constant bias of a magnitude of -75.8 and a variable bias were identified based on the distribution of graphed points, which has a negative linear tendency. The glucose concentrations determined by the glucometer were corrected by the constant bias and the variable bias was also eliminated through regression analysis (Freese, 1960). The glucose values We concluded that the glucometer is a potential method for measuring glucose content in meat. However, to reduce bias in the determinations, the preparation of the samples requires modifications or corrections so that the use of this instrument determines the glucose concentration present in the analyzed meat. To adjust the glucose measurement technique and make it more exact in terms of the glucose value provided, it is necessary to improve some aspects of the procedure, which is detailed below. Proposed modifications for obtaining samples An important factor is to obtain samples of muscle with the least possible quantity of blood, connective tissue and fat, given that these can affect the results with an underestimation of the quantity of glucose (Immonen et al., 2000b; Young et al., 2004b). Correction is possible through homogenizing the sample, improving the muscle digestion procedure, filtering the sample and neutralizing the solution. Homogenization of the sample: The objective of this procedure is to destroy or break the cells to facilitate the release of glucose in the acid solution after digestion. The use of a homogenizer is recommended, such as that used by Young et al. (2004a; 2004b) or that used by Immonen et al. (2000a; 2004b), or, in the absence of these, an instrument that breaks the sample into small pieces, taking advantage of the crystallized state of the meat owing to the use of liquid nitrogen. Another important aspect to consider before submitting the sample to digestion is to weigh the tube with the meat solution and HCI in order to correct the error afterward because of volume loss in the phases of the glucose determination process. Muscle digestion: We propose to improve the procedure of digestion of the meat carried out and proposed by Adamo and Graham (1998) through the study of different concentrations of HCl and digestion time to determine the maximum quantity of glucose released in the least time, and at a determined concentration, while maintaining a constant temperature. In this way, a faster and more efficient procedure can be achieved. An additional alternative is to use enzymatic digestion, which requires less time and is easier to apply than acid digestion, resulting in the same glucose values according to Passonneau and Lauderdale (1974). As well, we recommend replacing aluminum paper with glass stoppers for the test tubes to avoid the evaporation of the acid and to reduce volume loss. Filtering the samples: Three methods were proposed in order to improve filtering the samples to extract the maximum protein from the solution. First, to cool the tube for 30 min in ice before filtering, so that the extraction of the phase that contains the glucose is more efficient; subsequently, we recommend using a Pasteur pipette to remove the intermediate phase from the tube and the extracted weight in order to then make the correction for the corresponding volume. Second, to centrifuge the sample. Finally, the proteins can be precipitated with perchloric acid (Wulf et al., 2002), and based on the result of this the quantity of glucose can be determined without the proteins interfering with the reading. Neutralization of the solution: Upon reaching neutral pH of the solution with NaOH, a phosphate buffer is recommended to stabilize pH at a neutral value without affecting the glucometer reading. CONCLUSIONS The proposed technique for determining muscle glucose using the glucometer is potentially viable, has a low cost and is easy to carry out. However, it is necessary to improve some critical points for more accuracy, such as the extraction of glucose from the muscle and the stabilization of the pH form the solution. This would avoid variations in readings of the glucometer, and reduce the magnitude of bias. We recommend the use of other methodologies in future research to evaluate the glucometer, with a lower percentage of error, such as spectophotometry at 340 nm, given that it is more precise than the titration method. Alternatively, for an exact glucose determination, the iodine method is recommended (Dreiling et al., 1987). LITERATURE CITED
Copyright 2009 - Chilean Journal of Agricultural Research The following images related to this document are available:Photo images[cj09044f2.jpg] [cj09044t1.jpg] [cj09044f3.jpg] [cj09044t2.jpg] [cj09044f1.jpg] |
| |||||||||
