 |
| About Bioline | All Journals | Testimonials | Membership | News |
|
||||||
|
||||||
Chilean Journal of Agricultural Research, Vol. 69, No. 3, July-Sept, 2009, pp. 400-405 RESEARCH Algorithms of Expert Classification Applied in Quickbird Satellite Images for Land Use Mapping Algoritmos de Clasificación Experta Aplicados en Imágenes Satelitales Quickbird para el Mapeo de la Cobertura de la Tierra. Alberto Jesús Perea1*, José Emilio Meroño1, and María Jesús Aguilera1 1 Universidad de Córdoba, Escuela Técnica Superior de Ingenieros Agrónomos y de Montes, Edificio Paraninfo-Campus de Rabanales, Córdoba, España. *Corresponding author (g12pemoa@uco.es). Received: 12
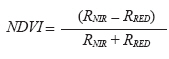
May 2008 Code Number: cj09048 ABSTRACT The objective of this paper was the development of a methodology for the classification of digital aerial images, which, with the aid of object-based classification and the Normalized Difference Vegetation Index (NDVI), can quantify agricultural areas, by using algorithms of expert classification, with the aim of improving the final results of thematic classifications. QuickBird satellite images and data of 2532 plots in Hinojosa del Duque, Spain, were used to validate the different classifications, obtaining an overall classification accuracy of 91.9% and an excellent Kappa statistic (87.6%) for the algorithm of expert classification. Key words: expert classification, vegetation index, land cover, object-based classification RESUMEN El objetivo del presente trabajo fue poner a punto una metodología de clasificación de imágenes de satélite, que auxiliada por la clasificación orientada a objetos y el índice de vegetación de diferencia normalizada (normalized difference vegetation index, NDVI), permita cuantificar las áreas agrícolas de la región utilizando algoritmos de clasificación experta, con vistas a mejorar los resultados finales de las clasificaciones temáticas. Se utilizaron imágenes satelitales Quickbird y datos de 2532 parcelas en Hinojosa del Duque, España, para validar las clasificaciones, consiguiendo una precisión total del 91,9% y un excelente estadístico Kappa (87,6%) para el algoritmo de clasificación experta. Palabras clave: clasificación experta, índice de vegetación, cobertura de tierra, clasificación orientada a objetos. INTRODUCTION The digital classification of images is the process in which pixels with similar spectral characteristics, and therefore assumed to belong to the same class, are identified and assigned a color (Gibson and Power, 2000). In the high resolution images from satellites, such as Ikonos and QuickBird, each pixel no longer refers to a complete object, character or area, but rather to a portion of the components of these, which means that classic techniques of classification based on pixels present some limitations (Wilkinson et al., 1991): (1) the spectral information contained in pixels is not sufficient in the majority of cases, such as to identify vegetation species or the types of surface cover; and (2) normally pixels include a radiometric mixture from their neighbors and consequently few zones have total homogeneity. In the area of the digital treatment of images, there is currently great interest in the development of new classification algorithms (Ayala and Menenti, 2002). The combination of spectral data with other sources of auxiliary data allows for the use of more information that can improve classifications (Abkar et al., 2000). Expert systems consider the use of data other than spectral characteristics in order to improve the results of classification (Lidov et al., 2000). The use of auxiliary information to increase the accuracy of digital classification involves combining an existing knowledge base with information extracted from images (Trotter, 1991). To improve automatic classification procedures, it is necessary to introduce a set of parameters to inform the classification beyond the digital values of the pixels (Heyman, 2003). As well, with the use of auxiliary data, we can correct the initial results of the procedures through knowledge-based rules (Wicks et al., 2002). Johnsson (1994) showed that the accuracy of spectral classifications can be improved by segmenting the images in function of their spatial characteristics. Stefanov et al. (2001) developed a system of expert classification with the main objective of reclassifying the initial classification of maximum probability of urban zones and thus reduce errors of omission and commission. As well, the results of highlighting images using vegetation indices or other advanced classifiers, such as object-oriented classifiers, can be incorporated into expert classifiers. The main objective of this work was to design and train an expert classification algorithm to classify a QuickBird satellite image of Hinojosa del Duque, Cordoba Province, Spain, obtained in April 2005, putting special interest in discriminating agricultural crops. The confusions that appeared in the different land uses were evaluated and the results obtained in the object-oriented classification were incorporated into the algorithm to study their effect in improving the classification compared to traditional techniques. MATERIALS AND METHODS The area of study was located in Cordoba Province, Spain, in Pedroches Valley and includes the municipality of Hinojosa del Duque (38º33’ and 38º23’ N; 5º16’ and 5º50’ W). This is a rectangular area of 16 x 20 km and covers 32000 ha. Six multispectral images were used (QuickBird, Ortho Ready Standard Imagery, Digital Globe, Longmont, Colorado, USA), in UTM coordinates (Universal Transverse Mercator) and georeferenced in the WGS84 system. These images were ortorrectified and referred to the European Datum 1950 of the International Ellipsoid. The images were codified in 16 bits with a resolution of 2.4 m and were composed of four bands (blue, green, red and near infrared). The images were taken on 21 April 2005, beginning at 11:22, with a solar elevation angle of 62.9º. To develop this work, information was used from field visits by the Public Enterprise for Agricultural Development. The uses of the land were: bare soil; cereal: corn (Zea mays L.), oats (Avena sativa L.), rye (Secale cereale L.), wheat (Triticum aestivum L.), barley (Hordeum vulgare L.); removed cover; high protein crops: peas (Pisum sativum L.), beans (Vicia faba L.); alfalfa (Medicago sativa L.), woodlands/scrublands: holly oak (Quercus ilex L.), common retama (Retama sphaerocarpa [L.] Boiss.); constructed surfaces; olive (Olea europaea L.). The ERDAS Imagine 9.0 software (Leica Geosystems Geospatial Imaging, Norcross, Georgia, USA) was used to carry out the supervised classifications and the expert classification algorithm. In the case of object-oriented classification, eCognition Professional 5.0 software (Definiens, München, Germany) was used. The process began with the radiometric correction of the images. Following this treatment, the principle components and normalized difference vegetation index (NDVI) were calculated. Subsequently, images were obtained with the combination of desired bands and the different types of classification were made. Finally, the results of these classifications were validated. Radiometric corrections of QuickBird images Radiometric corrections modify the original digital levels to assimilate them to values that will present the image in the case of ideal reception. QuickBird images already have a series of radiometric corrections that the distributing company applies to its commercial products. The main corrections in the images are: restoration of lost pixels from the image or the possible loss or addition to the image. A transformation of the digital levels at radiance values in the atmospheric ceiling was made and a reflectivity image was obtained. The conversion to the spectral radiance of the atmospheric ceiling can be done simply in two steps: the value of the corrected pixels is multiplied by the appropriate absolute calibration factor and the result is divided by the effective bandwidth to obtain spectral radiance. The radiometric calibration factor is included in the metadata files of the image. Obtaining the principle components The objective of principle component analysis (PCA) is to summarize a wide group of variables in a new and smaller set without losing a significant part of the original information (Chuvieco, 2000). For the final user of distance imaging products, the objective of PCA is to construct images with an increased capacity to differentiate types of cover. Obtaining the NDVI index Vegetation has very characteristic spectral behavior, with high absorption of red wavelengths and high reflectivity in the near infrared. The NDVI index was obtained with the objective of highlighting the different spectral behaviors of each type of ground cover. The reflectivity image was obtained by calculating this index following a study of the influence of the calculation of apparent reflectance as a reference in obtaining the green vegetation index (NDVI) and its cartographic expression (Marini, 2006), which showed a positive effect. This index is based on the difference between the maximum absorption in the red (690 nm), owing to chlorophyll pigments, and the maximum reflection in the near infrared (800 nm), owing to the cellular structure of leaves (Haboudane et al., 2004). Using narrow hyperspectral bands, this index is quantified according to the following equation:
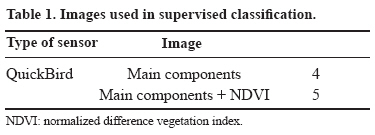
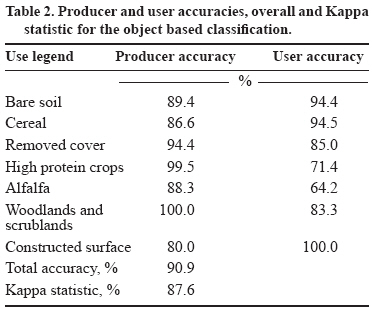
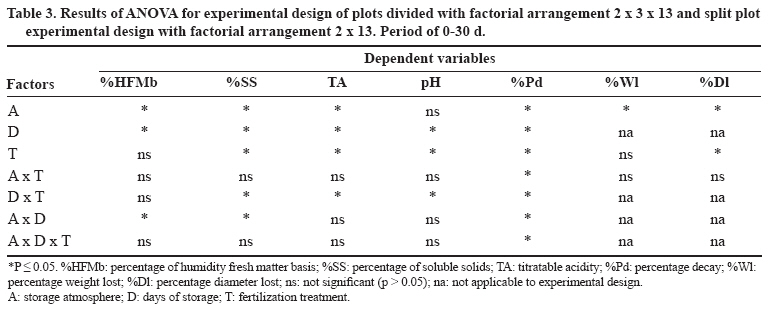
where RNIR and RRED, are reflectance in the near infrared band (R800 nm) and the red band (R690 nm), respectively. Supervised classification A series of images was obtained based on the different combinations of bands (Table 1). A supervised classification was made on all of these images. The Bayesian Classifier of Maximum Probability was used to classify the image. This algorithm is the most exact of the classifiers in the ERDAS Imagine 9.0 system because it takes into consideration the largest number of parameters for its analysis and because of the variability of the classes using a covariance matrix. Classification oriented to objects The particularity of this type of analysis is that the classification is based on objects rather than pixels. Once the image is formed by pixels, the first step in object-oriented analysis is grouping the adjacent pixels through the region growing method to subsequently classify the extracted objects. In this way the number of parameter that can be valued is increased significantly, allowing for consideration of criteria such as size, shape, mean color, maximums and minimum, proximity to other objects, texture, etc. At the same time, segmentation reduces the number of objects to be classified, which also reduces the processing time. The stopping criterion in the process of merging the regions is produced thanks to the parameter termed “scale” and can be defined by the user. It determines the maximum permitted in the global heterogeneity of the segments. The larger the parameters of scale for a database, the larger are the objects of the image. Given that the parameter of scale can be modified, we can obtain different types of segmented images. Thus, the objects generated in a broader segmentation inherit information from smaller objects with finer parameters of scale. Subsequently, the classifications are trained using different training parcels and are validated using the same validation parcels used in the previous classifications. Finally, for the best results obtained in the segmentation process, the spatial and spectral characteristics are considered, as well as groups of pixels that define relatively homogenous areas. The “Multiresolution Segmentation” option was used, which automatically extracts homogenous objects. The number of objects to be created was 200, which is a parameter related to image resolution, the working scale and the heterogeneity of the data. The program takes into account three criteria for segmentation: color, homogeneity and compactability. Color is the most important and has the greatest effect in defining objects in the majority of cases. The color criteria take into account the percentage of spectral homogeneity. However, shape and homogeneity are also important in extracting objects. The segmentation criteria of the image bands were 0.9 for color and 0.1 for shape, and under shape 0.5 was considered for “homogeneity” and 0.5 for “compactability”. The nearest neighbor algorithm was used for the classification: some samples were chosen (training area) for each of the classes. The rest of the scene is classified in accordance to this. This is a very rapid and simple method, adequate when the classification of an object requires many bands/criteria. As well, it takes into account different parameters related to the objects (area, longitude, mean color, brightness, and texture). Expert classification algorithm The expert classification algorithm used in this work consisted of assigning the classes that make up the legend based on the area of coincidence among different types of images that had been classified previously. To do this, the following information was necessary: an image created based on field visit and the map of land use and vegetal cover for Andalucía for 2004 were used as true terrain. The ERDAS Imagine 9.0 system and the supervised classifications obtained from based on the image formed by the principle components and the image formed by the principle components + NDVI, as well as the object-oriented classification. This algorithm was designed with the following decision-making criteria or rules: (1) when the pixels of each class of the classified image of the principle components + NDVI coincide with the image classified from principle components, they will be assigned to this class, (2) the other pixels where there is no coincidence belong to the which they are assigned by the object-oriented classification. To evaluate the quality of classifications, a total of 75,000 verification points were taken (approximately 2% of the area) for those that provide both real cover (true terrain) and those obtained by classification. RESULTS AND DISCUSSION Results of the object-oriented classification The result obtained from the segmentation were a new image that divided the original image into 9481 regions, such that the pixels included in each region are very similar among themselves and different from those from neighboring regions. With regard to the goodness-of-fit analysis of the classification that is shown in Table 2, the confusions that were observed between high protein crops and alfalfa give lower user accuracy than the other classes (64.2%). On the other hand, the producer accuracy was very high, with 88.3%, which indicates that 8.83 of every 10 pixels belonging to this cover were assigned correctly to the classification. As possible causes for this confusion of alfalfa, above all with high protein crops, is the incorrect delimiting of the training areas for the heterogeneity of the species throughout the image. Nevertheless, the level of confusion is not very high, in the majority of cases user and producer accuracy being 80%. As is normal, a class that is so easily discernable as constructed surfaces presents an accuracy of 100%. Consequently, the total accuracy of the classification obtained is very high, situated at 90.9%. Finally, the Kappa statistic also indicates a good classification, presenting a value of 87.6%. Results of the expert classification algorithm The methodology presented for the quantification of the agricultural areas of the studied region offered significant improvements in the results of thematic classification compared to the purely spectral classifications in which the image formed by the principle components and the NDVI index was used. The results presented in Table 3 show the feasibility of the methodology employed in the designation of the expert classification algorithm, having improved the user and producer accuracy with all the classes except woodlands and scrublands and with alfalfa in comparison to purely spectral classifications. The category woodlands and scrublands presents a user accuracy of 86.6% owing to the similarity of the spectral response to the category removed cover. The category alfalfa presents confusion with the category high protein crops for aforementioned reasons. The levels of error for the remaining classes were relatively low in the test phase, which indicates a good capacity of generalization of the expert system. The highest reached for user accuracy was for removed cover with 100%, while the lowest value was for alfalfa with 67.7%. In terms of the producer accuracy, the categories of woodlands and scrublands and high protein crops reached a value of 100%, while the category removed cover presented the lowest value with 72.7% owing to the spectral similarity to woodlands and scrublands. The Kappa coefficient had a value of 87.6% and total accuracy was 91.9%. The accuracy values obtained with the object-oriented classification and with the expert classification algorithm were similar to and/or higher than the values obtained by other authors, which shows that the methodology is adequate for the classification of land uses. In the province of Milan, Italy, Marchesi et al. (2006) carried out a classification oriented to objects in QuickBird images of the following categories: vegetation in urban areas, sports infrastructures, highways and water, obtaining a total accuracy of 83% and a Kappa statistic of 79%. These values are lower than those obtained in the object oriented classification of this work. In northern California, Yu et al. (2006) obtained a total accuracy of 60% in an object-oriented classification of digital aerial images captured by the Digital Airborne Imaging System in which a total of 52 vegetal uses were classified. This article also showed some results lower than those obtained in the present work, although it should be noted that a larger number of uses was classified. In southern Mexico, Mas (2005) made a classification using expert classification of the following categories: jungle, mangrove swamp, agricultural crops, water and urban areas. A single image was employed, which included five bands of the Landsat Enhanced Thematic Mapper (ETM), obtaining a total precision of 67%. Aitkenhead and Wright (2004) classified urban areas, crops and bare soil using neuronal networks in Landsat Thematic Mapper (TM) images and obtained 60% of accuracy for urban areas, 100% for water and forests, 90% for bare soil and 95% for agricultural crops. Triñanes et al. (1994) in Pontevedra, Spain, classified dense urban zones, non-dense urban zones, scrublands-grassland, water, forest and non-forest vegetal zones, using neuronal networks in images from the TM sensor of Landsat-5, obtaining an accuracy of 91.32%. This percentage is lower than that obtained with the expert classification developed in this work. CONCLUSIONS The statistical results show the validity of the methodology employed to design the expert classification algorithm. A total accuracy of 91.9% and an excellent Kappa statistic (87.6%) were obtained with this algorithm. The producer accuracy and user accuracy have been improved in all the classes except in woodlands and scrublands and alfalfa. This algorithm will facilitate updating the databases of agricultural crops, thus reducing the need for field visits. In relation to object-oriented classification, it has been shown to be of great help in isolating classes that are confused with others that have similar spectral responses (high protein crops and alfalfa). ACKNOWLEDGEMENTS This work was possible thanks to the images and field information provided by the Fondo Andaluz de Garantía Agraria (FAGA) through the public enterprise for Agricultural and Fisheries Development (DAP), Spain. We also thank Carmen Andú for her important collaboration. LITERATURE CITED
Copyright 2009 - Chilean Journal of Agricultural Research The following images related to this document are available:Photo images[cj09048t1.jpg] [cj09048t3.jpg] [cj09048t2.jpg] |
| |||||||||
