 |
| About Bioline | All Journals | Testimonials | Membership | News |
|
||||||
|
||||||
Chilean Journal of Agricultural Research, Vol. 69, No. 4, Oct-Dec, 2009, pp. 560-566 Prediction of the nutritive value of pasture silage by near infrared spectroscopy (NIRS) Predicción del valor nutritivo de ensilaje de pasturas mediante espectrofotometría en el infrarrojo cercano (NIRS). Ernesto A. Restaino[1], Enrique G. Fernández1, Alejandro La Manna1, and Daniel Cozzolino2* [1]Instituto Nacional de Investigación Agropecuaria INIA La Estanzuela, Estación Experimental Alberto Boerger, Ruta 50, km 12, Colonia, Uruguay. Received: 11
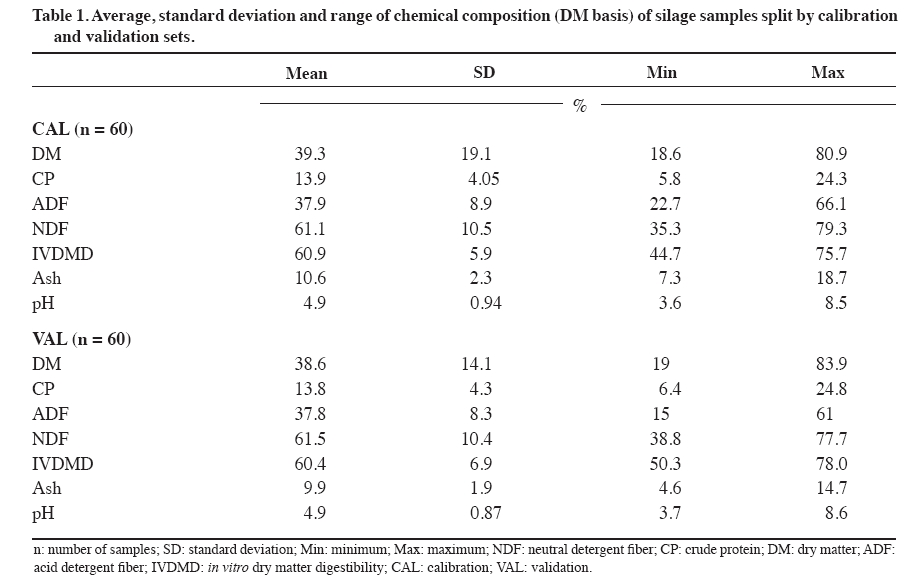
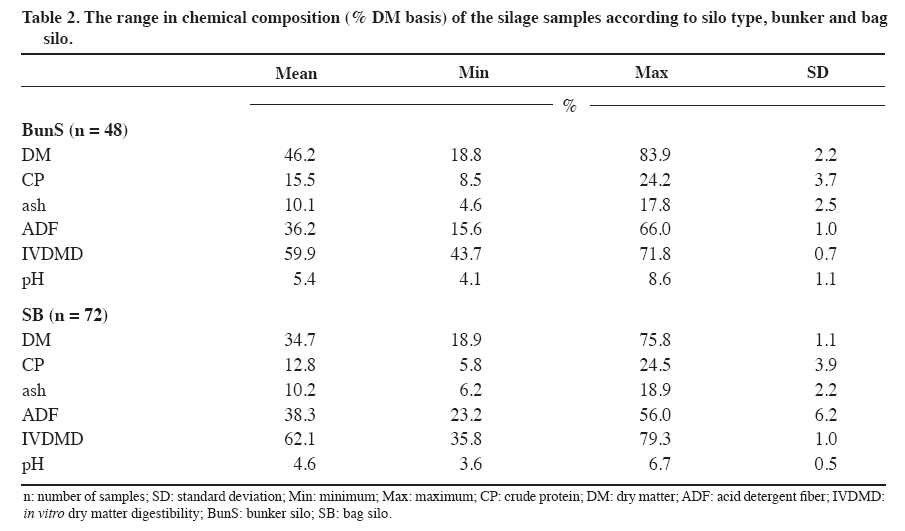
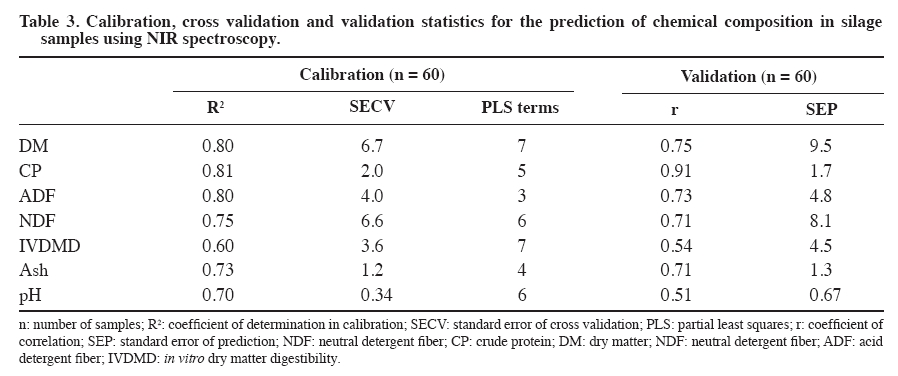
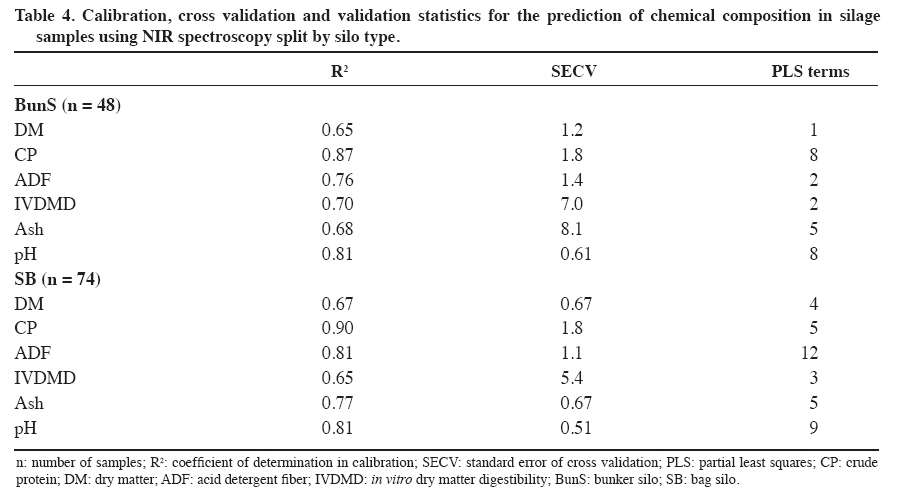
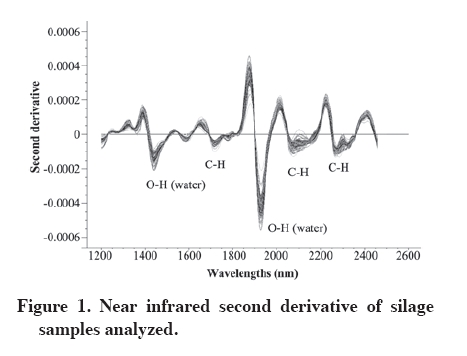
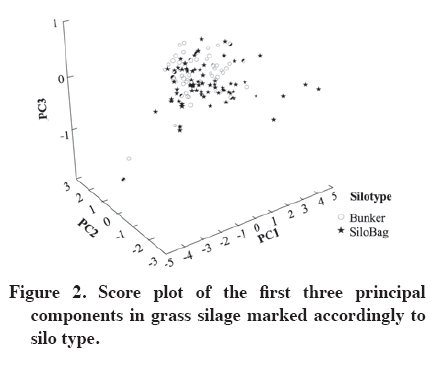
June 2008. Code Number: cj09067 ABSTRACT The aim of this study was to investigate the use of near infrared reflectance (NIRS) spectroscopy to predict the nutritive value of silages from pastures and to assess the effect of silage structure type (e.g. bunker and bag silos) on the NIRS predictions. Samples (n = 120) were sourced from commercial farms and analyzed in a NIRS monochromator instrument (NIR Systems, Silver Spring, Maryland, USA) using wavelengths between 400 and 2500 nm in reflectance. Calibration models were developed between chemical and NIRS spectral data using partial least squares (PLS) regression. The coefficients of determination in calibration (R2) and the standard error in cross validation (SECV) were 0.73 (SECV: 1.2%), 0.81 (SECV: 2.0%), 0.75 (SECV: 6.6%), 0.80 (SECV: 6.7%), 0.80 (SECV: 4.0%), 0.60 (SECV: 3.6%) and 0.70 (SECV: 0.34) for ash, crude protein (CP), neutral detergent fiber (NDF), dry matter (DM), acid detergent fiber (ADF), in vitro dry matter digestibility (IVDMD) and pH, respectively. The results showed the potential of NIRS to analyze DM, ADF and CP in silage samples from pastures. Keywords: silage, nutritive value, near infrared reflectance spectroscopy, pastures. RESUMEN El objetivo de este trabajo fue investigar el uso de la espectrofotometría de reflectancia en el infrarrojo cercano (NIRS) para predecir el valor nutritivo en ensilaje de pasturas y evaluar el tipo de estructura de silo (silo bolsa y trinchera) en las predicciones NIRS. Muestras (n = 120) provenientes de granjas comerciales fueron leídas en un equipo monocromador NIRS (NIR Systems, Silver Spring, Maryland, USA) en el rango de longitudes de onda de 400 a 2500 nm, en reflectancia. Modelos de calibración entre los datos químicos y los espectros NIRS fueron desarrollados usando el método de los cuadrados mínimos parciales. Los coeficientes de determinación en calibración (R2) y el error estándar de la validación cruzada (SEVC) fueron 0,73 (SECV: 1,2%), 0,81 (SECV: 2,0%), 0,75 (SECV: 6,6%), 0,80 (SECV: 6,7%), 0,80 (SECV: 4,0%), 0,60 (SECV: 3,6%) and 0,70 (SECV: 0,34) para cenizas, proteína cruda (PC), fibra detergente neutro (FDN), materia seca (MS), fibra detergente ácido (FDA), digestibilidad in vitro de la materia seca (DIVMS) y pH, respectivamente. Los resultados demuestran el potencial de la técnica NIRS para el análisis de rutina en ensilaje de pasturas para MS, FDA, y PC. Palabras clave: ensilaje, valor nutritivo, espectrofotometría de reflectancia en el infrarrojo cercano, pasturas. INTRODUCTION Ensiled forages are chemical, physical and biologically complex materials, spanning a wide range in composition and nutritive value. This variability arises from differences in the plant species, stage of maturity at harvest, fertilizer application, climatic conditions, harvesting technique and method of ensiling (Park et al., 1999). Laboratory methods have been developed and refined to provide nutrient and feed quality information about feedstuffs to the industry, farmers and researchers, however, they are expensive and time-consuming (Alomar and Fuchslocher, 1998; Givens and Deaville, 1999; Deaville and Flinn, 2000). Since the late 1980s, near infrared reflectance (NIR) spectroscopy has been examined as a non-destructive method for the determination of chemical composition in all fields of food science and agriculture (Givens and Deaville, 1999). NIR spectroscopy has an important role in reducing cost, time and amount of sample required for testing, together with an increase in the number of samples that might be analyzed. This technique requires consistent sample handling and a calibration method based in multivariate analysis, which converts spectral (NIR absorption) into laboratory reference method information (Alomar and Fuchslocher, 1998; Alomar et al., 1999; Deaville and Flinn, 2000; Cozzolino et al., 2000; 2003; Roberts et al., 2004). Calibration is the key to successful use of the NIRS technique and there are a number of essential steps required to develop a calibration including sample selection, acquisition of spectra and reference data, pre-treatment of spectral data, derivation of the regression model and validation of the model. However, both the processing of the sample (e.g. grinding, drying) and presentation of the sample to the instrument are important factors in the robustness and accuracy of NIRS as analytical techniques (Deaville and Flinn, 2000; Cozzolino et al., 2000; 2003; Roberts et al., 2004; Murray and Cowe, 2004). Although NIRS is extensively used to measure chemical properties in a wide range of agricultural commodities around the world, this is not the case in South America, mainly due to the lack of knowledge about the technology and the high cost of the instruments and software. The aim of this study was to investigate the use of near infrared reflectance (NIR) spectroscopy to predict the nutritive value of silages from pastures and to assess the effect of silage structure type (silo bag and bunker) on the NIR predictions. MATERIALS AND METHODS Silage samples (n = 120) were collected from commercial farms between 1999 and 2002, representing most of commercial systems of production in Uruguay, where different plant species were used for ensiling (e.g. pure legumes, pure grasses, mixtures of grasses and legumes). The main plant species used were Lotus spp.; Fescue spp., Ryegrass spp., Lucerne, and in mixtures of grasses and legumes that varies from 100% pure grass to 100% pure legume. Samples were also split by silo type structures, namely bunker (BunS) or bag (SB) silo. All samples were collected directly from the farms, placed in plastic bags, frozen (-20 °C) and delivered immediately to the laboratory for chemical and NIRS analysis. Samples were oven dried at 60 ºC for 48 h and ground in a Wiley forage mill (Arthur H. Thomas, Philadelphia, Pennsylvania, USA) to pass a 1 mm screen. Nitrogen (N) was determined on the dried samples using a semi-micro automated Kjeldahl method (Tecator, Högänas, Sweden) and converted to crude protein (CP = N x 6.25) (method 2.057; AOAC, 1984). Acid detergent fiber (ADF) and neutral detergent fiber (NDF) were estimated using the procedures reported elsewhere (Robertson and Van Soest, 1981; Van Soest et al., 1991). Dry matter digestibility (OMD) was estimated using in vitro two-stage rumen-pepsin technique with rumen fluid (48 h) followed by HCl-pepsin digestion (48 h) (Tilley and Terry, 1963). Ash was determined by incinerating the dry sample at 500 ºC for 4 h (method 7.009; AOAC, 1984). The pH was determined on the liquid phase using a glass-electrode pH meter (Orion 230A, USA). All chemical analysis was expressed on a dry weight basis and analyzed in duplicate. Spectra were collected in the visible (Vis) and NIR regions in reflectance (400-2500 nm) at 2 nm intervals using a scanning monochromator NIRSystems 6500 (NIRSystems, Silver Spring, Maryland, USA; NIRS 2, 1995). Both spectrophotometer operation and data acquisition were performed using the Infrasoft International Software (NIRS 2, 1995). Spectral data were transformed into a near-infrared spectral analysis software (NSAS) format and exported into The Unscrambler software (version 6.0, CAMO Software AS, Oslo, Norway) for multivariate analysis. The resulting calibration equations between the chemical reference values and the NIRS data were evaluated based on the coefficient of determination in calibration (R2) and the standard error of cross validation (SECV) (Naes et al., 2002). The optimum number of terms (latent variables or factors) in the partial least squares (PLS) calibration models was determined as indicated by the lowest number of factors that gave the closest to minimum value of the PRESS (prediction residual error sum of squares) function in cross validation in order to avoid overfitting of the models (Dardenne et al., 2000; Naes et al., 2002). Scatter correction can be used in spectroscopy to correct the whole spectrum for particle size variation. In the present study, the scatter correction method used was the standard normal-variate and detrend (SNVD) (Barnes et al., 1989). The ratio of standard deviation (SD) and SECV namely residual predictive deviation (RPD) were used to test the accuracy of the calibration models (Williams, 2001). The number of samples available in this study allowed for true test validation (Dardenne et al., 2000; Naes et al., 2002). Of the overall set of 120 samples, 60 samples were used for cross validation (training or calibration set), and the remaining 60 as the validation set for testing the model. Selection of both training and validation sets was performed using the CENTER algorithm available in the ISI software package (InfraSoft International, Port Matilda, Pennsylvania, USA). The CENTER algorithm (NIRS 2, 1995) was used for the calculation of Mahalanobis distance (H) to identify collected spectra of each sample corresponding to each treatment. Samples with standardized H > 3 were identified as outliers and were removed during calibration development. As well as H distance, t statistics were also used as selection criteria for outlier samples (NIRS 2, 1995). Samples with t > 2.5 were not considered during calibration development (Alomar and Fuchslocher, 1998; Cozzolino et al., 2000; 2003; Roberts et al., 2004). The prediction accuracy of the models was tested on the validation set using the standard error of prediction (SEP) and the coefficient of correlation (r). The true accuracy (True Acc) of the NIR method was estimated from: True Acc = √SEP2 - SD2 where SD is the standard deviation of the reference method used for calibration, and SEP the standard error of prediction (Naes et al., 2002). RESULTS AND DISCUSSION The chemical composition of the silage samples analyzed by chemical references methods showed a wide range in composition (Table 1). Overall, the ensiling characteristics were considered acceptable in most of the samples analyzed based on the DM content and pH values obtained. Therefore, the variability in chemical composition was considered suitable to develop NIRS calibrations (Dardenne et al., 2000; Naes, et al., 2002). The range of chemical composition in the silage samples separated according to the silo structure (e.g. bunker and bag silo) also showed a wide range in chemical composition (Table 2). It was observed also that some chemical values (high DM and high pH) were outside the expected range for silage (Table 1 and Table 2). The coefficients of determination in calibration (R2) and the standard error in cross validation (SECV) were 0.73 (SECV: 1.2%), 0.81 (SECV: 6.6%), 0.75 (SECV: 2.0%), 0.80 (SECV: 6.7%), 0.80 (SECV: 4.0%), 0.60 (SECV: 3.6%) and 0.70 (SECV: 0.34) for ash, NDF, CP, DM, ADF, in vitro DM digestibility (IVDMD) and pH, respectively (Table 3). The RPD for the NIRS calibration for the evaluated parameters demonstrated how well the calibration models performed in predicting the reference data. If a product shows a narrow range in composition, or if the error in estimation is large compared with the spread (as SD) in composition, then the regression method finds increasing difficulty in finding stable NIRS calibrations. An RPD value greater than 3 is considered adequate for analytical purposes in most of the NIRS applications for agricultural products, whereas a value of 2.5 for the RPD may be regarded as a lower limit for robust NIRS calibrations in quantitative analysis (Williams, 2001). The RPD values obtained for the chemical parameters analyzed were 2.5, 2.0, 2.2, 1.6, 1.3, and 3.0 for CP, DM, ADF, IVDMD, NDF and pH respectively. Based on this statistic, both CP and pH calibrations migth be considered adequate to use in routine analysis, where DM and ADF might be considered intermediate, and calibrations for NDF and IVDMD were considered not suitable to use. The best NIRS validation statistics in the set of silage samples analyzed were obtained for CP (r: 0.91 and SEP: 1.7), DM (r: 0.75 and SEP: 9.5), ADF (r: 0.73 and SEP: 4.8) and ash (r: 0.71 and SEP: 1.3), while intermediate calibrations were obtained for IVDMD (r: 0.54 and SEP: 4.5) and pH (r: 0.51 and SEP: 0.67). This corresponds to an average error of 12.3% for CP, 24% for DM, 12.6% for ADF and 13% for ash, relative to the average of the chemical composition for the same parameters measured using NIR spectroscopy (Table 1). The reproducibility of the reference methods has been reported to be around 1% up to 5% (measured as coefficient of variation). Therefore, the predictive ability of the NIRS models developed can be considered good. These results agreed with those reported by other authors when grass silage was analyzed using NIR spectroscopy (De Boever et al., 1996; Gordon et al., 1998; Park et al., 1998; 1999). These authors reported a true accuracy of the NIRS method in the order of 3.6%, 7.5% and 6.5% for CP, ADF and NDF, respectively. Overall, the results from this study showed good predictive ability of the NIRS method to predict CP, ash and DM. The cross validation statistics for the NIRS prediction of chemical composition in silage samples split by type (bunker and bag silo) are shown in Table 4. The R2 and SECV were for DM 0.65 (SECV: 1.2%), for CP 0.87 (SECV: 1.8%), for ash 0.68 (SECV: 8.1%), for ADF 0.76 (SECV: 1.4%), for IVDMD 0.70 (SECV: 7.0%) and for pH 0.81 (SECV: 0.61%) in the bunker silo samples. The R2 and SECV in the bag silo samples were for DM 0.67 (SECV: 0.67%), for CP 0.90 (SECV: 1.8%), for ash 0.77 (SECV: 0.67%), for ADF 0.81 (SECV: 1.1%), for IVDMD 0.65 (SECV: 5.4%), and for pH 0.81 (SECV: 0.51%). In both cases the best NIRS calibrations were obtained for CP, ADF and pH. The second derivative of the NIR spectra of the silage samples is shown in Figure 1. In the NIR region absorption bands around 1450 and 1970 nm were observed related with O-H overtones (water) (Miller, 2001). Absorption bands around 1600 and 1700 nm related with CH and NH stretch overtone, around 2100 and 2300 nm were related with CH overtones and combination bands, associated to protein, amino acids and cellulose (Miller, 2001). Absorption bands around 1600, 2100 and 2300 nm were also reported to be associated with lignin and cell wall components in grass forage (Nousiainen et al., 2004). The score plot of the three first principal components (PCs) of the silage samples using the NIR spectra are shown in Figure 2. Some grouping between samples labelled according to silo structure was observed. These results indicated that the NIR spectra contain extra information related with silo structure that might be used for the qualitative analysis in order to identify or trace silo samples based on their type of structure. CONCLUSIONS The results from this study suggest that CP, DM and ADF might be analyzed using NIR spectroscopy for routine analysis. Differences in the calibration statistic were observed when samples were split by silage type. Differences in the prediction performance of the NIRS method imply that the calibration models might be sensitive to the range of sample types used for calibration. Therefore, samples from more years need to be included in the calibration data in order to increase the robustness of the NIRS models. Further work will be carried out in order to asses the robustness of the NIR calibrations to predict chemical parameters using wet silage. ACKNOWLEDGEMENTS The authors thank the farmers that provide the silage samples and the technicians of the Animal Nutrition Lab at INIA La Estanzuela for the chemical analysis. The work was supported by the Instituto Nacional de Investigación Agropecuaria (INIA), Uruguay. LITERATURE CITED
Copyright 2009 - Chilean Journal of Agricultural Research The following images related to this document are available:Photo images[cj09067t3.jpg] [cj09067t2.jpg] [cj09067t1.jpg] [cj09067f1.jpg] [cj09067t4.jpg] [cj09067f2.jpg] |
| |||||||||
