 |
| About Bioline | All Journals | Testimonials | Membership | News |
|
||||||
|
||||||
Chilean Journal of Agricultural Research, Vol. 69, No. 4, Oct-Dec, 2009, pp. 567-576 Onset of the rainy season in the province of Córdoba (Argentina) determined by rainfall records and evaluation of its agricultural risk condition Determinación del comienzo de la estación de lluvias en la provincia de Córdoba (Argentina) a partir de registros pluviométricos y evaluación de su condición de riesgo agrícola. Antonio de la Casa[1] [1]Universidad Nacional de Córdoba, Facultad de Ciencias Agropecuarias. CC 509-Ciudad Universitaria, 5000 Córdoba, Argentina. *Corresponding author (delacasa@agro.unc.edu.ar) Received:
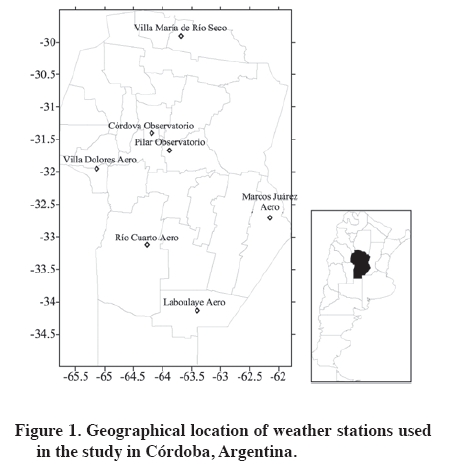
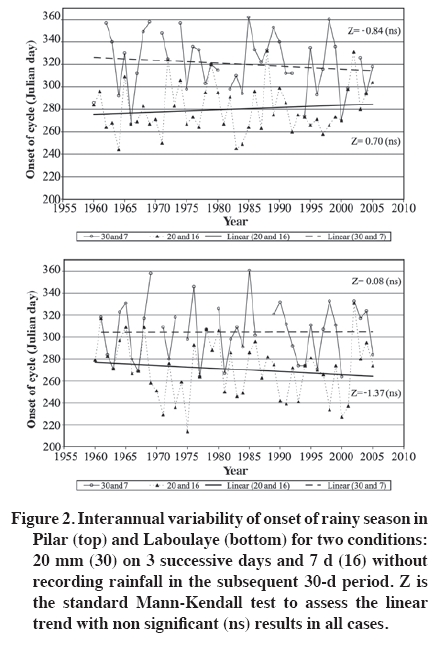
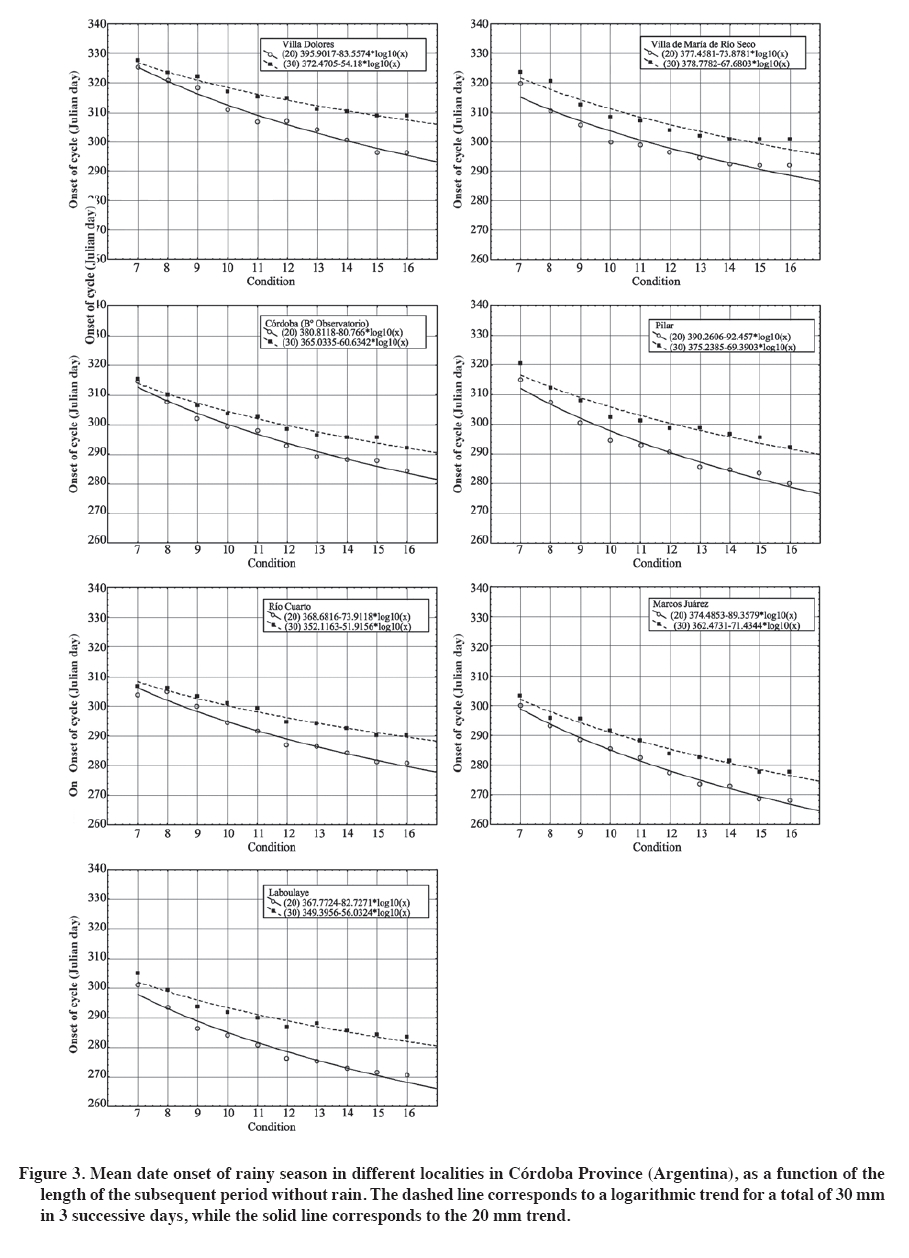
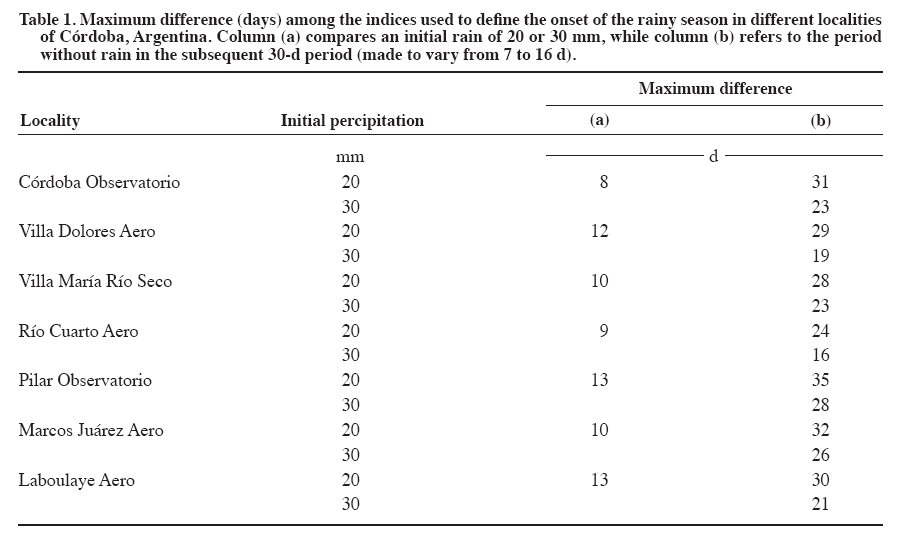
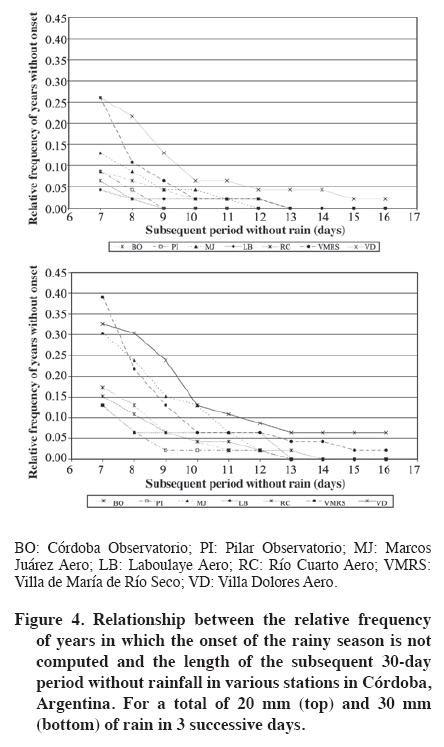
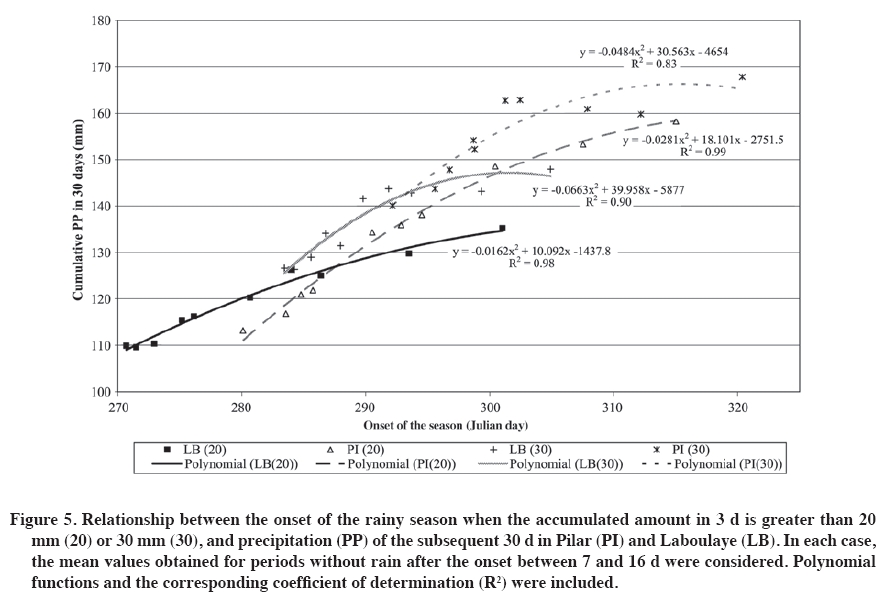
05 December 2008. Code Number: cj09068 ABSTRACT Knowing more precisely the onset of the rainy season in a region would reduce risk at crop establishment. To evaluate this issue, the study proposes a simple procedure based only on daily rainfall data to estimate the onset of the wet season, by analyzing records of seven meteorological stations in the Province of Córdoba between the years 1961 and 2006. The onset of the rainy season was defined according to the simultaneous occurrence of two conditions: (i) the amount of rainfall in 3 consecutive days equal to or greater than 20 or 30 mm, (ii) a period without rain of 7 to 16 d during the subsequent 30-d period. Onset of the rainy season shows strong interannual variability throughout the region. An increase from 20 to 30 mm of rain in 3 successive days delays the onset date, which on the average reaches a maximum of 8 to 13 d, according to location. By allowing a longer period without rain after the initial event, the onset date is systematically earlier by16 to 35 d, depending on initial conditions. Furthermore, the relationship between the onset date and cumulative rainfall in the subsequent 30 d was evaluated with the bivariate normal distribution to estimate the risk level that influences the early sowing decision. Keywords: onset of rainy season, risk of implantation, bivariate normal distribution. RESUMEN Conocer con mayor precisión el comienzo de la estación de lluvias en una región reduciría el riesgo de implantación inicial de los cultivos. Esta problemática se evaluó con un procedimiento que utiliza sólo datos de lluvia diarios para estimar el comienzo de la estación húmeda, analizando registros de siete localidades de la Provincia de Córdoba entre 1961 y 2006. El comienzo de la estación de lluvias se definió de acuerdo a la ocurrencia concurrente de dos condiciones: (i) un valor de precipitación en 3 días sucesivos igual o mayor a 20 mm o 30 mm; y (ii) un lapso sin lluvia que se extiende de 7 a 16 días durante el período de 30 días posterior. El comienzo de la estación de lluvias acusa una fuerte variabilidad interanual en toda la región. Al aumentar de 20 a 30 mm el monto de la lluvia en tres días sucesivos, se produce un retraso en la fecha de inicio que en término medio alcanza como máximo entre 8 y 13 días, de acuerdo a la localidad considerada. Al admitir un lapso sin lluvias posterior al inicio más extenso, se produce un adelanto sistemático de la fecha de inicio, de entre 16 y 35 días de acuerdo a las condiciones iniciales. Además, se estableció la relación entre la fecha de inicio y la lluvia acumulada en los 30 días posteriores, que se evaluó a partir de la distribución normal bivariada para estimar el nivel de riesgo que supone adelantar la decisión de siembra. Palabras clave: comienzo de la estación de lluvias, riesgo de implantación, distribución normal bivariada. INTRODUCTION Both the total quantity of rainfall and the frequency of rainy days are considerably greater during the warm semester (from October to March) in the Province of Córdoba, seasonality which decisively influences the diverse productive activities of the agricultural sector. Where precipitation is markedly seasonal, the onset of the rainy season represents relevant information for planning and decision-making in the agricultural systems, particularly in the dry-land zone. This information can contribute in reducing the risk of the sowing operation, favor adequate initial crop establishment, and also secure the integral or most convenient use of the rainy season (de la Casa and Rodríguez, 1995; de la Casa et al., 1996). Furthermore, the prediction of the demand for water for agriculture is a fundamental aspect for its management, in such a way that the implementation of models destined to its quantification requires adequate temporal and spatial estimations of the sowing date (Leenhardt and Lemaire, 2002). Although the intensification of rain productive processes during the warm season is a dominant climatic trait in the Province of Córdoba, the transition from the dry season (and cold) to the wet (and warm) is often uncertain in terms of opportunity, quantity, or frequency with which rainy episodes occur. The delay of the onset of the rainy season, whether in an absolute sense or as a result of isolated events having no temporal persistence, constitutes a relatively frequent contingency in the region, such that delaying its onset to November and December obliges modifying the sowing dates considered normal for the region. Distinct criteria have been proposed to establish the onset of the rainy season. Cocheme and Franquin (1967) used the relationship between mean values of potential evapotranspiration (PE) and precipitation (PP) to characterize the potential extension of the growing season. As far as Reddy (1993) is concerned, he proposed the moveable mean of 14 weeks for the relationship between PP and PE as greater than 0.75 to determine the sowing week. Raes et al. (2004) analyzed the distinct criteria to determine the onset of the rainy season on a prospective basis, tending to reduce the risk of crop implantation, and confronted them with results derived from the hydrological balance to evaluate their predictive capacity. De la Casa and Ovando (2006) analyzed this problem in the Province of Córdoba with the relationship between precipitation and spectral vegetation indices. Sivakumar (1988; 1990) developed a simple method to estimate the onset of the annual rainfall cycle, in accordance with the quantity of precipitation and the subsequent continuity of events, which has the advantage of exclusively using daily rainfall records in its implementation. Another similar proposal to establish the onset of the rainy season was suggested by Hess et al. (1995). The fundamental underlying the procedures that only use daily rainfall data to estimate the onset of the season is based on the simultaneous consideration of two precipitation traits: quantity of water that each event contributes and the recurrence or temporal continuity of the phenomenon. On the one hand, the joint expression of these characteristics can be integrated with an amount of rain which is considered as the cycle trigger, since it represents minimum water availability to carry out sowing operations, and on the other hand, by a period subsequent to the eventual onset in which precipitation manifests persistence to ensure water replacement for the crops during the initial establishment stage. So, for example, the conditions proposed by Sivakumar (1988) were: a total of 20 mm PP in 3 successive days and no more than 7 consecutive days without PP during the subsequent 30-d period, respectively. On a prospective basis, Mugalavai et al. (2008) evaluated the onset of the rainy season in Western Kenya with the cumulative rainfall value of 40 mm in a maximum of 4 d. De la Casa and Rodríguez (1995) and de la Casa et al. (1996) applied several of these calculation alternatives to the effects estimated on the onset, duration, and extension of the rainy season in the Province of Córdoba, and highlighted the great temporal variability demonstrated by the yearly onset of the phenomenon. Such a condition increments the risk level of the sowing operation, particularly when the decision anticipates the onset of the rainfall cycle. With the massive diffusion in the region of direct sowing in the last few years, and accepting the gradual improvement of the physical conditions of the soil, in particular with respect to hydric dynamics (Nuñez Vázquez et al., 1996), it can be assumed that rainfall would actually show greater infiltration efficiency as a consequence of stubble coverage, as well as direct water evaporation of the soil subsequent to each event would be lower for the purposes of soil temperature (Balesdent et al., 2000). On the other hand, it is reasonable to assume that the established limit conditions in Sivakumar’s (1988; 1990) proposal about an empirical procedure developed to evaluate the onset of rainfall in Africa (southern Sahel and West Africa) demonstrated different behavior in environments with other rainfall regimes. Likewise, taking into account the most temperate spring condition in the Province of Córdoba, it is also interesting to evaluate other alternatives, more or less strict with respect to the mentioned proposal, in order to cover a greater spectrum of situations that could be considered indicators of the onset of the rainy season. First of all, the objectives of this study were to determine, from a retrospective point of view, the onset of the rainy season in the Province of Córdoba, Argentina, with the simple procedure using only daily rainfall data. The second objective was to analyze the variation that distinct modifications imposed on the initial criteria produce on the onset date. The last objective was to establish the relationship between the onset date of the rainfall cycle and the cumulative precipitation in the subsequent 30 d, and use the bivariate normal density function (Wilks, 2006) to estimate the probability of joint occurrence of these random variables with the purpose of evaluating the risk level implied in an anticipated sowing decision in the region. MATERIALS AND METHODS Rainfall information corresponds to the daily rainfall records from 1 January 1961 to 31 December 2006, from seven meteorological stations (Figure 1). These temporal rainfall series were analyzed by recovering their extension trait (which allowed us to have 46 cases per station), uniformity (be part of the same observation network of the Servicio Meteorológico Nacional (SMN)), and continuity (representing continuous data). Following the meteorological criterion, a rainy day was considered as one recording more than 0.1 mm (OMM, 1992). In this way, the series of original data was not modified by imposing some different limit to compute the variable, as Cislaghi et al. (2005) did to analyze the tendencies and oscillations of the rain series in Italy. To determine the onset of the rainy season, daily rainfall data were processed in the period from 1 August to 31 December. The criterion used by Sivakumar (1988) to define the onset of the rainfall cycle was modified in its two basic conditions. The quantity of rain in 3 successive days increased from 20 to 30 mm for the purposes of considering a more restrictive criterion. During the 30-d period subsequent to the onset of rainfall, periods without rain were evaluated with diverse degrees of restriction, going from a maximum of 7-d without rain, which corresponds to a more restrictive criterion, to 16-d periods as a less restrictive criterion. The joint probability density function of the variables, onset of the rainfall cycle (x) and cumulative precipitation in the subsequent 30 d (y) (Wilks, 2006) is given by: 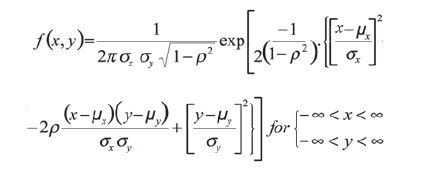
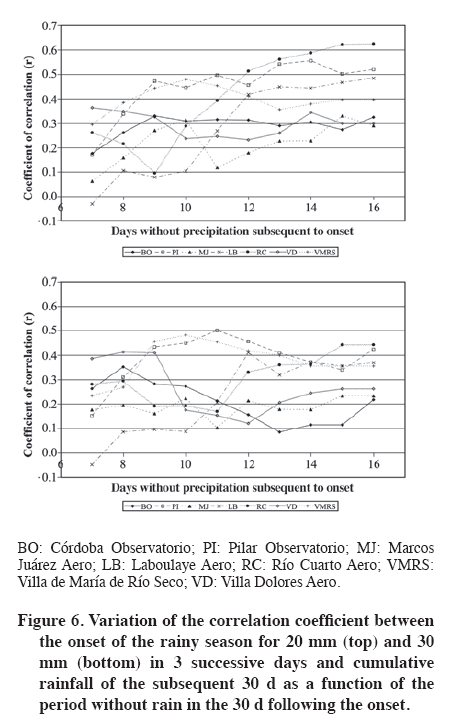
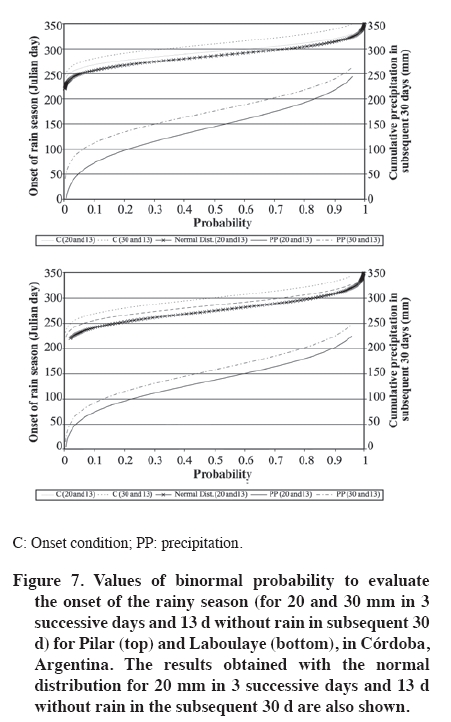
for which the parameters must fulfill the following conditions: where mx and my are the means of the random variables x and y, respectively; sx and sy are the standard deviations of the random variables x and y, respectively; r is the correlation coefficient between x and y (-1 < r < 1); exp is the Euler number (2,71...); π is the constant 3.14. In order to validate the use of the normal probability distribution function for each variable, the statistic that judges the adjustment to goodness-of-fit was calculated according to the methods of Kolmogorov-Smirnov (KS), evaluated in accordance with the maximum significant difference between the theoretical distribution and the empirical distribution and Shapiro-Wilk (SW). In turn, the correlation structure between x and y was evaluated with the Pearson’s correlation coefficient, and the Mann-Kendall test to detect the meaning of the tendency that the onset of the rainy season has experienced over the years (Cislaghi et al., 2005). RESULTS AND DISCUSSION Figure 2 shows the interannual variation of the onset date of the rainy season from 1961 to 2006 in two of the localities of the region. Only the estimations produced from the two most extreme criteria are shown: an initial amount of 30 mm in 3 successive days with a period of no more than 7 d without precipitation in the subsequent 30 d (30 and 7), and an initial amount of 20 mm in 3 successive days with no more than 16 d without precipitation in the subsequent 30 d (20 and 16). When total rainfall increases in the 3 successive days and the subsequent period without rain is considered of shorter extension (30 and 7), there are years in which this condition is not fulfilled (Figure 2), fact highlighted by the non-continuous line. On the other hand, if the rainfall of 3 successive days is reduced to 20 mm, and the subsequent period without rainfall is also prolonged to 16 d, the onset of the season not only occurs each year, but is earlier. This highlights a less strict level in the criterion that defines it, since to start the season it is not necessary to move the rainy season forward. On the other hand, the marked interannual variability of the phenomenon is thus emphasized, that is, the capacity of the method employed to analyze its behavior insofar as the distinct evaluated options and criteria result in significant changes in the estimations. Moreover, in this extensive 46-year period, no increasing or decreasing tendency is seen in the onset of the rainy season in accordance with the non significant results shown by the Mann-Kendall test (Figure 2). Figure 3 shows the mean behavior of the onset of the rainy season in distinct localities in the Province of Córdoba analyzing the differences that emerge when considering a value of 20 or 30 mm in 3 consecutive days of rainfall, and periods with distinct extensions without rain in the subsequent 30 d. First of all, it is emphasized that the onset of rainfall is geographically uneven in the region. Rainfall starts in a more anticipated way in the east of the province (Marcos Juárez and Laboulaye), with mean dates between September and October, and experiencing a progressive delay toward the west (Villa Dolores) where it occurs between October and November in accordance with the different criteria and levels employed (de la Casa and Ovando, 2006). This actual climatic trait in the region coincides with that observed in the first half of the 20th century. On the other hand, Figure 3 also shows a systematic variation pattern that is similar in all localities in such a way that when the imposed criterion to estimate the onset of rainfall becomes less strict (the initial amount of rainfall is lower or the subsequent period without rain is more prolonged), the mean date of the onset of the cycle is early, that is, it occurs further from the end of the year when rainfall is already in place in the region. The increase in the initial amount of rainfall from 20 to 30 mm produces a systematic delay in the onset date, reaching its maximum expression around 8 to 13 d in accordance with the locality (Table 1), which tends to happen as the period without rainfall subsequent to the onset is more extensive. In turn, evaluating, after the onset, a progressively longer interval of days without rainfall, the onset date of the cycle shows an anticipatory tendency (Figure 3, Table 1). In this case, the difference is more significant since Pilar was early by 35 and 28 d for 20 and 30 mm, respectively, whereas in Río Cuarto values were 24 and 16 d, respectively. Analyzed as a whole, it can be observed that when the period without rainfall subsequent to the onset is the minimum (7 d), it generally turns out indistinct to establish it as a criterion for onset for an amount of 20 or 30 mm, and insofar as this period is prolonged, the onset date is proportionately early until the period without precipitation reaches around 13 or 14 consecutive days, and then is maintained invariable. It is then that the difference in considering 20 or 30 mm as the amount of rainfall shows the maximum values indicated in Table 1. An extension of the period greater than 13 or 14 d without rainfall subsequent to the onset scarcely modifies the estimated onset date. This generalized behavior in the region appears in the empirical adjustment line for each locality (Figure 3). On the other hand, when the criterion to establish the onset of the cycle is stricter, several years are not identified in the procedure, aspect that is opportune to analyze in greater detail. As a period without prolonged precipitation is accepted in the subsequent 30 d to the onset, the number of years in which the onset is not verified is evidently reduced to an apparently geometric progression (Figure 4). Villa Dolores shows the greatest relative frequency of years in which the onset of the cycle is not identified from the evaluated criteria, probably because it is the locality with the lowest rainfall regime. With a 3-d precipitation value of 20 mm and when the subsequent period without rain is equal or greater than 10 d, the procedure does not identify the onset with a frequency less than 5% in all localities except Villa Dolores where it is slightly higher. On the other hand, when the initial rainfall criterion is increased to 30 mm, the same thing happens for a subsequent period of 13 d without rain. Interannual variability of the onset of the rainy season Interannual variability that is shown by the onset date is another relevant aspect of the phenomenon insofar as it constitutes a risk indicator for dry sowing (Reddy, 1993), that is, which anticipates the onset of rainfall. In order to evaluate this behavior, the coefficient of variation of the indicators of the onset of the cycle was calculated for each locality, using this dispersion measurement to homogenize comparison in the region. Variation of the extension of the subsequent period without rainfall was observed to only marginally modify the expression of variability, the same as for the two conditions imposed to initial rainfall. The difference among localities is a bit more accentuated with minimum variability values of 7 and 8%, which are the most frequent, and reaching the maximum in Villa de María de Río Seco, Marcos Juárez, and Laboulaye (from 9 to 10% and only a couple of cases 11 and 12%). However, with respect to the distinct alternatives analyzed to estimate the onset of the cycle, the coefficient of variation only expresses slight differences that are not in any case relevant. As a consequence of this marked interannual variability, there is a very extensive period in the whole region in which initial seasonal rainfall can occur, producing considerable uncertainty about the decision to establish a sowing date and determining a high risk level for the dry sowing operation. However, this situation is not so particular since it closely approximates what Raes et al. (2004) observed in Zimbabwe, Africa. Relationship between the onset date of the rainy cycle and quantity of cumulative rainfall in the subsequent 30 days Figure 5 shows the relationship between the onset of the annual rainy season and the cumulative precipitation in the subsequent 30 d for the same localities listed in Figure 2 by using mean values obtained from subsequent periods of distinct extensions without rain. In Laboulaye, the onset takes place in a shorter period of days and also with a lower quantity of subsequent cumulative rainfall. In Pilar, the range is longer, especially considering cumulative rainfall in the subsequent 30 d to the onset. Furthermore, these relationships illustrate the consequence of establishing a less strict criterion for the onset of the rainy cycle, that is, by considering an amount of precipitation in 3 successive days greater than 20 mm instead of 30 mm, or a subsequent period without rain of 7 to 16 d. While the difference is minimal when the first criterion is considered, what occurs when subsequent periods without rain with greater extensions are contrasted becomes more relevant. The functional relationships, all significant (p < 0.01), establish that the later onset of the rainy season and the greater provision of subsequent water will unlikely put at risk initial crop establishment. In general, behavior shows that the change in the quantity of rain in the subsequent 30 d is relatively lower as the onset is delayed. On the contrary, insofar as the onset of the rainy season is earlier, by imposing a more flexible criterion, total cumulative rainfall in the subsequent 30 d is lower and gives rise to an eventually inadequate provision of water. In this way, the earlier occurrence of the onset of the rainy season produces lower subsequent cumulative water, therefore increasing risk of the sowing operation. Bivariate probability analysis The relationship between the onset of the rainfall cycle and the subsequent cumulative precipitation allows determining the risk level that is assumed with anticipating the decision to sow in the region (Figure 5). For this purpose, the binormal probability function was used to previously determine the basic normality condition that each individual random variable must show. The normality condition of both variables was analyzed with the Shapiro-Wilk (SW) and Kolmogorov-Smirnov (KS) goodness-of-fit tests. In accordance with the test values obtained, behavior shows a certain disparity among localities that are made up of the analyzed variables and criteria, as well as the method used to analyze the normality condition. The onset of the cycle shows a normal character in all localities in accordance with an SW (W: p > 0.05), except in Pilar and Marcos Juárez when the initial amount of rain was 20 mm. The KS method generally guarantees the normal character that the empirical frequency distribution shows for both conditions (20 and 30 mm), as well as confirming lesser security with information for Pilar. In the case of cumulative precipitation during the subsequent 30 d to the onset, there is a general tendency showing less normal behavior although, in all localities except Córdoba (BO) and Laboulaye, the normality hypothesis cannot be rejected for some of the evaluated criteria. More precisely, the KS test also put into doubt the normal behavior of the variable in Laboulaye. In turn, the correlation structure can be analyzed with the help of Figure 6 which shows the values of the Pearson coefficient in the region for the relationship between these variables as a function of the accepted duration of the subsequent 30-d period without rain. If the coefficients greater than 0.29 correspond to statistically significant values (n = 46; p < 0.05) are considered, such a condition was reached in almost all the localites for 20 mm in 3 d, and is generalized as the subsequent period without rain is more prolonged. For the onset at 30 mm in 3 successive days, the same can be seen in Figure 6, except in Córdoba (BO), Marcos Juárez, and Villa Dolores where the correlation is not significant at the same level. The binormal distribution in accordance with the a priori analysis can only be strictly used in some of the localities or under certain restrictions. Nevertheless, the effects of evaluating the risk condition that is implied by anticipating the sowing operation, it is proposed to apply the bivariate normal model and evaluate the estimated probability levels, and comparing them with the observations that are derived from the frequency analysis. In this way, it is also possible to analyze a posteriori the scope and precision of the method. With the purpose of evaluating the consistency of the binormal model as an indicator of the onset of the cycle, only the cases with 20 and 30 mm or rainfall in 3 successive days were analyzed for a period of up to 13 subsequent days without rain. The procedure consisted in calculating the relative frequency for each locality for the observed values of the relationship between the onset of the rainfall cycle and PP of the subsequent 30 d, checking them with the estimates in accordance with the binormal probability of these same standardized variables (µx = 0; µy = 0; σx = 1; σy = 1), and using the corresponding correlation coefficient (Figure 6). The bivariate probability (for the relationship between the onset of the rainfall cycle and PP of the subsequent 30 d) was obtained with the calculation program developed by Holst et al. (1999), which solves the integral of the probability density function for both distinct quadrants as well as a rectangular diagram with four given points. Following this second option, the probability values used to evaluate the precision of the model were obtained by increasing the central area in increments of 0.25 and 0.5 standard deviations, that is, by increasing the surface from the center of the diagram toward its periphery. The frequency and probability values were analyzed for correlation and regression in a conventional scatter diagram for the distinct localities. Measurements obtained confirm the aptitude of the binormal model to probabilistically represent the behavior of the onset of the rainy season. In general, the regression lines calculated in each locality were very similar to the identity line and the error was randomly distributed around them. The greatest difference as a measure of maximum absolute error was 14% in Marcos Juárez and 11% in Villa de María de Río Seco, which were isolated cases. Coefficients of determination were always greater than 0.98 and the angle coefficients significant in all cases. The intersection was statistically different from zero (p < 0.05) only in Marcos Juárez and Villa de María de Río Seco. Finally, Figure 7 shows the results of the analysis using Pilar and Laboulaye as examples. When the established criterion to evaluate the onset of the rainy season is 20 mm of rainfall in a maximum of 3 d showing no period greater than 13 d without precipitation in the subsequent 30 d, and assuming a bivariate probability level of 20%, this occurred in Pilar on or before day 277 (4 October) with cumulative rainfall in the subsequent 30 d less than or equal to 97 mm. Laboulaye shows an amount of rain less than or equal to 96 mm, similar to the one in Pilar, and the probable onset was anticipated by 11 d (23 September). In turn, and for the same probability level, if the onset of the season is established at a value of 30 mm and no period greater than 13 d without precipitation in the subsequent 30 d, this could occur in Pilar until day 20 (17 October) with total rainfall less than or equal to 133 mm; whereas in Laboulaye, this condition was also anticipated by 10 d with the amount of subsequent precipitation a bit lower (less than or equal to 114 mm). Figure 7 also shows the difference caused when analyzing the onset of the rainy season with the classical normal probability model. As well as not informing the probable or expected quantity of rain in the whole probability range, it is observed that the normal model estimates the onset of the rainy season anticipating it by 12 d. CONCLUSIONS The onset of the rainy season is markedly variable in the Province of Córdoba as seen in the evaluation of the onset date determined in accordance with distinct criteria based simultaneously in the quantity of rain and its subsequent continuity. The onset of the rainy season in the region presented a coefficient of variation of 8% in its modal value no matter which criterion was used to define it. The increase from 20 to 30 mm in the amount of rain of 3 successive days in the criterion to estimate the onset of the seasonal rainfall cycle in the Province of Córdoba produced a delay in the mean onset date that reached a maximum value between 8 and 13 d in accordance with the locality under consideration. On the other hand, if the period without rain subsequent to the onset was prolonged for more than 7 d, the estimated onset date was early in all the analyzed localities and relatively more significant in Río Cuarto with 24 and 16 d and in Pilar with 35 and 28 d for 20 and 30 mm, respectively. The strong variability of the onset of the seasonal rainfall cycle in the whole region, as well as the decrease that cumulative rainfall showed in the subsequent 30 d to the onset, when the onset was anticipated, explains the marked uncertainty in the decision to establish the sowing date, and represents a high risk level for the dry sowing operation. The binormal distribution is an adequate model to evaluate risk level of the sowing operation in probabilistic terms since it connects two critical aspects in this operation: the effective onset of the rainfall cycle and the quantity of water that subsequent rainfall contributes. LITERATURE CITED
Copyright 2009 - Chilean Journal of Agricultural Research The following images related to this document are available:Photo images[cj09068f5.jpg] [cj09068f3.jpg] [cj09068f6.jpg] [cj09068f7.jpg] [cj09068f2.jpg] [cj09068f4.jpg] [cj09068t1.jpg] [cj09068f1.jpg] |
| |||||||||
