 |
| About Bioline | All Journals | Testimonials | Membership | News |
|
||||||
|
||||||
Chilean Journal of Agricultural Research, Vol. 70, No. 1, Jan-Mar, 2010, pp. 142-149 Green index to estimate crop nitrogen status in potato processing varieties Índice verde como estimador del estatus de nitrógeno en variedades de papa para industria Claudia Marcela Giletto[1]*, Cecilia Díaz1, Jorge Edgardo Rattín1, Hernán Eduardo Echeverría2, and Daniel Osmar Caldiz3 [1]Universidad Nacional de Mar del Plata, Facultad de Ciencias
Agrarias, Ruta 226 km 73,5, Balcarce, Buenos Aires, Argentina. *Corresponding
author (cmgiletto@balcarce.inta.gov.ar). Received:
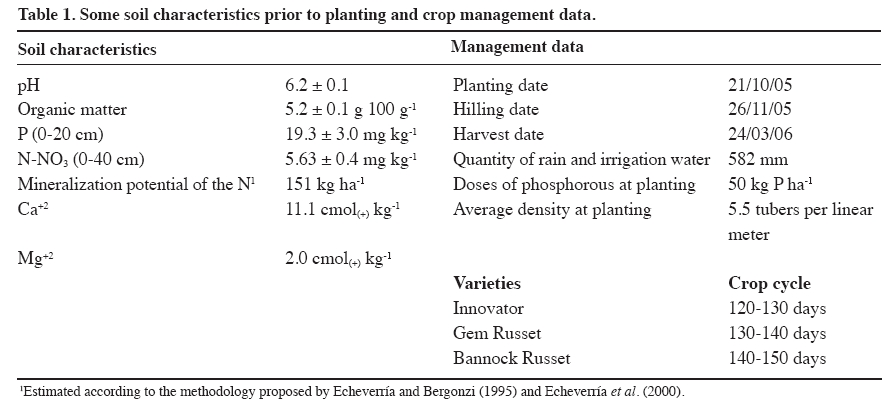
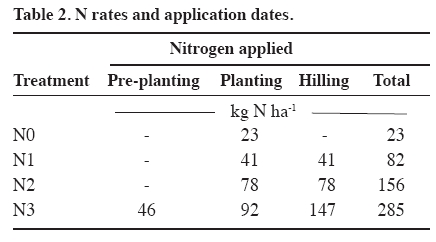
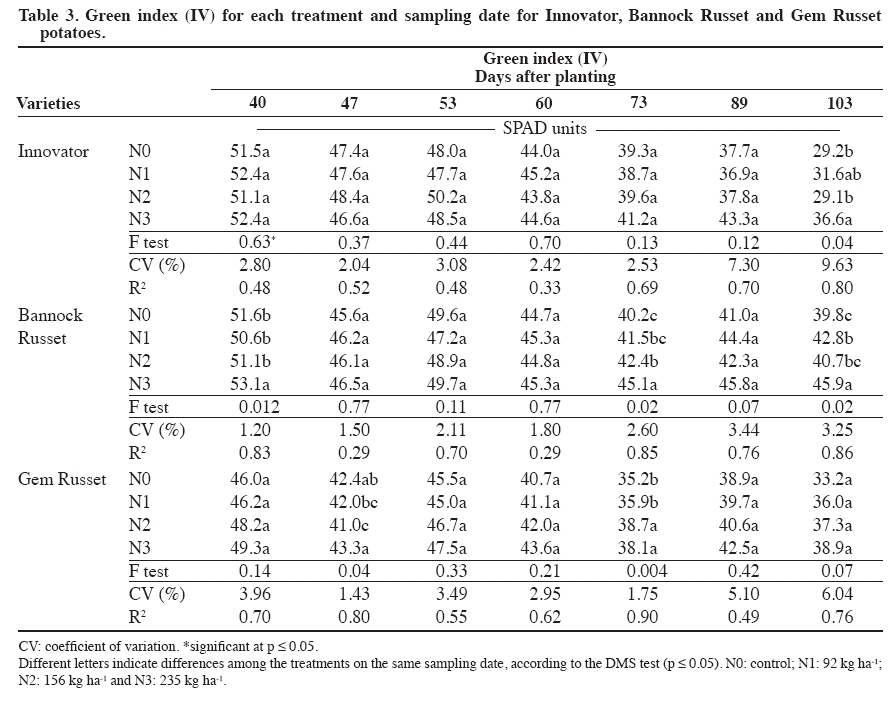
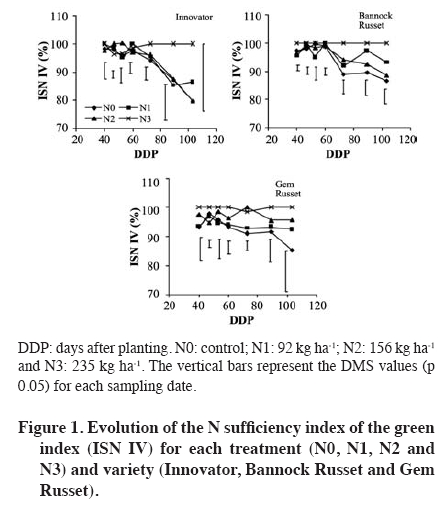
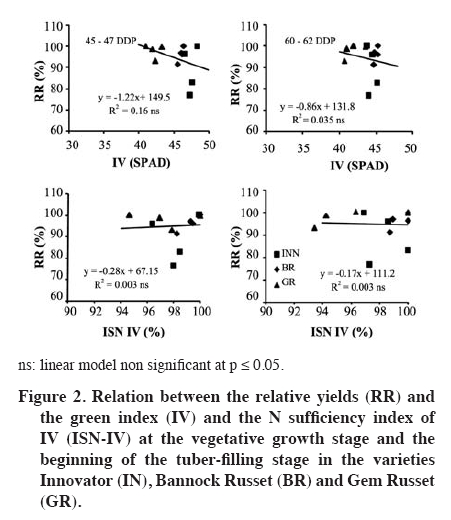
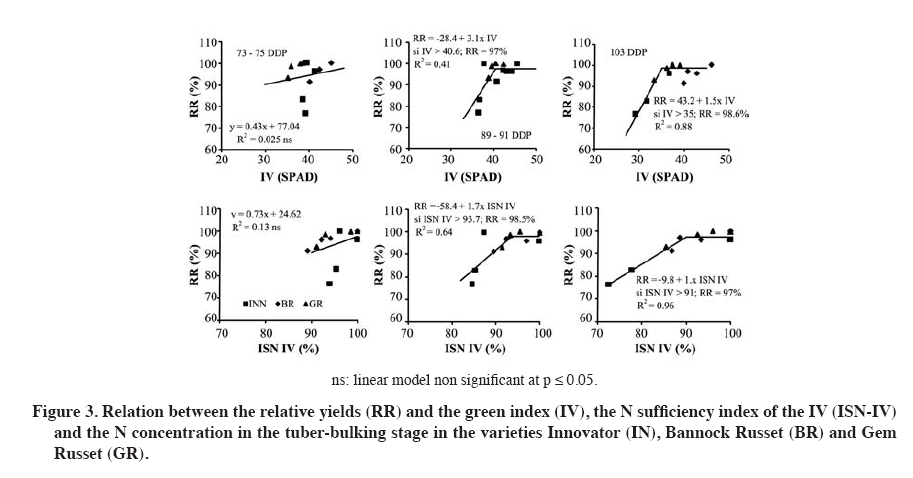
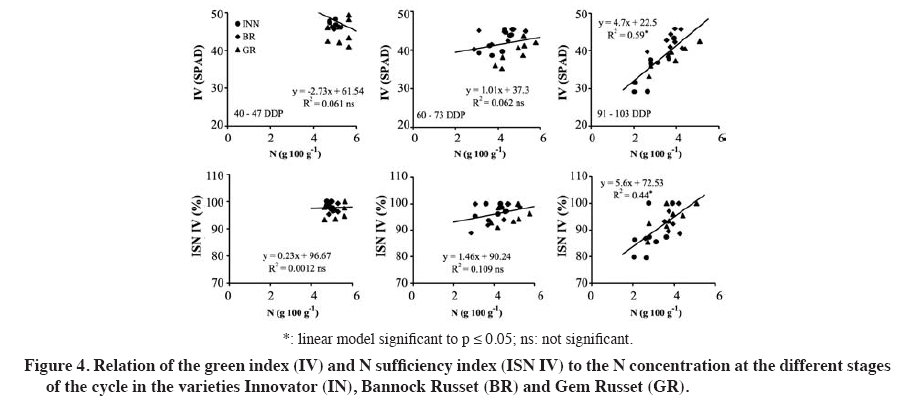
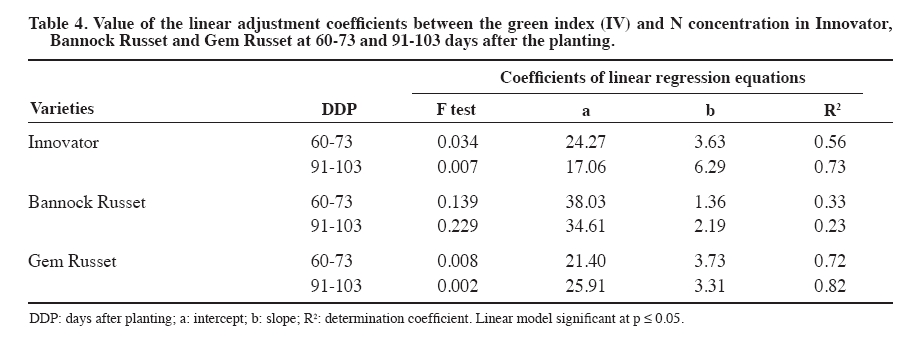
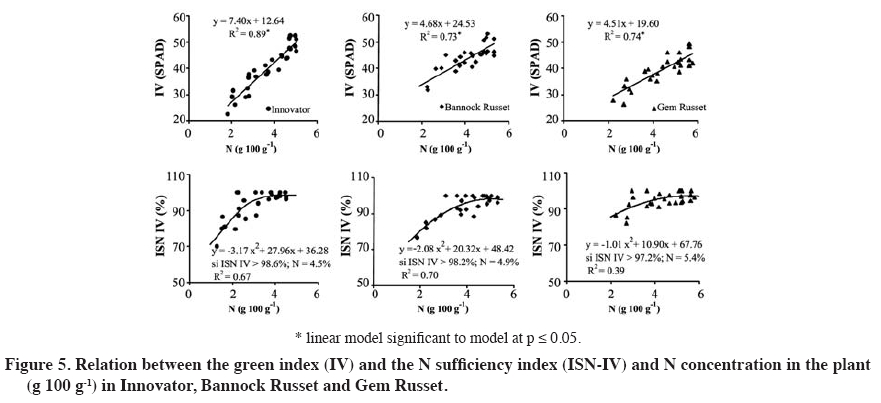
13 March 2009. Code Number: cj10015 ABSTRACT Nitrogen is the most important nutrient in growing potatoes (Solanum tuberosum L.) because either a deficit or excess in its supply can affect yield and quality, resulting in economic losses. To make a rational use of this nutrient, it is necessary to monitor N status during crop development. The green index (IV) could be a valuablemethod to assess N sufficiency. In experiments with variable N supply, the IV was assessed during crop growth and an N sufficiency index was derived (ISN-IV). The relationship between tuber yield and the IV and ISN-IV was established, as well as the association between the IV and ISN-IV and N concentration in the following varieties: Innovator, Bannock Russet and Gem Russet. During the vegetative growth stage, the IV and ISN-IV were respectively above 40 SPAD units and 93%; while N concentration in the plant was above 4% in the three varieties, which suggests the N supply was sufficient. During the tuber-bulking stage, the necessary IV and ISN-IV thresholds to reach maximum yields were 40.6 and 35 SPAD units and 93.7 and 91% at 89 and 103 days after planting, respectively. We concluded that the chlorophyll meter is an appropriate tool to determine the nutritional status in potato crops. The IV and ISN-IV values showed that the crop achieved maximum yields when N levels are above the threshold values found in this research. Key words: nitrogen, chlorophyll meter, potato varieties, Solanum tuberosum. RESUMEN El N es uno de los nutrientes que más afecta al cultivo de papa (Solanum tuberosum L.), puesto que su aporte en defecto o exceso ocasiona pérdidas en rendimiento y calidad. Para realizar un uso racional del nutriente es necesario monitorear el N en las distintas etapas fenológicas de la planta; el índice verde (IV) puede resultar un método alternativo promisorio a tal efecto. En ensayos con dosis de N variable, se midió el IV a lo largo del ciclo y se relativizó el IV a un índice de suficiencia de N (ISN-IV). Se estableció la relación del rendimiento de tubérculos con el IV e ISN-IV y la asociación entre el IV e ISN-IV con la concentración de N en las variedades Innovator, Bannock Russet y Gem Russet. Durante el crecimiento vegetativo IV e ISN-IV fueron superiores a 40 SPAD y a 93%, respectivamente, y la concentración de N en planta fue mayor al 4% en las tres variedades, lo que sugiere adecuada nutrición con N. En el llenado de tubérculos, los umbrales necesarios para alcanzar los máximos rendimientos para IV e ISN-IV fueron 40,6 y 35 SPAD y 93,7 y 91% para los 89 y 103 días después de la plantación, respectivamente. Se concluye que el medidor de clorofila fue una herramienta apropiada para determinar el estado nutricional en papa. Los valores de IV o ISN-IV mostraron que el cultivo alcanzó el máximo rendimiento y niveles suficientes de N cuando éstos fueron superiores a los umbrales mencionados. Palabras clave: nitrógeno, medidor de clorofila, variedades de papa, Solanum tuberosum. INTRODUCTION Nitrogen is the nutrient that has received the most attention in potato cultivation because either a deficiency or an excess of the nutrient can negatively affect the development of the crop in terms of yield and the quality of tubers (Echeverría, 2005; Caldiz, 2006; Samborski et al., 2009). Consequently, it is necessary to monitor N status to meet crop requirements in a timely and adequate manner in order to maximize yield and quality by taking the best advantage of N use (Echeverría, 2005). Among the techniques for assessing N levels is notably the chlorophyll meter, which measures the green index (IV) of the leaf. This index estimates the chlorophyll content in the leaf and through this the N concentration in vegetal tissue, based on the assumption that N and chlorophyll content have a strong correlation (Haverkort and MacKerron, 2000). Chlorophyll meters have been used to determine N deficiencies in various crops, such as wheat (Triticum aestivum L.) (Vidal et al., 1999; Arregui et al., 2000), rice (Oryza sativa L.) (Esfahani et al., 2008), potato (Gianquinto et al., 2004) and corn (Zea mays L.) (Ziadi et al.,2008). In potatoes IV is measured in the terminal leaflet of the fourth totally expanded leaf on the stalk given that the higher leaves that are more exposed to solar radiation tend to have higher N content than those lower down (Westermann, 1993; Gallardo, 2000; Westermann, 2005; Abbate and Andrade, 2005). Minotti et al. (1994) and Giletto et al. (2006) concluded that the IV is more affected by the intraspecific variation in the color of the leaves than by N fertilizer additions and that the IV should be calibrated for each genotype. The IV is affected by several factors, among them: varieties, growth states, position of the leaves, nutritional deficiencies other than N, soil type, radiation, foliar diseases and environmental conditions such as water availability and temperature, independent of N availability (Sainz Rozas and Echeverría, 1998; Olivier et al., 2006). Consequently, to minimize the influence of these factors it is recommended to relativize the IV by establishing reference areas with excess N to obtain leaves with a maximum chlorophyll concentration. Based on the IV readings from the reference areas without N limitations, an N sufficiency index (ISN) is estimated from the quotient between the IV of the sector of the plot being characterized and the IV of the sector without N limitations (Schepers et al., 1992; Denuit et al., 2002). Snapp et al. (2002) determined that the ISN should be higher than 96% throughout the crop cycle. If the ISN is below this threshold, it is recommended to correct the deficiency by fertilizing with N. To use the chlorophyll meter as an estimator of the early nutritional state, it is necessary to obtain acceptable correlations between IV or ISN with yield in the early stage of the cycle, when correction of N deficiencies are still feasible. Wood et al. (1992) determined good correlations between IV and yield in cotton (Gossypium hirsutum L.) and Piekielek et al. (1995) did the same with corn. However, close relationships between these variables have still not been established in potato crops in order to determine the threshold of the IV and the ISN-IV (Giletto, 2002; Giletto et al., 2006). The objective of this study was to determine the evolution of the IV under different N doses in potato crops in order to establish the relation between tuber yield with IV and INS-IV and between IV and ISN-IV and N concentration at different stages in the crop cycle of the varieties Innovator, Gem Russet and Bannock Russet. MATERIALS AND METHODS The assay was carried out during the 2005-2006 agricultural season at the McCain experimental field station in Balcarce (37º45’ S; 58º18’ W, 130 m.a.s.l.), Buenos Aires Province, Argentina, in a typic Argiudoll (Soil Survey Staff, 2008) without limits in its use capacity. Table 1 summarizes some soil characteristics at the time of planting and crop management data. The soil was prepared for planting with a disk harrow, chisel (Industrias Erca, Armstrong, Argentina) and vibrocultivator (Nievas, Buenos Aires, Argentina) and subsequently before the crop reached 100% coverage, furrows were hilled. Pest and disease control were carried out with the application of chemicals products specific for each case. Weed control was conducted with chemical applications and mechanical methods. Irrigation was carried out with a Reinke Electrogator II center pivot system (Reinke-Deshler, Nebraska, USA) from 40-45 d after planting (DDP) until the end of February. The experimental design was randomized complete blocks divided into plots, with three replications. The main plot was the sampling date and the sub-plot was the N treatment. The N rates are shown in Table 2. The treatment with the lowest N doses was applied at planting, while the intermediate doses were divided between planting and beginning of tuber-filling stage, and for the highest doses there was also a pre-planting application. The combination of doses and timing of fertilization provided a wide range of N availability throughout the crop cycle. The N source was granulated urea [(NH2)2CO]. The IV was determined with a SPAD-502 chlorophyll meter (Minolta, Spectrum Technologies, Chicago, Illinois, USA). The terminal leaflet of the fourth expanded leaf of the main stalk was used for the determination, with a total of 20 plants per plot. Readings were taken every 15 d. The readings were taken at 47, 60, 75, 89 and 103 DDP. Plants in a 1-m-long line from randomly selected furrows for each replication were harvested for sampling. Each sample was dried at 60 ºC for 72 h or until constant weight was reached and N concentration was determined using the Kjeldahl method (Nelson and Sommers, 1973). When the crop reached maturity, plants were manually harvested from 2 m of the five central furrows of each plot and estimations of yield were made in fresh weight. Relative yield (RR) was calculated as the ratio between yield of each treatment and highest average yield of the assay. The ISN-IV was determined as the relation between the reading of each experimental unit and the highest average reading of the assay. RR was associated with the IV and ISN-IV and the IV and ISN-IVN were associated with N concentration. The results were analyzed with the Statistical Analysis Systems program (SAS Institute, 1988). The measurements from each treatment were compared using the least significant difference test (LSD) (p ≤ 0.05) when ANOVA was significant. The linear functions (linear-plateau) and quadratic functions (quadratic-plateau model) were obtained using the PROC N-LIN procedure of the SAS system. RESULTS AND DISCUSSION The ANOVA determined significant interaction between sampling date (main plot) and fertilization treatment (sub-plot). The IV decreased (p < 0.05) throughout the cycles of the three varieties, the decrease in Bannock Russet being the least (Table 3). This difference was probably due to Bannock Russet matures later than the other two varieties (Love et al., 2005). Booij et al. (2000) suggested that the IV should be higher than 40-41 SPAD units in the first 7 to 8 wk of the crop and that values below this threshold are indicators of N deficiency. In the first stage of the cycle (up to 60 DDP), the IV was 40 SPAD units in all the treatments of the three varieties. Consequently, the crop did not manifest any N deficiency through this nutritional indicator. This indicated that N availability in the soil was sufficient to meet crop requirements, including the control. In the second half of the cycle (after 60 DDP), IV tended to decrease as the crop cycle advanced and it fell below the reference threshold. During this period the treatments were ordered according to N availability. The decrease in the IV was because photoassimilates and nutrients were being directed to the tubers and foliar senescence had begun, first among plants that suffered N stress and then those that had more access to the nutrient. To relate IV to ISN-IV, in the first stage of the cycle (up to 60 DDP) it was determined that this index was above 93% in the three varieties and did not vary (p > 0.05) with N application. Beginning at 73 DDP, the treatment that received 235 kg ha-1 (N3) presented higher ISN-IV values than the other treatments, which were ordered according to N availability, demonstrating that N deficiencies become evident in the treatments that had received less N. The differences in ISN-IV among the different treatments in Innovator were greater than in Bannock Russet and Gem Russet (Figure 1). No association was established between relative yields and the IV and the ISN-IV in the three varieties (p > 0.05) (Figure 2) at the vegetative stage and the beginning of the tuber-filling stage (45-47 DDP and 60-62 DDP, respectively). The IV was over 40 SPAD units, confirming that the crop did not present N deficiencies, concurring thus with Booij et al. (2000). Zebarth et al. (2002) demonstrated that the IV in corn is not consistent with the N level in plants when the values are above 43.7 SPAD units. At the same time the ISN-IV was above 93%, close to the value established by Snapp et al. (2002) as a sufficient N level for potatoes. Falótico et al. (1999) established that a relative SPAD value of 92-95% in wheat is indicative of sufficient N levels. Given the above, the chlorophyll meter showed that the potato plants had sufficient N levels in the early stages of the cycle. Different thresholds of N sufficiency were determined during the tuber-bulking stage, based on those that obtained the highest yields. The IV and ISN-IV values were 40.6 and 35 SPAD units and 93.7 and 91% at 89 and 103 DDP, respectively (Figure 3). Varvel et al. (1997) recommended N fertilization for corn to correct deficiencies if the ISN at the eight-leaf stage is less than 95%. Andrián et al. (2001) concluded that the association in wheat between ISN and yield is closer beginning with anthesis. Consequently, the association among the variables in the potato is also more precise in the second half of the cycle. No relation was determined between IV and ISN-IV and N concentration during the vegetative growth stage (40-47 DDP). The IV and ISN-IV values remained relatively constant when N concentration in the plant was above 4%, concurring with what was determined by Di Salvo (2001) in fescue (Festuca arundinacea Schreb.) and tall wheat grass (Elytrigia elongata Dewey). This confirms that the chlorophyll meter showed that in the early stages the crop had sufficient N, including the control treatments. Subsequently (60-73 and 91-103 DDP), the IV and ISN-IV tended to increase with increased N concentration in the three varieties, with this association being closer between 91 and 103 DDP (Figure 4 and Table 4). Figure 5 shows the relationship between IV and ISN-IV and N concentration for each variety throughout the cycle, establishing that both variables increased (p < 0.05) with increased N concentration. The linear regression coefficients between the IV and N concentration differed with the variety. IV values of 42.2, 43.3 and 37.6 for Innovator, Bannock Russet and Gem Russet, respectively, are required to reach 4% N. These results confirm the differences in the intensity of the green coloring among the varieties and the need to relativize the IV (Schepers et al., 1992; Denuit et al., 2002). The regression analysis, using a quadratic-plateau model, established that the maximum ISN-IV values among the three varieties were reached when the N concentration was above 4%. CONCLUSIONS Based on the analysis presented in this work we can conclude that the chlorophyll meter is an ideal instrument for determining the nitrogen status of potato crops. The studied crop reached maximum yield when the IV index was above 35-40 SPAD units and the ISN-IV was 91-93.7%. An N concentration of 4% was sufficient for the crop. LITERATURE CITED
Copyright © 2010 - Universidade de Santa Cruz do Sul The following images related to this document are available:Photo images[cj10015t3.jpg] [cj10015f4.jpg] [cj10015t4.jpg] [cj10015f1.jpg] [cj10015f5.jpg] [cj10015f2.jpg] [cj10015f3.jpg] [cj10015t1.jpg] [cj10015t2.jpg] |
| |||||||||
