 |
| About Bioline | All Journals | Testimonials | Membership | News |
|
||||||
|
||||||
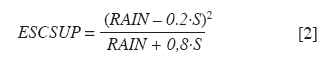
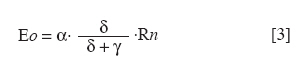
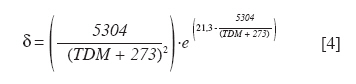
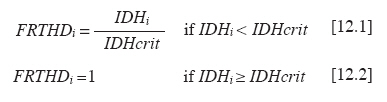
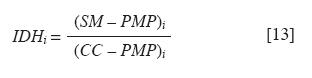
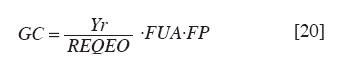
Chilean Journal of Agricultural Research, Vol. 70, No. 3, July-September, 2010, pp. 417-427 Research Simulation of dry matter productivity and water dynamics in a Chilean Patagonian range Simulación de la productividad de materia seca y dinámica del agua en praderas de la Patagonia chilena. G Giorgio Castellaro1, S Luis Morales1, Mario Ahumada2, Azelio Barozzi2 1 Universidad de Chile, Facultad de Ciencias Agronómicas, Casilla 1004, Santiago, Chile Correspondence Address: G Giorgio Castellaro, Universidad de Chile, Facultad de Ciencias Agronómicas, Casilla 1004, Santiago, Chile, gicastel@uchile.cl Date of Submission: 17-Jul-2009 Code Number: cj10046 Abstract This paper describes a simulation model combining the main components of water balance and growth of perennial grassland steppe in Chilean Patagonia, to estimate long-term annual production (Yr, kg ha -1) and sheep carrying capacity (GC, sheep equivalent [EO] ha -1). The model is based on climate-water balance relationships, where the basic process is evapotranspiration. The model calculates Yr depending on the accumulation of transpiration and the water use efficiency from the time of growth initiation until the grassland accumulates the maximum amount of dry matter (DM). Depending on Yr, the DM requirement of EO, the proper use factor of grassland and a slope correction factor, a range site GC is calculated. Simulations were performed using actual climate data sets of eight growing seasons at Kampenaike (52°41' S; 70°54' W; 12 m.a.s.l.) and a long-term simulation in the same location, using a stochastic weather variables generator. Through the model it was possible to estimate the water loss associated with the components of water balance and estimate the restriction imposed by water deficit on Yr. By simulating many years, it was possible to establish a normal distribution of GC with 0.629 EO ha -1 yr -1, associated with 80% probability of being exceeded, which is lower than values reported in field assessments. This method calculates GC with a conservational approach, taking into account soil and climatic variability in semiarid ecosystems.Keywords: grassland simulation models, grazing capacity, Patagonian steppe range Resumen Se describe un modelo de simulación para pastizales esteparios de la Patagonia chilena, que estima a largo plazo los principales componentes del balance hídrico, la producción anual de MS (Yr, kg ha-1) y la capacidad de carga ovina (GC, equivalente ovino [EO] ha-1) de éstos. El modelo se basa en la relación clima-balance hídrico, siendo el proceso básico la evapotranspiración. Yr es función de la acumulación de transpiración durante la temporada de crecimiento y de la eficiencia del uso delagua. La GC del pastizal se calcula en función de Yr, del requerimiento de MS del EO, del factor de uso apropiado de la pradera y de un factor de corrección por pendiente. Se efectuaron simulaciones utilizando datos climáticos reales de ocho temporadas en la localidad de Kampenaike (52º41’ S; 70º54’ O; 12 m.s.n.m) y una simulación en el largo plazo para la misma localidad, utilizando un generador estocástico de variables climatológicas. Se cuantificaron las pérdidas de agua asociadas a los componentes del balance hídrico y se estimó el efecto del déficit hídrico sobre Yr. Al simular muchos años fue posible establecer una función de distribución de la GC, la cual fue del tipo normal y a través de ella se estimó una GC de 0,629 EO ha-1 año-1 asociada al 80% de probabilidad de excedencia, valor que resultó más bajo que los reportados en evaluaciones en terreno. Este método permite calcular la GC con un criterio conservacionista, tomando en consideración la variabilidad edafoclimática de los ecosistemas semiáridos. Palabras clave: capacidad de carga, modelos de simulación de praderas, pastizales esteparios de la Patagonia. Introduction The majority of grassland ranges in the eastern zone of the Magallanes and Antártica Chilena Region have developed under moderate and cold temperatures, the province having a very cold steppe ecology with a dominant dry summer season. The climate of this province is characterized by aridity, with precipitation distributed regularly throughout the year that ranges between 100 and 400 mm, with a summer dry season. The frost-free period is barely 2 months (December and January), with serious risks of frost during the rest of the year (Gastó and Gallardo, 1995). Sandy soils of recent volcanic origin dominate throughout the Patagonian steppes. Under these conditions, perennial grasses belonging to the genera Festuca, Stipa, Poa and Rytiodosperma are predominant, growing in clumps (Ahumada and Faúndez, 2002). This type of grassland supports extensive systems of sheep production for both meat and wool. One of the important aspects for planning the use of grasslands is estimating the grazing capacity, which is a key factor for the success of livestock operations and for the sustainability of the system (Holechek et al., 2001). To estimate grazing capacity it is necessary to know average annual productivity of grassland ranges, which is a limiting factor in planning grazing practices. This information is scarce, has little spatial representativeness, or is limited to only a few years and does not take into account climatic variability in grassland productivity, especially precipitation. One way to address this scarcity of information, in terms of grassland productivity is to use simulation models; with which it is possible to estimate the annual productivity of this type of range with limited edaphoclimatic and physiological information (Castellaro and Squella, 2006). Consequently, the present work had the objective of developing a simulation model to make long-term estimations of the dynamics of water and annual dry matter (DM) production in different types of grassland ranges, under different edaphoclimatic environments, and with this information, to determine grazing capacity and the risks associated at different levels of productivity. Materials and Methods The proposed simulation model is based on the climate-water balance, water stress being the main limiting factor in the growth process. The model provides simulations on a daily basis of evaporation, transpiration, surface runoff and drainage for a determined site in the range. As well, it calculates annual forage production in the growth season in function of the accumulation of transpiration from the time that growth begins until when the range accumulates the maximum quantity of DM. The model can be used with real edaphoclimatic records and also use a stochastic generator of climatic variables to produce long-term simulations. As well, it offers the possibility of interconnecting with a geographic information system and thus simulates the spatial distribution of production. The grazing capacity of the range is calculated in function of DM production of the season and considering the annual DM requirement of the animal unit, as well as a ranges′s proper use factor for the evaluated site(s). The majority of the hypotheses involved are conceptualized through the use of empirical relationships and the level of organization involved in the range as a group of vegetal species with similar physiological behavior. The scale of application is farm at the regional level. The systems of equations involved are numerically resolved using a daily integration interval. The use of the model is primarily operational and secondarily for research (Campbell, 1997). Given the above, the simulation model considers the water balance as the most relevant factor. Water balance One of the most important factors in the production of a grassland range is the availability of water in the proximity of the roots. Consequently, it is necessary to simulate a water balance in this zone, which can be divided into various strata. The flow diagram of this process is presented in [Figure - 1]. It is necessary to know the water constant, the field capacity (CC, mm), permanent wilting point (PMP, mm) and apparent density (DAP, g cm -3 ) for each of these strata. The source of water in the soil is effective precipitation (PPef, mm d -1 ), which is the difference between precipitation and surface runoff. Loss of water from the system is by transpiration (TR, mm d -1 ), direct evaporation from the soil (ER, mm d -1 ) and drainage (DREN, mm d -1 ). The equation of the water balance is defined as: SM t = SM t-1 + PPef – ER – TR – DREN [1] where SM t and SM t-1 are the water contents of the soil on the days t and t - 1, respectively. Effective precipitation: To determine effective precipitation it is necessary to know the magnitude of surface runoff (ESCSUP, mm d -1 ). This last variable is calculated using the curve number method proposed by the Soil Conservation Service (Martínez de Azagra and Navarro, 1996): where RAIN is precipitation (mm d -1 ) and S (mm d -1 ) is a parameter of the retention of precipitation, which is obtained based on the number curve of the watershed. In accordance with Equation 2 surface runoff is produced when precipitation exceeds 20% of the value of parameter S. Range′s evapotranspiration: The evapotranspiration of the range is calculated following the method proposed by Wight and Hanks (1981). The first step is to determine the reference evapotranspiration (Eo, mm d -1 ), which is calculated with the Priestley-Taylor equation (Williams et al., 1990; Moir et al., 2000; Loomis and Connor, 2002; Sumner and Jacobs, 2005), given that only daily records of temperature and global solar radiation were available: The information on temperature and global solar radiation can be obtained from files that contain real data or can be simulated using a climatic generator (Campbell, 1997). In Equation 3, α is the Priestley-Taylor parameter, whose value is supposed as equal to 1.291, in accordance with local climatic conditions; δ represents the curve of the vapor pressure slope to saturation versus the air temperature; γ is the psychometric constant (0.68 mbar °C -1 ) and Rn is net radiation on the surface of the range. The variable δ is a function of mean air temperature (TMD, °C) and is calculated with Equation 4: Rn is estimated based on global solar radiation (RSG, MJ m -2 d -1 ) and the albedo of the combination of vegetation and soil (ALB), using an empirical equation 5 similar to that proposed by Williams et al. (1990): Rn = 0.408·RSG·(1– ALB) [5] The albedo (ALB) was introduced into the model considering the value of the vegetation albedo (ALBv), the bare soil albedo (ALBs) and the presence or absence of a layer of snow over the terrain (Snowp, mm). If there is a layer of snow covering the soil, the albedo has a value of 0.9. If there is no snow, the albedo is calculated according to an average weighting of the vegetal cover and the values of ALBv and ALBs. A fixed value equal to 0.23 (Loomis and Connor, 2002) is supposed for ALBv, while ALBs is determined in function of the water content of the first strata of soil, expressed as a volumetric fraction (Campbell, 1997). The potential evapotranspiration of the range (ETpr, mm d -1 ) was obtained by multiplying reference potential evapotranspiration (Eo, mm d -1 ) by a coefficient termed CROPCO, which reflects the relationship between the Eo and that corresponding to ranges, the characteristic value of which varies between 0.85 and 1.0 (Wight and Hanks, 1981): ETpr = Eo·CROPCO [6] Potential transpiration (TP, mm d -1 ) is defined as water loss from the vegetal surface when the existing conditions of humidity in the soil do not limit the process. In this model, TP is calculated using the following equation: TP = TRANCO·ETpr [7] The TRANCO coefficient is denominated as the transpiration coefficient, and is a measure of the effect of the active vegetal cover (transpirant). This coefficient is calculated using the following equation: TRANCO = 1 – e -0.6 IAF [8] In Equation 8, IAF (m 2 leaf m -2 soil) is the leaf area index of the range, which measures the size of transpirant foliar surface. IAF is calculated according to the following equation: IAF = IAFmax·RGC [9] The parameter IAF max represents the maximum IAF of the range (example: IAF max = 2.0-3.0; for ranges in temperate areas) (Wilson and Meyers, 2007), which must be weighed by a function termed RGC that reflects the seasonal changes produced in transpirant phytomass throughout the growing season. RGC is described by a modification of the density function of the Poisson type, which uses the growing days of the range as an independent variable (Wight, 1987): RGC = ratioC·eshaper (1 – ratioD) [10] The coefficients termed shaper, ratioC and ratioD are calculated in function of the day that growth begins, the day on which maximum accumulation of DM is produced and the day in which growth is complete. These dates, expressed in Julian days, were calculated in function of temperature and average annual precipitation in the range site, using the equations cited by Paruelo et al. (2000). Real transpiration of each soil stratum (TRE i, mm d -1 ) was simulated based on potential transpiration (TP, mm d -1 ), of a factor of water restriction to the transpiration from the soil stratum (FRTDH i), of a factor of root activity (Rootact) and a factor of the proportion of roots that are in the soil stratum (Rootf i) (Wight and Hanks, 1981): TREi = TP·FRTHDi·Rootact·Rootfi [11] The factor that reduces potential transpiration (FRTDH i) depends on the level of water available in the soil strata: where IDH i is the water deficit index of the soil strata, which is calculated in function of the water level (SM i, mm) and the water constants, field capacity (CCi, mm) and the permanent wilting point (PMP i, mm) of the same (Castellaro and Squella, 2006):
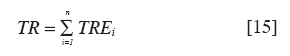
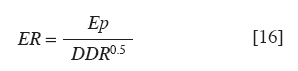
IDHcrit represents the value of the humidity index (IDH i), above which the transpiration of the range is not restricted, and indicates the degree of resistance of vegetal species to a water deficit. A value of between 0.5 and 0.8 is generally accepted for ranges with average rooting (Wight and Hanks, 1981). The factor of root activity (Rootact) only affects water absorption in the surface layers of the soil and is dependent on soil temperature, which is assumed to be equal to mean air temperature (TMD, ºC). Rootact = 0.0408 e(0.19 TMD) [14] The proportion of roots in each stratum of soil (Rootf i) is calculated in function of the depth of each stratum, always assigning a reference value equal to 1 to the relative proportion of existing roots in the surface stratum. Real transpiration of the range (TR, mm d -1 ) is calculated by the sum of the contributions of each of the strata: The evaporation rate directly from the soil is assumed to come solely from the first soil layer, the thickness of which is between 10 and 15 cm. Real evaporation (ER, mm d -1 ) is a function of potential evaporation (Ep, mm d -1 ) and of the days elapsed since the last time that the soil was dampened by effective precipitation greater than or equal to 1.5 times the value of Ep (DDR): Potential evaporation was calculated in function of the difference between potential evapotranspiration of the range (ETpr) and potential transpiration of the same (TP). The value of Ep thus determined cannot be higher than the maximum direct evaporation rate, a value that is in function of potential evapotranspiration and the percentage of bare soil in the range site that is exposed to water loss by direct evaporation (mulch): Ep = MINIMO (ETpr – TP; ETpr mulch) [17] In this way, the soil can continue losing water to the process of direct evaporation, even at water contents below those defined as available for the plants (PMP). Nevertheless, the evaporation rate cannot be greater than residual water content of the stratum. Drainage: Water drainage from a soil stratum (DREN i, mm d -1 ) is calculated on the supposition that it represents all the water that exceeds CC, which then passes to the next soil stratum (Campbell, 1997): DRENi = SMi– cdci if Semi> CC [18.1] DRENi = SMi– cdci if Semi ≤ CC [18.2] Annual DM production in the range Annual DM production of the range at the time of maximum accumulation (Yr, kg ha -1 yr -1 ) was estimated in function of the accumulation of transpirated water during the growth period (t f - t i) and of the water use efficiency of the range (eua, g MS kg -1 water). The latter is a physiological parameter that in the case of ranges dominated by perennial grasses has a value that varies between 1.0 and 2.1 g MS kg -1 of transpirated water (Walker and Langridge, 1996; Paruelo et al., 2000; Tracol et al., 2006): Grazing capacity of the range The grazing capacity of the range (GC, EO ha -1 yr -1 ) is expressed in terms of animal units equivalent to sheep (EO), defining this as the quantity of DM (50% digestibility) required to satisfy the annual needs of one 50-kg Corriedale sheep that gestates and weans a 20-kg lamb, the value of which is some 650 kg of DM per year (Borrelli, 2001; Covacevich, 2001). Knowing the animal demand, it is possible to estimate the potential grazing capacity of the different types of ranges (GC, EO ha -1 yr -1 ), using the following equation: [INLINE:20] In the formula above, Yr is the production of phytomass area (kg ha -1 yr -1 ) estimated for the total vegetation of the range (Equation 19); REQEO is the DM requirement of EO, FUA is the appropriate use factor, which depends on the type and condition of the grassland and that can be assumed to be equal to 40% for coiron pasture (Ongaro, 1995; Holechek et al., 2001). The previous equation also considers a reduction factor owing to the effect of the slope of the range site (FP), which in turn depends on the type of ruminant. This factor varies between 1.0 in relatively flat sites (slope < 10.5%) and can be equal to zero in sectors with abrupt slopes (slope > 95.5%), where sheep do not have access to grazing (Mundaca, 2004). Simulation of water balance and annual DM production using real meteorological data The simulation was made of the water balance of a range site located in a sector of the Kampenaike Regional Research Center of the Instituto de Investigaciones Agropecuarias INIA (52º41′ S; 70º54′ W; 20 m a.s.l.) in the Magallanes and Antártica Chilena Region. Eight seasons were simulated, beginning 1 April 1988, using the daily meteorological information gathered at the aforementioned station. The average annual values of mean temperature (6.5 °C) and precipitation (292.5 mm) and a maximum IAF value of 2.0 are used to estimate the IAF evolution curve of the range. Based on this, the IAF curve shown in [Figure - 2] was obtained. The range begins development of foliar area on September 30, reaches its maximum on December 11 and completes its growth on May 7. A water use efficiency (WUE) equivalent to 1.2 g MS kg -1 transpirated water and a CROPCO coefficient equal to 1.0 were used. The critical water deficit index (IDHcrit) was fixed at a value of 0.8. The percentage of bare soil present in the range (mulch) was fixed at 20%. With respect to the factor of appropriate use of the range, a value of 40% was assigned (FUA = 0.4), to coiron pasture (Holechek et al., 2001). A soil in flat area (< 5% of slope) is supposed, with a homogenous profile of loamy-sandy texture, divided in four strata: 0-15, 15-40, 40-70 and 70-100 cm (DEPROREN, 2003). An apparent density of 1.45 g cm -3 , was assigned to each stratum, according to what is suggested by the USDA-ARS, for loamy-sandy textured soils (Wight, 1987). At the water constants, CC and PMP, values of 14.3 and 6.6%, respectively, were assigned (based on dry soil weight). According to these edaphic characteristics, a number curve with a value of 70 is considered, representative of herbaceous cover that moderately dense and in regular to good condition. The humidity contents to April 1 (initiation day of the simulation period) are estimated at 13, 9, 10 and 13% (based on dry soil weight), for stratum Nº 1, 2 3 and 4, respectively. Simulation of the water balance and annual DM production in the long-term The objective of this simulation was to estimate the variability in DM production and GC in the context of fluctuations in climatic variables, based on simulated values, to estimate a distribution function of this last variable. The previous analysis was carried out in the same locality, considering the historic monthly averages of precipitation, number of days with rain, and maximum (Tmax, ºC) and minimum mean temperatures (Tmin, ºC) for the months of January and July and their respective standard error (EE Tmax, and EE Tmin) [Table - 1]. These variables are input data for a climatic simulator that generates daily data on precipitation, temperature and radiation solar (Campbell, 1997). The same soil and foliar area distribution conditions are supposed for this simulation as those in the simulation that uses real climatic data. In this way, the differences observed are solely attributable to climatic conditions. The analysis was made simulating a period of 100 years. The following section of this work presents the results corresponding to the analysis of the main components of the water balance, as well as the estimation of DM production and the grazing capacity of the range, corresponding to the situation that used real climatic data, such as the one that employed simulated series of precipitations, temperatures and solar radiation using a climatic generator. Results and Discussion Water balance in the soil profile Variations in the water content in each of soil stratum over the course of the analyzed seasons are presented in [Figure - 3], in which a pattern can be appreciated in the variation in water content year by year. The water content remains close to CC (31.1; 51.8; 62.2 and 62.2 mm, for strata N° 1, 2, 3 and 4, respectively) for much of the winter, decreasing sharply during the summer months. This behavior is more pronounced in the surface strata, where the major proportion of active roots that extract water. The water content in this stratum falls below even the PMP (13 mm) and is the stratum most exposed to water loss by direct evaporation and transpiration. The latter process is produced mainly during the spring and part of the summer when climatic conditions are more favorable and there is more transpirant surface, but not exceeding 3 mm d -1 , except on occasional situations associated with summer days with high temperatures and high levels of radiation solar. In contrast, the rate of direct evaporation from the soil continues during the winter at low intensity, with a tendency to increase during the growth season, but not exceeding transpiration during this period [Figure - 4]. The accumulated values of the components of the water balance during the growth period of the range; DM production (Yr, kg ha -1 yr -1 ) and estimated CC (EO ha -1 yr -1 ) are presented in [Table - 2]. According to what is indicated in [Table - 2], water loss from the system owing to evapotranspiration varied between 133 and 225 mm, showing a tendency to decrease over time. Transpiration varied between 48 and 55%, indicating that approximately half the water that is retained in the root area is lost through evaporation from barer soil and is not used by the plants. The Tr/Tp quotient varied between 0.29 and 0.44, indicating that during the growth season the effect of water restriction on transpiration and consequently on growth was of a large magnitude, exceeding 50% and reaching almost 70%. Loss owing to runoff was practically nonexistent, which indicates that all the precipitated water penetrates the soil profile. Water loss beyond the root area was important and highly variable (between 4 and 40% in relation to precipitation). This aspect can be relevant if we consider these losses as a factor that determines lixiviation of nutrients. Dry matter (DM) production and grazing capacity (GC) of the range The process of DM production in the proposed model is closely associated with the process of transpiration of the range. Annual DM production (Yr) in the evaluated locality varied between 1462 and 861 kg ha -1 . These values are consistent and realistic compared to the records of net DM production obtained in experiments carried out at the Kampenaike Experimental Station and in range sites in good condition in similar edaphoclimatic environments (Covacevich and Ruz, 1996; Ahumada et al., 2003; DEPROREN, 2003). However, it should be noted that the majority of these assays did not include measurements of water in the soil nor daily data on temperature, pluviometry and solar radiation. The former constitutes a fundamental aspect to be considered in future research with the purpose of calibrating and validating this model. According to the simulated values of Yr, the GC of this range site varied between 0.91 and 0.53 EO ha -1 yr -1 [Table - 2]. Analyzing the seasonal tendency of the simulated DM production values (seasons 1988 to 1995), there is an evident tendency to decrease, which occurs at an annual rate of around 71 kg ha -1 yr -1 [Figure - 5]. This situation can be attributed to the observed decrease in precipitation as a product of dry year cycle that occurs in the area of study, which produces an increasingly unfavorable water balance for range growth [Table - 2]. However, because this is a short period of time, it cannot be concluded that this tendency will remain over the long term. Water balance, DM production and grazing capacity: long-term simulation The average values of the variables analyzed and their associated main stadigraphs, obtained for a simulated period of 100 years, are presented in [Table - 3]. [Table - 3] confirms that runoff has minimal significance to the system. Drainage and precipitation show high variability and their behavior and distribution tend to be asymmetric. Evapotranspiration and its two components present coefficients of asymmetry and kurtosis that indicate that these variables follow a pattern of normal distribution. A similar tendency is observed in Yr and in GC, which presented a variability of around 15%. [Figure - 6] shows fluctuations of the GC variable, which does not evidence a sustained tendency to decrease. This contrasts with the short-term analysis using the simulation of eight seasons based on real records of climatic information [Table - 2]; [Figure - 5]). These seasons probably correspond to a dry-year cycle, in which it is possible to expect a decrease in productivity. Therefore, it is necessary to have a sufficiently long-term data series (of at least 20 yr) to obtain more robust conclusions. The Kolmogorov-Smirnof normality test was applied to the simulated series of the GC variable and a P value of 0.7132 was obtained (at 95% confidence), from which it can be affirmed that this variable can be adequately modeled through a normal distribution function. [Figure - 7] presents the histogram of frequencies and the accumulative density function of theoretical normal distribution associated with the simulated series of GC data, the mean ± standard deviation of which was 0.715 ± 0.102 EO ha -1 yr -1 . The normal distribution had a good adjustment to the simulated series [Figure - 7], also confirming the premise of the central limit theorem, which stresses that "independently of the distributions of the different random variables that intervene in the construction of a model, it can be supposed that the result obtained will have an approximately normal distribution" (Grinstead and Snell, 1997; Pena de Ladaga and Berger, 2006). Using this probabilistic model, it therefore possible to estimate the sheep carrying capacity of these ranges with different percentages of certainty, thus quantifying the productive risk of the system. As an example, in planning a range-use system employing an animal carrying capacity at 80% certainty, the carrying capacity will be on the order of 0.629 EO ha -1 yr -1 . This critical value is associated with the most probable quantity of DM to be obtained, and it can assured in 80% of the years to obtain a value equal to or greater than the critical value mentioned above. The critical value determined is lower than the average value (0.715 EO ha -1 yr -1 ), which in turn has only 50% probability of being equaled or exceeded. The mean value of GC for each type of range reported by Covacevich and Ruz (1996), which reaches 0.79 EO ha -1 yr -1 , according to the probabilistic model determined in this work, has only a 23% probability of being equaled or exceeded, consequently being of greater risk. In this manner, with the help of this model, using easily accessible edaphoclimatic information, estimations can be made of annual DM production and grazing capacity in different edaphoclimatic environments, complementing the empirical information gathered in the field and contributing in this way to range-use planning on a quantitative basis, as well as to reduce the negative effects of over-grazing. Conclusions Water loss from the grassland system of the analyzed agro-ecological zone is largely due to evapotranspiration. However, approximately 35% is lost from direct evaporation from the soil, representing water that does not contribute to plant growth. Another important loss of water from the system is drainage. Apart from representing unproductive water, drainage can have an effect by removing nutrients from the area of the roots. The magnitude of the water deficit during the grassland growth period borders on 50%, which suggests that the main limiting factor for the growth and production of DM in these grasslands is water stress, which operates through a restriction on the process of transpiration. Definitively, this defines the productive and grazing capacities of the range. Simulating several years is feasible for estimating a function of distribution of grassland productivity, and thus determines an associated value of grazing capacity to a certain level of probability. This would allow for livestock planning employing a conservationist criteria and taking into consideration edaphoclimatic variability, which is characteristic of semi-arid ecosystems. [25] References
Copyright 2010 - Chilean Journal of Agricultural Research The following images related to this document are available:Photo images[cj10046f1.jpg] [cj10046f2.jpg] [cj10046f3.jpg] [cj10046f4.jpg] [cj10046f5.jpg] [cj10046f6.jpg] [cj10046f7.jpg] [cj10046t1.jpg] [cj10046t2.jpg] [cj10046t3.jpg]The following images related to this document are available:Photo images[cj10046f2.jpg] [cj10046f1.jpg] [cj10046t2.jpg] [cj10046f6.jpg] [cj10046f4.jpg] [cj10046f7.jpg] [cj10046f5.jpg] [cj10046f3.jpg] [cj10046t3.jpg] [cj10046t1.jpg] |
| |||||||||

![[Figure - 1]](/showimage?cj/photo/cj10046f1.jpg)
![[Figure - 2]](/showimage?cj/photo/cj10046f2.jpg)
![[Table - 1]](/showimage?cj/photo/cj10046t1.jpg)
![[Figure - 3]](/showimage?cj/photo/cj10046f3.jpg)
![[Figure - 4]](/showimage?cj/photo/cj10046f4.jpg)
![[Table - 2]](/showimage?cj/photo/cj10046t2.jpg)
![[Figure - 5]](/showimage?cj/photo/cj10046f5.jpg)
![[Table - 3]](/showimage?cj/photo/cj10046t3.jpg)
![[Figure - 6]](/showimage?cj/photo/cj10046f6.jpg)
![[Figure - 7]](/showimage?cj/photo/cj10046f7.jpg)