 |
| About Bioline | All Journals | Testimonials | Membership | News |
|
||||||
|
||||||
Chilean Journal of Agricultural Research, Vol. 70, No. 4, 2010, pp. 523-536 RESEARCH Determination Of Antioxidant Capacity, Total Phenolic Content And Mineral Composition Of Different Fruit Tissue Of Five Apple Cultivars Grown In Chile Determinación de la capacidad antioxidante, contenido de fenoles totales y composición mineral de diferentes tejidos de frutos de cinco variedades de manzana cultivadas en Chile. Carolina Henríquez1*, Sergio Almonacid2, Italo Chiffelle3, Tania Valenzuela3, Manuel Araya4, Lorena Cabezas4, Ricardo Simpson2, and Hernán Speisky5 11Centro
Regional de Estudios en Alimentos Saludables, Gran Bretaña 1093, Valparaíso,
Chile. *Corresponding author (carolinahenriquez@creas.cl). Received: 11 November 2009. Code Number: cj10058 ABSTRACT Apples (Malus domestica Borkh.) have been identified as one of the main dietary sources of antioxidants, mainly phenolic compounds. These compounds vary in their composition and concentration, among cultivars and fruit tissues. In this research, the total phenolic content (Folin-Ciocalteau assay), antioxidant capacity (Ferric Reducing Antioxidant Power, FRAP assay) and mineral composition in three fruit tissues (peel, pulp and whole fruit), of apple cultivars commonly used for dried apple production in Chile, were studied. In addition, the physical-chemical characteristics (dry weight, pH, titratable acidity, soluble solids content and color) were also evaluated. The results indicated that the total phenolic content, the antioxidant capacity, and the mineral composition, of peel were substantially higher than those of whole fruit, and pulp for all the cultivars studied. Among cultivars, ‘Red Delicious’ apple peels have a significantly much higher content of total phenolic (11.6 mg gallic acid equivalents [GAE] g-1 FW) and a higher FRAP (209.9 µmol Fe+2 g-1 FW). Additionally, a high correlation between total phenolic content and antioxidant capacity was found in all the cultivars and fruit tissues analyzed, except in the apple pulp. On the other hand, the physical and chemical composition differed among cultivars and fruit tissues. In conclusion, our results demonstrated that the total phenolic content, antioxidant capacity, mineral composition, and physical and chemical characteristics vary considerably depending on the apple cultivars and fruit tissues analyzed. Key words: Folin-Ciocalteau assay, FRAP antioxidant capacity, physical-chemical parameters. RESUMEN Las manzanas (Malus domestica Borkh.) han sido identificadas como una de las principales fuentes de antioxidantes en la dieta, principalmente de compuestos fenólicos. Estos compuestos varían en su composición y concentración según el cultivar y el tejido del fruto. En esta investigación se determinó: el contenido de fenoles totales (ensayo de Folin-Ciocalteau), la capacidad antioxidante (ensayo FRAP, Ferric Reducing Antioxidant Power) y la composición mineral en tres tejidos del fruto (piel, pulpa y fruto entero) de las principales variedades usadas en la producción de manzana deshidratada en Chile. Adicionalmente se evaluaron las características físico-químicas (materia seca, pH, acidez titulable, contenido de sólidos solubles y color). Los resultados indican que en todas las variedades estudiadas, el contenido de fenoles totales, la capacidad antioxidante, y la composición mineral de la piel fueron substancialmente mayores que los valores obtenidos en el fruto entero y la pulpa. Entre las variedades analizadas, la piel del cv. Red Delicious presentó significativamente mayor contenido de fenoles totales (11,6 mg equivalentes ácido gálico [EAG] g-1 PF) y mayor valor FRAP (209,9 µmol Fe+2 g-1 PF). Adicionalmente, se encontró una alta correlación entre el contenido de fenoles totales y la capacidad antioxidante en todas las variedades y los tejidos del fruto analizados, excepto en la pulpa. Por otro lado, la composición física y química varió. En conclusión, el contenido de fenoles totales, la capacidad antioxidante, la composición mineral, y las características físicas y químicas varían considerablemente, dependiendo de la variedad de manzana y el tejido del fruto analizado. Palabras clave: ensayo Folin-Ciocalteau, capacidad antioxidante FRAP, parámetros físico-químicos. INTRODUCTION Increasing clinical trial and epidemiological studies have established that a high dietary intake of fruits and vegetables is strongly associated with a reduced risk of developing some chronic diseases, such as various types of cancer, cardiovascular disease, type II diabetes and other degenerative or age-related diseases, which are the main causes of death in developed countries (Lampe, 1999; Arts and Hollman, 2005). It has been hypothesized that this association may be partially attributable to the presence of antioxidant compounds in fruits that protect the cells against the oxidative damage caused by the reactive oxygen species (ROS) and reactive N species (RNS), involved in the pathogenesis of these diseases. In addition to vitamins (C and E) and carotenoids, the bioactive non-nutrient phytochemicals such as phenolic compounds, are supposed to play an important role in the prevention of major chronic diseases (Arts and Hollman, 2005; Scalbert et al., 2005). In effect, phenolic compounds are major antioxidants of our diet (Scalbert et al., 2005). In addition, there have been reported to have other biological effects, including anti-microbial, anti-inflammatory, anti-mutagenic, anti-carcinogenic, anti-allergic, anti-platelet and vasodilatory actions (Boyer and Liu, 2004; Scalbert et al., 2005). On the other hand, main minerals and essential trace elements are very important in biological processes, and play a vital role in normal growth and development and have also been involved in the prevention of some chronic diseases (Gorinstein et al., 2001). Apples (Malus domestica Borkh.) are a significant part of the human diet (Wolfe et al., 2003). In addition, they have been identified as one of the main dietary sources of antioxidants, mainly phenolic compounds, such as flavonoids, rather than essential vitamins, such as vitamin C, which explains only 0.4% of the total antioxidant capacity (Boyer and Liu, 2004). In Chile, apples are one of the most important fruits. Recently, commercial apple production has reached 1.3 million t yr-1. Around 60% of such production is destined for exports, mainly as fresh produce and the other part is processed to produce juice concentrates, frozen and dried products. In apples, as well as in other fruits, the phenolic content vary among different cultivars, within different tissues of the fruit, growing conditions, cultural practices, ripeness during harvest, post-harvest storage conditions, and processing (Imeh and Khokhar, 2002; Boyer and Liu, 2004). Several researches reported that apple peel may contain more antioxidants and antioxidant capacity than the pulp fraction or the whole fruit (Wolfe et al., 2003; Chinnici et al., 2004; Tsao et al., 2005; Łata and Tomala, 2007; Drogoudi et al., 2008; Khanizadeh et al., 2008; Vieira et al., 2009a). It is known that a significant variation exists in the harvest quality and characteristics of different apple cultivars. In this context, a recent study has shown an association between some of these characteristics and the total phenolic content and the antioxidant capacity. This information would be important for the consumer, as they could recognize, for example, a more nutritional apple by its characteristics such as peel color (Drogoudi et al., 2008). No comprehensive data have been reported on the physical-chemical composition, total phenolic content, antioxidant capacity and mineral composition of different apple cultivars, commonly used in Chile for the production of dried apples. Since Chile is an important exporter of dried apple, it is necessary to study the composition of the raw material, to ensure product quality, and to assess the potential use of secondary products such as apple peel. Therefore, the objectives of this research were: a) to determine the total phenolic content and antioxidant capacity of five apple cultivars and to compare the values of apple peel in relation to other fruit tissues; b) to evaluate the physical-chemical characteristics and the mineral composition of the fruit tissues in the five cultivars evaluated and; c) to find if there is any association between these parameters and the total phenolic content and antioxidant capacity. MATERIALS AND METHODS Plant material The apple cultivars evaluated in this study were: ‘Fuji’, ‘Granny Smith’, ‘Pink Lady’, ‘Red Delicious’, and ‘Royal Gala’. All fruits were harvested at the technological ripe stage, in a commercial plantation, located in Molina (35°06' S; 71°16' W), Curicó, Maule Region, Chile, during the summer 2007. The average air temperature ranged between 7.2 and 19.9 °C, with an annual rainfall of 700 mm, occurring mainly from May to October. The commercial plantation was localized in a clay-loam soil, the only fertilizer applied was urea during the months of February and March, and the pruning method used was firstly carried out with chemical products and then manually handled. The fruits used in the evaluations were picked randomly; then, placed in polyethylene bags and transported in ice to the Nutrition and Food Technology Institute. Samples were then selected to eliminate damaged and poor quality units to obtain uniformity. Fruits were washed in water with chlorine (0.150 g L-1), rinsed with water and stored in a refrigerated chamber at 0 °C until use. Fruit tissues evaluated The fruit tissues prepared from the apples were: 1) Peel (portion of apple fruit without pulp); 2) pulp (portion of apple fruit without peel); and 3) whole fruit (portion of apple fruit, without the core and seeds). Peel and pulp were obtained from 10 randomly selected apples. Each apple was divided into two sections along the vertical axis. One part of the fruit was carefully peeled with a stainless steel vegetable peeler to obtain the peel without pulp. The pulp was obtained from one section, and this was cut into small pieces, excluding the core and the seed. The whole fruit was obtained from four randomly selected apples. Each apple was divided into four sections along the vertical axis, and the core and seeds were removed. To prepare the extract, samples were cut into small pieces and mixed, to make a homogeneous pool. All the extract used to evaluate the physical-chemical characteristics the total phenolic content and the antioxidant capacity were prepared at 20 °C. For each cultivar, 10 apples were randomly taken to determine whole fruit weight. Fractional weight (peel and pulp) was also determined. The core weight was calculated by the difference. Physical-chemical characteristics Dry weight. It was determined gravimetrically based on sample weight loss after being heated in oven at 70 ºC for 24 h (AOAC, 1990). Color. It was measured from apple peel and pulp from six randomly selected apples. The parameters CIELab: L*, a* and b*, were measured with a CR-200b tristimulus reflectance colorimeter (Minolta, Osaka, Japan). The parameter L* indicates brightness or lightness (0 = black, 100 = white), a* indicates chromaticity on a green (-) to red (+) axis, and b* indicates chromaticity on a blue (-) to yellow axis (+). Numerical values of a* and b* were converted into hue angle (Hº = tan-1 (b*/a*)) and chroma (C = (a*2 + b*2)1/2). The hue is an angle in a color wheel of 360°, with 0°, 90°, 180° and 270° representing the hues red-purple, yellow, bluish-green and blue respectively, while Chroma is the intensity or purity of the hue (McGuire, 1992). pH, titratable acidity and soluble solids content. To prepare the extracts, three repetitions of 30 g of fresh apple peel or pulp, and 90 g of fresh whole fruit were homogenized in a Waring blender (51 BL 32, Torrington, Connecticut, USA) for 1 min in 200 mL of boiled water. The homogenate was filtered under vacuum condition and the filtrate apple juice was used for the analysis. The pH was measured in 30 mL of filtrate, using a digital pH-meter (Microprocessor pH Meter 537, WTW, Weilheim, Germany). The titratable acidity was determined in 30 mL of filtrate, by titration with 0.1 M sodium hydroxide pH 8.1. This potentiometric titration was performed with a digital pH-meter (Microprocessor pH Meter 537, WTW, Weilheim, Germany). The results were expressed as percentage of malic acid (% of malic acid) (AOAC, 1990). The soluble solids content was determined using a hand-refractometer (model Master T, VWR International, West Chester, UK) at 20 °C. From the filtrate, 10 mL were centrifuged at 1600 g for 10 min in a centrifuge (HERMLE Z200A, Wehingen, Germany) and then the soluble solids content (°Brix) was determined in the supernatant. Total phenolic content and antioxidant capacity Sample preparation. To prepare the extracts, 10 g of fresh apple peel, or pulp and 90 g of fresh whole fruit were mixed with 90 and 250 mL of acetone at 70%, respectively. The mixture was homogenized for 1 min in an Ultra Turrax homogenizer (OMNI International, GLH-02, Kennesaw, Georgia, United States) and the extracts were shaken in a water-bath at 20 °C for 60 min. Three samples (1.5 mL) were centrifuged at 2500 g for 15 min at 4 °C and the supernatants were used for the analysis (1st extraction). The residues were re-extracted in the same conditions, and the supernatants were used for analysis (2nd extraction). Each supernatant (1st and 2nd extraction) was independently measured. All results were expressed as the sum of the 1st and 2nd extraction. Total phenolic content. It was evaluated using a modified colorimetric method described previously by Singleton and Rossi (1965). The method involves the reduction of Folin-Ciocalteau reagent (Sigma Chemical, St. Louis, Missouri, USA) by phenolic compounds, with a concomitant formation of a blue complex. In this study, 0.50 mL of the extract was mixed with 3.0 mL of distilled water and 0.25 mL of Folin-Ciocalteau reagent. Immediately, 0.75 mL of saturated sodium carbonated and 0.95 mL of distilled water were added. Then, the mixture was incubated for 30 min at 37 ºC, and the absorbance was read at 765 nm using an UV-Vis spectrophotometer (Unicam Heλio α, Cambridge, UK). The measurement was compared to a standard curve prepared with gallic acid solution (Sigma Chemical). The total phenolic content was expressed as milligrams of gallic acid equivalents per gram of fresh weight (mg GAE g-1 FW). Ferric Reducing Antioxidant Power (FRAP) assay. This assay gives an indication of the reducing ability of the plant extract. This assay was developed using the experimental protocol described by Benzie and Strain (1996), but modified in terms of time lapse; the reaction was evaluated at 4, 30 and 60 min. The FRAP reagent was freshly prepared and contained 1020 μL of 300 mM sodium acetate pH 3.6, 100 μL of 10 mM TPTZ (Sigma Chemical), and 100 μL of 20 mM ferric chloride. The FRAP reagents were mixed with 10 μL aliquots of each extract. Then the mixture was incubated at 37 ºC for 4, 30 and 60 min; after this time, the absorbance was read at 593 nm using a UV-Vis spectrophotometer (Unicam Heλio α). The FRAP value was determined by plotting in a standard curve produced by the addition of ferrous sulphate (Merck, Darmstadt, Germany) to the FRAP reagent. Results were expressed as μmol Fe+2 per gram of fresh weight (μmol Fe+2 g-1 FW). Mineral composition Preparation of samples for minerals. The elements analyzed were: N, P, K, Ca, Mg and Na and trace elements: Cu, Fe, Mn, Zn, Ni, Pb and Cd. The preparation of the samples for the analyses was developed using the experimental protocol proposed by Sadzawka et al. (2007). Samples of apple peel, pulp and whole fruits were dried in an oven at 70 °C for 24 h. Then, 0.3 g of dried samples were weighed in digestion flasks and treated with 18 mL of distilled water, 100 mL of sulfuric acid (96%, d = 1.84 kg L-1) and 6 g of salicylic acid. After 12 h, the flasks were heated for 2 h on an electric hot plate at 200 °C, then the temperature was increased to 400 °C and hydrogen peroxide (25-30%) was added to the sample to complete the digestion. Then, 10 mL of distilled water were added and the samples were agitated until a clean solution was obtained. After cooling, the solution was filtered with Whatman No 42 filter, transferred to a volumetric flask and diluted to a final volume of 50 mL with distilled water. Preparation of standards and analysis of samples. The analyses of the samples were done using the experimental method protocol proposed by Sadzawka et al. (2007). Standard solutions of N, P, K, Mg, Na, Ca, Fe, Cu, Mn, Zn, Ni, Pb and Cd were prepared from the stock standard solutions containing 1000 mg L-1 of the element in distilled water. In each analytical batch, at least five reagent blanks and three international reference materials were included, to assess precision and accuracy for chemical analysis. Calibration and measurement of all of the above mentioned elements (except N and P) were done on an atomic absorption spectrometer (Varian AA 240, Palo Alto, California, USA), using the flame method with air and acetylene. The calibration curves were prepared for each element individually applying linear correlation. A blank reading was also taken and necessary correction was made during the calculation of the concentration of the various elements. The N and P content were estimated with a molecular absorption spectroscopic method. The absorbance was measured using a UV-Vis spectrophotometer (Jenway 6500, Felsted, UK), at 650 nm for N and 466 nm for P. The measurement was compared to a standard curve prepared with N-NH4 and P-PO4 solutions as standards, respectively. Nutrient concentration of each element was expressed as mg 100 g-1 FW. Statistical analysis Parameters evaluated used a completely randomized design with factorial arrange of 5 x 3, where the principal factor was the cultivar and the secondary factor was the fruit tissue. We used three repetitions and all the analyses were run in triplicate. All results were expressed as mean ± standard error (SE). These evaluations were performed by one-way ANOVA and statistical significance by Student's t test was carried to test any significant differences among means. The correlation values were examined using Pearson correlation. All statistical analysis and correlations were made with SAS® (Version 8.0, SAS Institute, 1999). Differences at P < 0.05 were considered significant. RESULTS AND DISCUSSION The results obtained indicated that apple weight and the proportion of each fruit tissue varied significantly (Table 1). The proportion of apple peel is in agreement with those reported by Łata (2007) and Łata and Tomala (2007). There was a high and significant correlation between apple weight and the proportion of apple peel (r = 0.78). On the other hand, we obtained a weak correlation between the proportion of apple pulp and apple core with apple weight (r = 0.43 and r = 0.34, respectively). In contrast with our results, Łata and Tomala (2007) found a weak correlation between fruit weight and the peel proportion. Table 1. Fruit weight and proportion of fruit tissues in the apple cultivars studied.
Mean of 10 replicates of each cultivar ± standard error
(SE) Physical-chemical characteristics The physical-chemical characteristics of apple peel, pulp and whole fruit in the five cultivars, are shown in Table 2. Table 2. Physical-chemical parameters of fruit tissues for different apple cultivars1, 2, 3.
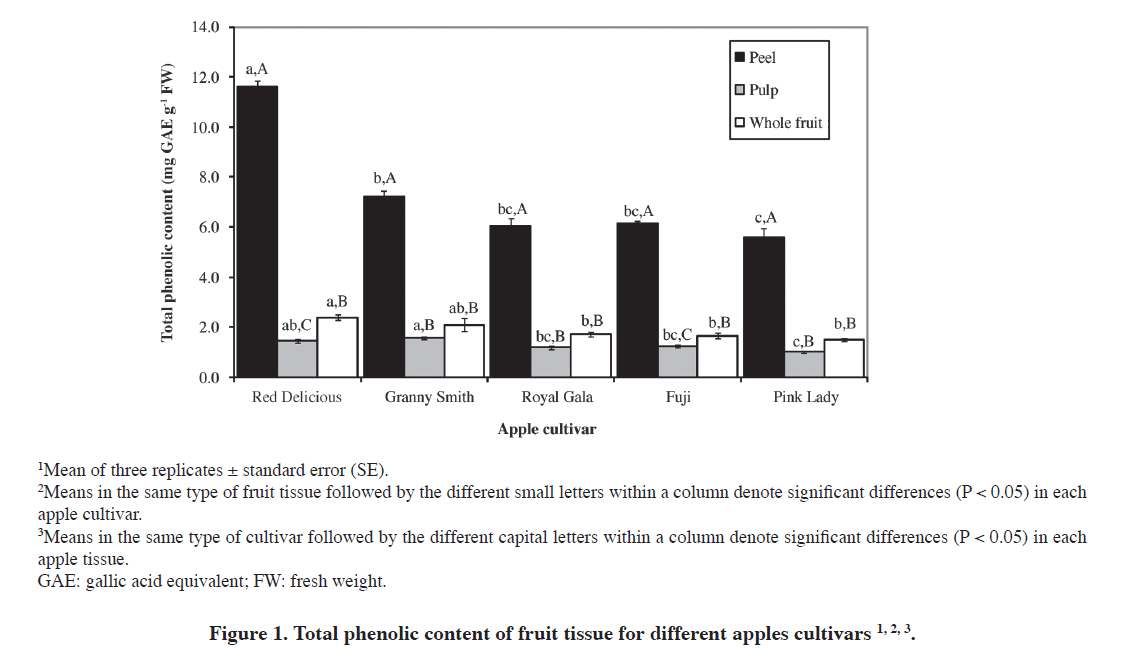
1Mean of three replicates ± standard error (SE) Dry weight differed significantly depending on the fruit tissues and cultivars, except on the whole fruit we not observed significantly differences between the cultivars evaluated. The dry weight of apple peel was significantly greater than whole fruit and pulp within all cultivars. Cultivars differed considerably in the content of dry weight in apple peel and pulp. No differences between cultivars were observed in the whole fruit. ‘Red Delicious’ apple peel had the highest dry weight in comparison with the peel of the other cultivars studied. Our results of the content of dry weight in apple peel and the whole fruit are in accordance with the data obtained by Łata (2007). However, apple peel DM was higher than the values reported by Vieira et al. (2009b). The pH was significantly different depending on the apple cultivars and fruit tissues. The pH of apple peels was significantly higher than other fruit tissues, followed by whole fruit and pulp. The fruit tissues of cvs. Pink Lady and Granny Smith presented the lowest value, in comparison to the other cultivars studied. Our results are in agreement with Wu et al. (2007), who obtained similar values of pH in the whole fruit, and found that ‘Granny Smith’ presented the lowest value, in comparison with the other cultivars evaluated. However, the pH of apple peel was higher than the values reported by Vieira et al. (2009b). The acidity was significantly different depending on apple cultivars and fruit tissues. The acidity of apple pulp was the highest, followed by whole fruit and peel. Apple peel has the lowest significant value in all the cultivars evaluated. ‘Granny Smith’ fruit tissues presented the highest acidity, in comparison with the fruit tissues of the other cultivars evaluated, followed by ‘Pink Lady’, ‘Royal Gala’, ‘Red Delicious’ and ‘Fuji’. In agreement with our results, Drogoudi et al. (2008) reported that the total acid content of the pulp was highest in ‘Granny Smith’, in comparison to the other cultivars evaluated. In addition, Vieira et al. (2009b) reported similar values in apple peel. The soluble solids (SS) content was significantly different depending on the apple cultivars in all the fruit tissues. Only in ‘Red Delicious’ and ‘Pink Lady’ we observed significant differences between fruit tissues. The SS content of apple pulp was the highest, while apple peel had the lowest content. In agreement with our results, Wu et al. (2007) reported similar values of SS content of the whole fruit. The fruit tissues of ‘Pink Lady’ presented the highest content of SS, in comparison to the fruit tissues of the other cultivars studied, followed by ‘Red Delicious’, ‘Royal Gala’, ‘Fuji’ and ‘Granny Smith’. Similarly, Drogoudi et al. (2008) found that ‘Granny Smith’ flesh contained the lowest SS content, in comparison to the other cultivars studied. Additionally, Vieira et al. (2009b) reported similar values of total soluble solids in apple peel. Color directly affects the appearance and the consumer acceptability of fruit. The results indicate that color parameters of apple peel and pulp were significantly different among the five cultivars evaluated (Table 3). In agreement with us Drogoudi et al. (2008) reported that the apple cultivars had different coloration in peel and flesh. ‘Red Delicious’ peel was darker red (lower L*, b* and Hue values and higher a* values), compared to ‘Pink Lady’ peel that was light and pink in color (intermediate L* and b* values; higher a* values; and lower Hue values). The bi-colored ‘Fuji’ peel was red with green and yellow patches (intermediate L*, a*, b* and Hue values). ‘Royal Gala’ peel was light and the color was almost yellow with red patches (intermediate L*, a*, b* and Hue values). ‘Granny Smith’ peel was green and lighter (higher L*, b* and Hue values and negative a* values). In pulp tissue, ‘Red Delicious’ and ‘Royal Gala’ were lighter and yellow (higher L* and b* values; and intermediate a* and Hue values); ‘Granny Smith’ pulp was darker and green (lower L*, b* and a* values; and higher Hue). ‘Fuji’ had similar color pulp than ‘Royal Gala’, but it was brighter (lower L* and Hue values and higher b* and a* values). ‘Pink Lady’ pulp was light and red (higher L* and a* values; intermediate b*; and lower Hue values). Table 3. Color parameters L*, a*, b*, Hue and Chroma, of fruit tissue for different apple cultivars1, 2, 3.
1Mean of six replicates ± standard error (SE) The difference obtained in these parameters could be explained by different cultivars and growing condition. In effect, it is also well known that the genotype is the main factor that affects quantitatively and qualitatively the physical-chemical properties. In addition, the environmental factors, the agronomic practice, the post-harvest condition or the processing also affect these parameters (Wu et al., 2007; Vieira et al., 2009b). Total phenolic content The total phenolic content (TPC) of apple peel, pulp, and whole fruit of all cultivars was determined using the Folin-Ciocalteau method. This method allows the estimation of all the flavonoids, anthocyanins and non-flavonoid phenolic compounds that is, of all the phenolics present in the samples (Benvenuti et al., 2004). The TPC significantly differed depending on apple cultivar and fruit tissue (Figure 1). Apple peel fraction showed a higher significant TPC than pulp (4.6 to 8.1 fold) and whole fruit (3.5 to 4.9 fold). These results are in accordance with previous reports, which have shown that apple peel has a higher TPC compared to other edible parts of this fruit (Wolfe et al., 2003; Łata, 2007; Łata and Tomala, 2007; Drogoudi et al., 2008; Khanizadeh et al., 2008; Vieira et al., 2009a). However, in contrast to our results, Gorinstein et al. (2001) reported that the TPC of apple peel was higher than in whole fruit and in pulp, but these differences were not significant (P > 0.05). In agreement with our data, different researches reported that depending on cultivar, apple peel contains about two to nine times more TPC, than their pulp (Hassimotto et al., 2005; Drogoudi et al., 2008). In peel, the highest TPC was found in ‘Red Delicious’, followed by ‘Granny Smith’ and ‘Fuji’, whereas the lowest values were found in ‘Royal Gala’ and ‘Pink Lady’. This is in agreement with the results of Tsao et al. (2003), who reported that ‘Red Delicious’ apple peel had the highest TPC, in comparison to the other cultivars studied. This higher content could be principally due to the presence of the mixture of different cyanidin glycosides, of which cyanidin 3-galactoside is the main one, followed by traces of cyanidin 3-glucoside, 3-arabinoside, 3-xyloside, and 7-arabinoside (Tsao et al., 2003; Wolfe et al., 2003). The highest TPC in pulp was found in ‘Granny Smith’, followed by ‘Red Delicious’, whereas the lowest values were found in ‘Fuji’, ‘Royal Gala’ and ‘Pink Lady’. In whole apple fruit, the greatest TPC was found in ‘Red Delicious’, followed by ‘Granny Smith’ and ‘Royal Gala’, whereas the lowest values were found in ‘Fuji’ and ‘Pink Lady’. Similar results reported Lotito and Frei (2004), who found that ‘Red Delicious’ extract (prepared from whole fruit) exhibited the highest TPC, followed by ‘Granny Smith’ and ‘Fuji’. In addition, Imeh and Khokhar (2002) and Wu et al. (2004) found that ‘Red Delicious’ was a rich source of TPC. FRAP assay Besides anthocyanins, other flavonoids, phenolic acids and vitamins can contribute to the protective effect against oxidative damage to cells. Since the antioxidant capacity of individual dietary compounds cannot always be evaluated, the determination of the total antioxidant capacity allows a more realist evaluation of the potential protective effect of a food (Cordenunsi et al., 2005). Several in vitro methods have been developed to assess the total antioxidant capacity of fruits, vegetables and beverages. One of this, is the FRAP assay. This is a colorimetric method based on the reduction of a ferric-tripyridyltriazine (TPTZ) complex to its ferrous form. This reduction originates an intense blue complex with an absorption maximum at 593 nm (Benzie and Strain, 1996). The FRAP assay is a simple, convenient and reproducible method that was initially developed to measure the plasma antioxidant capacity, but is now widely employed in the antioxidant studies of other biological samples, such as food, plant extracts, juices and beverages, etc. (Pulido et al., 2000). The current experimental protocol has established that an interval of 4 min and a temperature incubation of 37 ºC would be suitable conditions to assay the total antioxidant capacity of most samples, because the redox reactions proceed so rapidly that all reactions are complete. However, the application of such experimental conditions, to samples of dietary antioxidants, fruits, vegetables and beverages, is not suitable to assess their total Fe-TPTZ-reducing capacity. This implies that the FRAP values can vary tremendously depending on the time scale of analysis (Pulido et al., 2000; Imeh and Khokhar, 2002; Henríquez et al., 2008). The antioxidant capacity of apple peel, pulp, and whole fruit of all cultivars, in the three times evaluated, expressed as FRAP value, are shown in Table 4. FRAP value was significantly different depending on the apple cultivar and the fruit tissue evaluated. After 4 min reaction, the peel fraction showed a significantly higher antioxidant capacity than pulp (3.6 to 7.9 fold) and whole fruit (3.2 to 5.0 fold). We found similar results after 30 and 60 min incubation. Peel had the highest significant FRAP value followed by peel pulp (4.5 to 9.1 and 3.9 to 9.3 fold, at 30 and 60 min of reaction, respectively) and whole fruit (3.7 to 5.7 and 3.6 to 5.8 fold, at 30 and 60 min of reaction, respectively). These results indicate that the most reactive antioxidants are present in the peel fraction, which are in agreement with previous works (Wolfe et al., 2003; Chinnici et al., 2004; Hassimotto et al., 2005; Tsao et al., 2005; Drogoudi et al., 2008; Khanizadeh et al., 2008; Vieira et al., 2009a). Also, several authors (Wu et al., 2004; Halvorsen et al., 2006) have determined that apple with peel had a higher antioxidant capacity than apples without peel. This is in agreement with our results, since the whole fruit had higher FRAP value than pulp in the three times evaluated. In addition, different researches (Chinnici et al., 2004; Drogoudi et al., 2008) have reported that the antioxidant capacities of apple peel were two to nine times greater than apple pulp. Table
4. Antioxidant capacity of
fruit
1Mean of three replications ± standard error (SE); FRAP:
Ferric Reducing Antioxidant Power. The sample ranking was affected by the time of reaction. In apple peel, at 4 min of reaction, ‘Red Delicious’ was significantly the highest (1.5 to 2.0 fold) followed by ‘Granny Smith’, ‘Royal Gala’, ‘Fuji’ and ‘Pink Lady’. However, this order was different after 30 or 60 min of reaction, because among the five cultivars, the FRAP values decreased in the following order: ‘Red Delicious’ > ‘Fuji’ > ‘Granny Smith’ > ‘Royal Gala’ > ‘Pink Lady; however the differences between Fuji, Granny Smith and Royal Gala were not significantly in the three times evaluated (P > 0.05). These results imply that, due to the complex oxidation kinetics of plant phenolics, reaction must proceeds for more than 10 min, and in this case reaction times of 60 min are necessary to determine total antioxidant capacity and the order ranking of the samples studied. In pulp and whole fruit, the sample ranking was not always affected by the time of reaction. In pulp, the sample ranking was the same at 4 and 60 min of reaction, and in these times, ‘Royal Gala’ pulp was the highest (1.1 to 1.7 and 0.8 to 1.7 fold, at 4 and 60 min of reaction, respectively), followed by: ‘Granny Smith’, ‘Red Delicious’, ‘Fuji’ and ‘Pink Lady’; however, we observed significant differences in some of them (for example: Granny Smith was different from Fuji at 4 min, but at the 60 min this difference was not significant, P > 0.05). Similar observations were obtained in the whole fruit. Among the five apple cultivars studied, ‘Red Delicious’ peel had the highest FRAP value and ‘Pink Lady’ peel had the lowest. This result is consistent with the TPC determined in these cultivars. The highest antioxidant capacity of ‘Red Delicious’ peel is in agreement with the results reported by Tsao et al. (2005). Similar to our results, Lotito and Frei (2004) reported that ‘Red Delicious’ extract exhibited the highest FRAP value, in comparison to ‘Fuji’ and ‘Granny Smith’. However, in contrast to our dates, Halvorsen et al. (2006) found that among the cultivars analyzed, ‘Granny Smith’ had the highest FRAP value, followed by ‘Red Delicious’, ‘Gala’ and ‘Fuji’; and Imeh and Khokar (2002) reported that ‘Red Delicious’ had a lower antioxidant capacity evaluated by the FRAP assay, in comparison to the other cultivars studied. These differences could be explained by fruit growing condition, or analytical method, such as the solvent used to prepare the apple extract. In addition, environmental factors, agronomics practice such as irrigation or fertilization, postharvest conditions and processing, have a marked effect on the phenolic content of plant foods, and these factors may have a significant role in determining the phenolic composition and the bioactivity of these compounds. Mineral composition The main and trace elements content of apple peel, pulp and whole fruit of all cultivars, are shown in Table 5 and 6, respectively. In most of the elements evaluated, their content was significantly different depending on the cultivar and the fruit tissue evaluated. Apple peel fraction showed a higher significant mineral content, followed by whole fruit (1.3 to 4.7 fold) and pulp (1.7 to 8.8 fold). These results are in accordance with a previou report which had shown that apple peel had a higher content of mineral compared to other edible parts of this fruit (Gorinstein et al., 2001). The average mineral content indicates that, except Cu and Fe, the whole fruit has more minerals than the pulp (1.1 to 1.9 fold). Similar results were reported by Gorinstein et al. (2001), who determined that whole apple fruit contains a higher amount of minerals compared to apple pulp. The result showed that the samples evaluated contained high amounts of K, N, Mg, Ca, P and Na, which were the most abundant elements. The values for Na, K, Mg, Ca, Fe, Mn, Zn and Cu in peel, whole fruit, and pulp are different to the dates reported by Gorinstein et al. (2001). These differences could be explained by different cultivars studied, growing conditions, and methodology used to determine the mineral composition. At the consumer level, a high intake of Ca, Mg and K, together with a low Na intake, is associated with protection against bone demineralization, arterial hypertension, insulin resistance, and overall cardiovascular risk (Segura et al., 2006). Independently of the fruit tissue, K and N concentrations showed greater variation amongst the different apple cultivars analyzed. Among the five apple cultivars, ‘Red Delicious’ peel had the highest N, Ca and Mg content; ‘Granny Smith’ peel had the highest P content; ‘Fuji’ peel had the highest K content and ‘Royal Gala’ peel had the highest Na content. Trace elements can be classified as potentially toxic (Cd, P, Hg), probably essential (Ni, Co) and essential (Cu, Zn, Fe, Mn) (Duran et al., 2008). According to the data obtained, Fe has the highest concentration, followed by Mn, Cu, and Zn. These microelements are involved in many biochemical processes supporting life. Among the five cultivars studied, ‘Fuji’ peel had the highest content of Fe and Cu; however, these differences were not significant (P > 0.05). ‘Red Delicious’ peel had significantly the highest content of Mn, and ‘Royal Gala’ the highest content of Zn (P < 0.05). Ni, Pb and Cd were not detected on the fruit tissues evaluated. These elements not only affect the nutritive values of fruits and vegetables, but also have deleterious effects on human health, because for example: they can cause mental retardation and semi-permanent brain damage or cause dysfunction in the lungs, liver, bone or kidneys (Duran et al., 2008). Table 5. Element content of fruit tissues for different apple cultivars1, 2, 3.
1Mean of three replicates ± standard error (SE); FW: fresh
weight Table 6. Trace elements content of fruit tissues for different apple cultivars1, 2, 3.
1Mean of three replications ± standard error (SE); FW:
fresh weight. Correlations There was a strong, positive and significant correlation between FRAP value and total phenolic content, at 4, 30 and 60 min of reaction in peel and whole fruit (Table 7). This implies that the FRAP value of this extract depends on the content of phenolic compounds; and this value could partially determinate the antioxidant capacity, due to the synergistic effect of level and type of phenolic compounds that constitute the apple sample. However, a lower, positive and not significant correlation was found in apple pulp at 4 min; but this correlation was weak, positive and significant at 30 and 60 min of reaction. These results could indicate that other compounds than polyphenols, such as vitamin antioxidants, or other unquantified phenolics and/or synergism among these compounds and major phenolics, could be contributing to the antioxidant capacity of these samples (Imeh and Khokhar, 2002). Literature reports on the relationship between TPC and antioxidant capacity (FRAP) are contradictory; while some authors have observed a high correlation (Proteggente et al., 2002; Tsao et al., 2005; Khanizadeh et al., 2007; 2008); others found a weak correlation (Imeh and Khokhar, 2002; Khanizadeh et al., 2007; 2008). Table 7. Correlation coefficients (r) between total phenolic content and antioxidant capacity FRAP evaluated at 4, 30 and 60 min of reaction1, 2.
1The correlation coefficient (r) and the corresponding significance
values (P) are indicated. Considering apple fruit tissues and total phenolic content, there was a weak but significant correlation between peel and pulp, peel and whole fruit, and pulp and whole fruit (data not shown). Different results were reported by Drogoudi et al. (2008), who found that the total phenolic content of the peel was not correlated with the total phenolic content of the pulp. Furthermore, when we considered the antioxidant capacity FRAP evaluated at 4, 30 and 60 min, the correlation analysis showed a weak but significant correlation between apple peel and pulp with the whole fruit; and a lower and not significant correlation between apple peel and pulp (data not shown). Similarly, Drogoudi et al. (2008) found that the antioxidant capacity of the apple peel was not correlated with the antioxidant capacity of the pulp. Table 8 shows the correlation coefficient between the physical-chemical parameters (dry weight, pH, acidity and soluble solids) and the TPC and the FRAP antioxidant capacity evaluated at 4, 30 and 60 min. Correlation analysis showed that in the three fruit tissues studied, most of the coefficient correlations were lower, positive and not significant. However, the correlation between the soluble solids content of apple pulp and the FRAP antioxidant capacity at 4, 30 and 60 min was weak, positive and significant. These results indicate that the physical-chemical parameters do not have a relationship with the antioxidant content and capacity in this fruit. Similar results were reported by Drogoudi et al. (2008) and Vieira et al. (2009b). Table 8. Correlation coefficients (r) between physical-chemical parameters and the total phenolic content and antioxidant capacity FRAP evaluated at 4, 30 and 60 min1, 2.
1The correlation coefficient (r) and the corresponding significance
values (P) are indicated. Table 9. Correlation coefficients (r) between the color parameters L*, a*, b*, Hue and Chroma and the total phenolic content and antioxidant capacity FRAP evaluated at 4, 30 and 60 min1, 2.
1The correlation coefficient (r) and the corresponding significance
values (P) are indicated. Correlation analysis between color parameters and TPC and antioxidant capacity are shown in Table 9. In apple peel, the coefficient correlation obtained indicates a higher, positive and significant correlation between L* values and the TPC and the antioxidant capacity FRAP, evaluated at 4, 30 and 60 min. In the case of b* and chroma values, the results showed a weak, positive and significant correlation. This is in contrast with the results of Drogoudi et al. (2008), who obtained a negative linear correlation between the b* color value and the total antioxidant capacity and TPC. We obtained a lower and not significant correlation with a* and Hue values. Different results were obtained by Vieira et al. (2009b), who reported a negative and not significant correlation between color parameters and TPC and antioxidant capacity. In the other hand, the results indicate a weak, positive and significant correlation between the pulp color parameters L*, a*, b*, Hue and chroma and the TPC. The correlation between the total antioxidant capacity FRAP and b* and chroma values was higher, positive and significant. However, these correlations were lower, positive and not significant with L*, a* and Hue values. In the case of element composition, the correlation between each element evaluated and the antioxidant capacity or TPC, in some cases was high and significant, but in other cases was weak and not significant (data not shown). The correlation analysis between physical-chemical parameters and apple fruit tissues showed that dry matter had a low and not significant correlation between the three fruit tissues evaluated. The analysis of pH and acidity showed that a high, positive and significant correlation existed between the three fruit tissues studied (data not shown). With the soluble solids content, the results reported a high, positive and significant correlation between pulp and whole fruit; and a weak, positive, but significant correlation between peel with pulp and whole fruit (data not shown). In the case of color parameters, the correlations obtained between peel and pulp, indicate a high, positive and significant correlation with the parameter Hue; a weak, positive, but significant correlation with the parameters a* and b*; and a low, positive and not significant correlation with the parameters L* and chroma (data not shown). In contrast to our results, Drogoudi et al. (2008) reported that the peel color parameters were not correlated with the flesh color parameters. Finally in the case of mineral composition, the results were contradictory, because in some cases we found an association between the fruit tissues, but in other cases these associations were weak and not significant (data not shown). CONCLUSIONS This study demonstrated that physical-chemical characteristics, total phenolic content, antioxidant capacity and mineral composition vary among apple cultivars and fruit tissues analyzed. Of the five tested cultivars, ‘Red Delicious’ (peel and whole fruit) had the highest antioxidant content and capacity, being the richest source of antioxidant compound, which indicates that the fruit should be consumed with peel. Placing attention on the health protective compounds found in apple peel, this fraction has a high potential to be used as an ingredient in foods or beverages formulation or used as a valuable source of natural antioxidant. Additionally, the use of this solid waste could reduce environmental impact through the liberation of this amount of by-product. Finally, the associations found in this study can give information to consumers in helping to recognize a more nutritional apple. ACKNOWLEDGEMENTS The authors wish to acknowledge CONICYT (Comisión Nacional de Investigación Científica y Tecnológica) for a doctorate scholarship to C. Henríquez and SURFRUT Company for the apple samples. LITERATURE CITED
The following images related to this document are available:Photo images[cj10058t5.jpg] [cj10058f1.jpg] [cj10058t9.jpg] [cj10058t4.jpg] [cj10058t3.jpg] [cj10058t8.jpg] [cj10058t1.jpg] [cj10058t2.jpg] [cj10058t7.jpg] [cj10058t6.jpg] | ||||||||||||||||||||||||||||||||||||||||||||||||||||||||||||||||||||||||||||||||||||||||||||||||||||||||||||||||||||||||||||||||||||||||||||||||||||||||||||||||||||||||||||||||||||||||||||||||||||||||||||||||||||||||||||||||||||||||||||||||||||||||||||||||||||||||||||||||||||||||||||||||||||||||||||||||||||||||||||||||||||||||||||||||||||||||||||||||||||||||||||||||||||||||||||||||||||||||||||||||||||||||||||||||||||||||||||||||||||||||||||||||||||||||||||||||||||||||||||||||||||||||||||||||||||||||||||||||||||||||||||||||||||||||||||||||||||||||||||||||||||||||||||||||||||||||||||||||||||||||||||||||||||||||||||||||||||||||||||||||||||||||||||||||||||||||||||||||||||||||||||||||||||||||||||||||||||||||||||||||||
| |||||||||
