 |
| About Bioline | All Journals | Testimonials | Membership | News |
|
||||||
|
||||||
Chilean Journal of Agricultural Research, Vol. 70, No. 4, 2010, pp. 633-639 RESEARCH Cocoa Bean (Theobroma cacao L.) Drying Kinetics Cinética del Secado de Cocoa (Theobroma cacao L.). Ndukwu MacManus Chinenye1*, A.S. Ogunlowo2, and O.J. Olukunle2 1Michael
Okpara University of Agriculture, Department of Agricultural
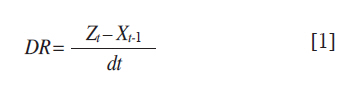
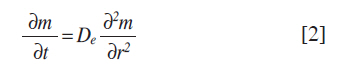
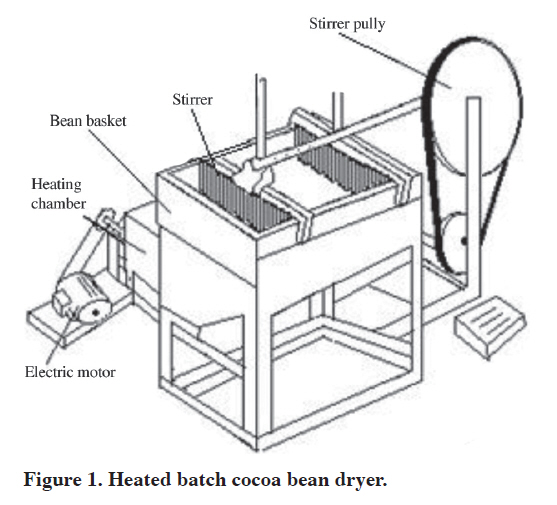
Engineering, Umudike P.M.B. 7267, Umuahia Abia State, Nigeria. Received: 2 December 2009. Accepted: 13 April 2010.0 Code Number: cj10071 ABSTRACT Cocoa (Theobroma cacao L.) is widely produced in West Africa and South America and is a great economic tree crop, with so many industrial uses. In this work, the experimental drying kinetics of foreign species was investigated, and the experiments were carried out under isothermal conditions, using heated batch drier at 55, 70 and 81 ºC. The moisture ratio data obtained from change of moisture content with the drying time was fit to two thin layer drying model with good results. A faster drying process was observed at a higher drying temperature resulting in higher drying rates which is advantageous when evaluating costs. Fick’s second law of diffusion was used to predict effective diffusivity using experimental data assuming that the variation of diffusivity with temperature can be expressed by an Arrhenius type function, and the values of diffusivity obtained ranged from 6.137 x 10⁻¹⁰ to 2.1855 x 10⁻⁹ m2 s-1 for the temperature used. The Arrhenius constant (D) is predicted at 8.64 x 10⁻⁴ m2 s-1 while the activation energy was predicted at 39.94 kJ mol-1. Key words: Moisture content, drying temperature, diffusivity, moisture ratio, equilibrium moisture content. RESUMEN El cacao (Theobroma cacao L.) es ampliamente producido en el Oeste de África y Sudamérica y es un cultivo de gran importancia económica, con muchos usos industriales. En este trabajo se investigó la cinética del secado experimental de especies foráneas, y se realizaron experimentos bajo condiciones isotérmicas, usando un secador discontinuo en caliente a 55, 70 y 81 °C. Los datos de relación de humedad obtenidos desde el cambio de contenido de humedad con el tiempo de secado se ajustaron a un modelo de secado de dos capas delgadas con buenos resultados. Se observó un proceso de secado más rápido a una temperatura de secado mayor resultando en mayores tasas de secado, lo que es ventajoso al evaluar costos. La segunda ley de difusión de Fick se usó para predecir difusividad efectiva usando datos experimentales, asumiendo que la variación de difusividad con la temperatura puede ser expresada por una función tipo Arrhenius, y los valores de difusividad obtenidos variaron de 6,137 x 10-10 a 2,1855 x 10⁻⁹ m2 s-1 para la temperatura usada. La constante de Arrhenius (D) predicha fue 8,64 x 10⁻⁴ m2 s-1 mientras la energía de activación predicha fue 39,94 kJ mol-1. Palabras claves: contenido de humedad, temperatura de secado, difusividad, relación de humedad, contenido de humedad de equilibrio. INTRODUCTION Cocoa (Theobroma cacao L.) is a perennial cash crop and its natural habitat is the humid tropics (Ndukwu, 2009). In most tropical countries, agricultural products like cocoa are harvested all the year round and the beans must be dried immediately after fermentation to reduce mass losses and prevent spoilage. The end products from cocoa bean especially chocolate and beverages are considered among the basic food in many countries of the world; however the quality of these end products is a function of how they are processed. The fermentation and drying of this crop are the major critical steps in the sequence of its processing. Drying can be achieved naturally by making use of solar energy or artificially by using heated cocoa bean dryers. However farmers are weary of the problem of excessive drying and quick drying of cocoa beans by heated dryers; because cocoa is sold by weight, excessive drying will not be economical in terms of amount of money received by farmers. It will also increase the energy costs while quick drying will prevent the chemical processes started during fermentation to be completed since curing is important in cocoa drying because acetic acid is mainly produced by oxidation of ethanol in the presence of oxygen by acetic acid bacteria. During drying, this acid is evaporated off along with the moisture removal process due to its volatile nature. However, the lactic acid contained inside cannot be evaporated off since it is a less volatile compound; therefore curing solves this problem. Cocoa beans are dried by either spreading the beans to form a thin layer so that much of their body is exposed to ambient air or forming a deep bed, therefore models try to imitate any of this. Some of the thin layer models have been modified and adapted to simulate drying kinetics of many kinds of bio materials. Modeling of the drying kinetics can be carried out using semi-theoretical (Verma et al., 1985; Midilli et al., 2002; Doymaz, 2005; Kaya et al., 2007; Demir et al., 2007; Karaaslan and Tunçer, 2008), Fick’s theoretical model (Jain and Pathare, 2007; Janjai et al., 2008) and empirical models (Abalone et al., 2006). Hii et al. (2009b) stated that studies on the kinetics of cocoa drying are scarce. In the past, various studies have mainly been concerned with the design and performance of driers (Allison and Kenten, 1964; Faborode et al., 1995). Fotso et al. (1994) and Wan Daud et al. (1996) also reported the characteristic drying curves of cocoa beans at various external conditions with critical moisture contents identified in their studies. Ndukwu (2009) reported the effect of the drying air temperature and air velocity on the drying rate and drying constant of cocoa beans. He generated an empirical equation for calculating the drying constant during the falling rate period and concluded that temperature has greater effect. Most crops exhibit the constant rate drying characteristics at their critical water content; therefore cocoa is not an exception. However, Bravo and McGaw (1974; 1982) and Baryeh (1985) stated that cocoa exhibits constant rate behaviour during drying, from a moisture content of 70-100% dry base (db). Therefore most cocoa drying follows the falling rate characteristics since the initial water content hardly reaches the critical value and most of the drying models simulate this characteristic. According to Brooker et al. (1992) many researchers have modified and used different models (Lewis equation, logarithmic models, differential models, stationary bed models, etc.) to achieve some results in simulating thin layer of drying bio materials. The Lewis equation which has been severally modified (Ayensu, 1997; Yaldiz et al., 2001; Akpinar et al., 2003; Togrul and Pehlivan, 2004; Demir et al., 2007) provides simple and clear analytical solution to the moisture content and time relationship in thin layer drying of bio materials. According to Brooker et al. (1992), the problem of the Lewis equation is a high drying rate, but proper prediction of drying constants can solve this problem. The present study was undertaken to study the drying kinetics of cocoa (frosterous species) in a heated batch cocoa bean dryer, to calculate the effective diffusivity of the samples and to fit the experimental data to thin-layer drying models. Hii et al. (2009a; 2009b) have tried to establish some drying kinetics of cocoa bean but they dried the cocoa beans with an oven which is different from most heated batch cocoa bean driers and does not simulate the natural drying condition were cocoa is stirred to achieve uniformity in drying. Therefore the objectives of this research were to establish the drying characteristics of cocoa bean dried with a heated batch cocoa bean dryer which is stirred to achieve uniformity in drying, to determine the effective diffusivity of cocoa bean under this condition, and to fit the results with an existing thin layer drying models to predict the moisture behaviour of cocoa beans in a heated batch cocoa bean dryer. MATERIAL AND METHODS Experimental evaluation procedures To determine the experimental drying curves the cocoa beans about 5 cm deep were left in the heated batch dryers (Figure 1) at constant temperatures of 55, 70, 81 ºC and 2.51 m s-1 drying air velocity. The drying air temperature was controlled with a thermostat attached to the heating element of the dryer, which was previously calibrated to read its maximum at the drying air temperature and turn off heating if maximum threshold is exceeded. Drying air velocity is determined with a vane anemometer equipped with a multimeter. The initial moisture content of cocoa bean used was 56.6% db. The beans were continuously stirred with the stirring mechanism, which moves on a rail beside the bean basket attached to the drier to achieve uniform drying. Drying was continued until the final moisture content of the samples reached approximately 6% db. At regular time intervals, drying samples were taken out and an oven (Uniscope SM 9023, England) was used to determine the moisture water content on dry basis (db) according to ASAE Standard S358.2 (1983). During the experiments, ambient temperature and relative humidity were recorded. Drying rates The average values of moisture changes in the total drying times were calculated using equation presented by Hu et al. (2006) and expressed as g water g-1 dry solids h-1. Where Zt and Zt-1 are the water contents of the dried sample at time t and the fresh samples Process modeling In the simulation of bed of bio materials, the bed is divided into layers of thickness dx each. Drying is achieved by continuously passing heated or unheated air through the static bed of material in one direction. From the first layer the drying air evaporates moisture to the next layer. As the air absorbs moisture its temperature decreases and the ability to pick up moisture also decreases (Arinze et al., 1996). A bed consisting of a number of layers is simulated by calculating the air and moisture losses as the drying air passes from one layer to the next. Each layer dries to the equilibrium condition in a short interval and the exhaust air from one layer is used as an input air to the next. The drying procedure continues for a number of time intervals until the desired moisture water content is achieved. The drying rate of cocoa bean is defined by the diffusion of moisture from the inside to the surface layer, which can be represented by Fick’s second law of diffusion for un-steady state diffusion. Assuming that the cocoa bean can be approximated to spheres, the diffusion is expressed as (Guiné and Fernandes, 2005):
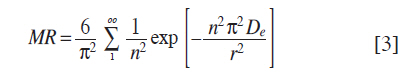
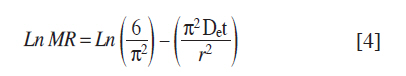
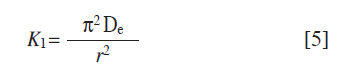
where r is the radius of equivalent sphere (m) and t is the time (s), De is effective diffusivity (m2 s-1). Assuming uniform initial moisture content and a constant effective diffusivity throughout the sample, Crank (1999) gave the analytical solution of Equation [2] for spherical object as follows: where m–ms/mo–ms is the moisture ratio (MR), r is the radius of equivalent sphere, t is the time and De is the effective diffusivity. Setting n = 1, for long period of drying Equation [3] can be made linear (Riva and Peri, 1986; Doymaz, 2005) as follows:
Effective diffusivity was gotten from the plot of LnMR data against time (s) data with a slope K1 (Lomauro et al., 1985; Doymaz, 2005) as follows:
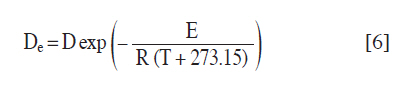
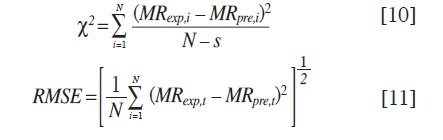
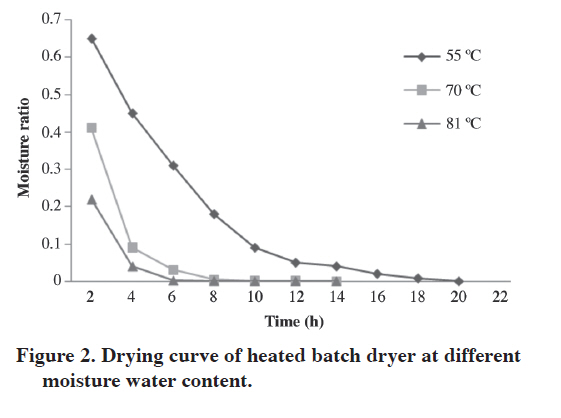
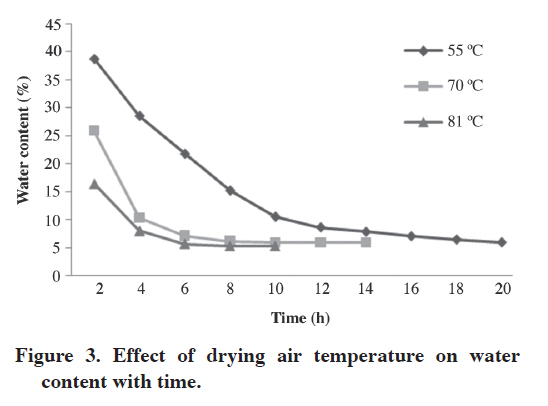
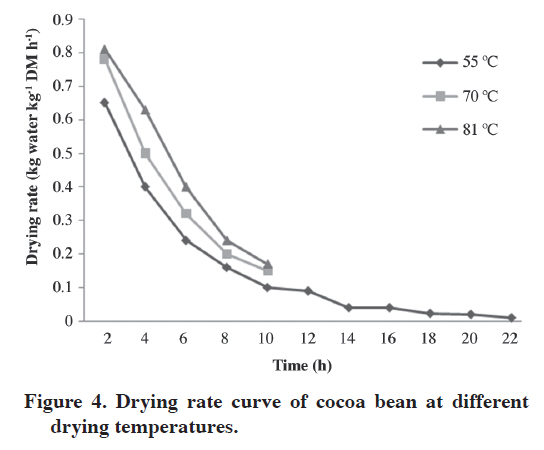
The diffusion coefficient considered that the effective diffusivity varies with temperature according to an Arrhenius function, of the type: where D is the diffusivity coefficient for an infinite temperature, E is the activation energy for moisture diffusion, R is the gas constant (R = 8.314 J mol-1 K-1) and T is the drying temperature (º C) (Guiné and Fernandes, 2006). The plot of LnDe against 1/T will produce a straight line. The slope and the intercept can be used to predict the diffusivity coefficient (Arrhenius constant) and the activation energy by multiplying the slope by 8.314 J mol-1 and taking the exponential of the intercept. The experimental data were tested by fitting with Lewis, Henderson and Parbis model, which are given as follows (Demir et al., 2007): MR = e-kt [7] This can be made linear as follows: lnMR =- kt [8] MR = ae-kt [9] where k is the drying constant (h-1), t is the time (h), a is coefficient. The models above have been used by many researchers with success. Statistical analysis Microsoft Excel for Window Vista 2007 was used for the statistical analysis. Statistical parameters such as the chi-square (χ2), root mean squared error (RMSE) and coefficient of determination (R2) were used to assess the goodness of fitting. The R2 was the major criterion determining goodness of fit (Akpinar et al., 2003) at a particular temperature. Also reduced χ2 and RMSE were used for selecting the best equation to describe the drying curves. These parameters can be calculated as follows (Doymaz, 2005): where N is the number of observations, s is the number of constant in the Equation [8 and 9], MRexp,i is the ith experimentally observed moisture ratio, MRpre,i is the ith predicted moisture ratio. RESULTS AND DISCUSSION Drying curves of cocoa beans dried with a heated batch cocoa bean dryer are presented in Figures 2, 3 and 4. The moisture ratio, moisture content and drying rate decreased continuously with drying time showing a falling rate drying characteristics. There was no constant rate drying period because most crops exhibit the constant rate drying characteristics at their critical moisture content therefore cocoa is not an exception. However, Bravo and McGaw (1982) and Baryeh (1985) stated that cocoa exhibits constant rate behaviour during drying, from moisture content of 70-100% db; however the initial moisture content is not up to this range. At the falling rate period the movement of moisture within the crop to the surface is governed by diffusion since the material is no longer saturated with water (Doymaz, 2005). The results gotten are in agreement with the observations of many researchers (Togrul and Pehlivan, 2004; Doymaz, 2005). The plot of water content (in db) data with time (in h) (i.e., Figures 1, 2 and 3) showed an exponential behaviour; therefore an exponential regression was run for the three temperatures using the Microsoft Excel. The coefficient of correlations for the three drying temperatures of 55, 70 and 81 oC used were -0.96, -0.95 and -0.93. This showed high degree of association for the two variables considered and highlights the curve behaviour which showed decrease of water content with time. The water content data obtained at different air temperatures were converted to the moisture ratio and then the curve-fitting procedure was performed for Lewis and Henderson and Parbis model. The fitting constant is shown in Table 1 while the values are shown in Table 2. The regression analysis was performed using Microsoft Excel for Window Vista 2007. R2 value was the main determinant for the success of the model to define the drying curves of cocoa in heated batch cocoa bean dryer. Reduced χ2 and RMSE were used to determine goodness of fittings. The higher R2 values and the lower χ2 and RMSE values show the best fitting parameters (Akpinar et al., 2003; Doymaz, 2005). Table 2 shows the experimental and predicted moisture ratios while Tables 1 and 3 show the values of constant and values obtained for R2, χ2 and RMSE for the two models tested respectively. Table 1. Values of drying constants and coefficients determined through method of least square for all temperature values.
Table 2. Comparison of the predicted and experimental moisture ratio at various temperatures.
1: Experimental data; 2: Lewis model; 3: Henderson and Parbis model. Table 3. Results of fittings of statistical data.
RMSE: root mean squared error. For the two models, R2 ranged from 0.9270 to 0.9998, χ2 ranged from 0.0002055 to 0.002907, while the RMSE ranged from 0.0124 to 0.0492, for the three drying temperatures used. These results showed goodness of fitting for the two models tested, but when these values especially the χ2 and RMSE are looked at closely, the Henderson and Parbis model gave a lower value, therefore a better result. The effective diffusivity was calculated using the method of slopes. Effective diffusivities were determined by plotting experimental drying data in terms of ln (MR) against time (s) (Doymaz, 2005) and the effective diffusivity is deduced from Equation [5]. The result of reported effective diffusivities for cocoa bean dried with heated batch ranged 3.62 x 10⁻¹⁰ to 49.98 x 10⁻¹⁰ m2 s-1 and this is similar to other crops as shown in Table 4. However, the values are a little higher than those got by Hii et al. (2009a; 2009b) for cocoa dried with an oven, this might be the result of the species of cocoa used or the method of drying. The Arrhenius constant (D) is predicted at 8.64 x 10⁻⁴ m2 s-1 while the activation energy which is the energy barrier that must be passed before moisture diffusion can occur was predicted at 39.94 kJ mol-1. This value is within the range obtained in literature (Senadeera et al., 2005) for similar crops. Table 4. Comparison of effective diffusivity with other crops.
CONCLUSION Two thin layer models were used to investigate the drying characteristics of cocoa beans in heated batch cocoa bean dryer. The entire tested model showed high R2 value with low χ2 and RMSE with Henderson and Parbis model showing a lower χ2 and RSME value at the same temperature than Lewis model. The effective diffusivity value deduced with method of slope from Fick’s diffusion model were 3.62 x 10⁻¹⁰, 8.98 x 10⁻¹⁰ and 9.98 x 10⁻¹⁰ for the respective temperatures of 55, 70, 81 ºC. This showed an increase with temperature. The Arrhenius constant (D) was predicted at 8.64 x 10⁻⁴ m2 s-1 while the activation energy was predicted at 39.94 kJ mol-1. LITERATURE CITED
Copyright 2010 - Chilean Journal of Agricultural Research The following images related to this document are available:Photo images[cj10071t4.jpg] [cj10071f4.jpg] [cj10071f3.jpg] [cj10071f1.jpg] [cj10071f2.jpg] [cj10071t1.jpg] [cj10071t2.jpg] [cj10071t3.jpg] | ||||||||||||||||||||||||||||||||||||||||||||||||||||||||||||||||||||||||||||||||||||||||||||||||||||||||||||||||||||||||||||||||||||||||||||||||||||||||||||||||||||||||||||||||||||||||||||||||||||||||||||||||||||||||||||||||||||||||||||||
| |||||||||
