 |
| About Bioline | All Journals | Testimonials | Membership | News |
|
||||||
|
||||||
Chilean Journal of Agricultural Research, Vol. 71, No. 1, 2011, pp. 3-15 RESEARCH Genetic Relationships of Common Bean (Phaseolus vulgaris L.) Race Chile with Wild Andean and Mesoamerican Germplasm Relaciones Genéticas entre el Germoplasma de Poroto (Phaseolus vulgaris L.) Raza Chile y Silvestres Andinos y Mesoamericanos. Viviana Becerra V.1 *, Mario Paredes C.1, and Daniel Debouck2 1Instituto de Investigaciones Agropecuarias
INIA, Casilla 426, Chillán, Chile. *Corresponding author (vbecerra@inia.cl). Received: 3 January 2010 Code Number: cj11001 ABSTRACT The Chilean common bean (Phaseolus vulgaris L.) belongs to the cultivated race Chile and its origin is presumably Andean. The objective of this study was to identify the origin of a group of Chilean accessions based on their genetic relationship with wild material from the Mesoamerican and Andean common bean gene pool. To achieve this objective, universal primers of chloroplast DNA (cpDNA) and mitochondrial DNA (mtDNA) were used to detect polymorphism using Polymerase Chain Reaction - Restriction Fragment Length Polymorphism (PCR-RFLP). Thirty-two genotypes were analyzed, including wild material from Mexico, Ecuador, Peru, Bolivia, and Argentina, as well as Chilean cultivated genotypes belonging to endemic Chilean accession types (Tórtola, Coscorrón, and Cuyano) and naturalized commercial lines (Frutilla, Bayo, Manteca, and Blanco grande). Results showed a low level of polymorphism for cpDNA (23%) and mtDNA (24%) in wild and cultivated Chilean common bean accessions. Some universal primers and restriction enzyme combinations were more efficient than others in detecting polymorphism. The Chilean materials were closely related to wild accessions collected in Argentina, Bolivia, and Peru indicating their Andean origin. The wild accessions from Ecuador were located in a intermediate position between the Mesoamerican and Andean accessions. Key words: Chilean common bean germplasm, chloroplast DNA, mitochondrial DNA, PCR-RFLP. RESUMEN El poroto chileno (Phaseolus vulgaris L.) pertenece a la raza Chile, cuyo origen es desconocido y presumiblemente andino. El objetivo del trabajo fue identificar el origen de un grupo de genotipos chilenos basado en sus relaciones genéticas con material silvestre perteneciente a los acervos genéticos mesoamericano y andino. Para lograr este objetivo se usaron partidores universales de ADNcp y ADNmt con la metodología de la Reacción en Cadena de la Polimerasa-Fragmentos de Restricción Polimórficos. (PCR-RFLP). Se analizó un total de 32 genotipos de P. vulgaris, los cuales incluyeron materiales silvestres de México, Ecuador, Perú, Bolivia y Argentina y accesiones chilenas cultivadas pertenecientes a las principales clases comerciales chilenas (endémicas) como son: Tórtola, Coscorrón, Sapito, Cuyano y otras clases comerciales (naturalizadas) que se cultivan en el país como Frutilla, Bayo, Manteca, y Blanco Grande. Los resultados obtenidos indican la presencia un bajo nivel de polimorfísmo en ADNcp (23%) y en ADNmt (24%) en las accesiones silvestres y cultivadas chilenas. Algunas combinaciones de partidores-enzimas resultaron más eficientes que otras en detectar polimorfismo, lo mismo ocurrió con algunas enzimas específicas. Los materiales chilenos se presentaron estrechamente relacionados con las accesiones silvestres colectadas en Argentina, Bolivia y Perú indicando su origen andino. Las accesiones silvestres ecuatorianas se ubicaron en una posición intermedia entre las accesiones mesoamericanas y andinas analizadas. Palabras clave: germoplasma de poroto chileno común, ADN cloroplasto, ADN mitocondrial, PCR-RFLP. INTRODUCTION Phaseolus vulgaris L. is native to the Americas where wild ancestral types are still found in their natural state from central western Mexico to northeastern Argentina. Beans are cultivated in this area, as well as in other continents, demonstrating their high capacity to adapt to different climatic conditions. The wild bean has not been found in Chile (Debouck, 1996). Botanical, archaeological, biochemical, and molecular evidence indicate that two major events occurred in the domestication process of the species, one in Mesoamerica and another in the Andes, which made up the two main centers of the origin of this species. Genetic materials from these two centers of origin are differentiated by seed size and growth habit (Evans, 1976), environmental adaptation (Kelly et al., 1987), infertility barriers (Singh and Gutiérrez, 1984; Gepts and Bliss, 1985), resistance to disease (Gepts and Bliss, 1985), isozyme diversity (Paredes and Gepts, 1995), phaseolin types (Gepts et al., 1986), nuclear RFLP (Restriction fragment length polymorphism) diversity (Becerra and Gepts, 1994), RAPD (Random amplified polymorphic DNA) diversity (Vera et al., 1999), AFLP (Amplified fragment length polymorphism) diversity (Tohme et al., 1996), and SSR (Simple sequence repeat) diversity (Becerra et al., 2010). Race Chile has been mainly described through its morphology. The plant has small leaves, prostrate growth habit, light pink to white flowers, pods are not very fibrous, small-sized, and are phenotypically similar to cultivated race Durango of the Mesoamerican gene pool (Paredes et al., 2009). Common bean production in Chile is carried out on the basis of local selections and improved cultivars which are marketed as commercial lines. However, crop yield, including the improved cultivars, does not exceed 3 t ha-1 (Paredes, 1994). Currently, most of the beans produced in the country are for the domestic market. The main market demand is for endemic genetic material such as ‘Tórtola’, ‘Manteca’, and ‘Coscorrón’ which is postulated as having an Andean origin. Several studies have determined the genetic diversity of the common bean and its structure in recent years in which different Chilean bean accession numbers have been included (Gepts and Bliss, 1986; Singh et al., 1991; Becerra and Gepts, 1994; Becerra et al., 2010). Specific studies about race Chile (Paredes and Gepts, 1995) indicate the presence of a narrow genetic base in this germplasm. However, no research has been done on the origin of race Chile, using chloroplast and mitochondrial DNA at the same time and including a representative sample of the Chilean germplasm. Knowledge of the origin of the Chilean common bean and its relationship with cultivated races and wild genotypes would allow selecting compatible parents to transfer desired agronomic, physiological, morphological, and quality characteristics to race Chile from other cultivated races and another gene pool. Broadening the genetic base of the Chilean genotypes would also provide new knowledge about the Phaseolus genus and the species itself. To address this objective, it is necessary to incorporate the study of chloroplast and mitochondrial DNA since they are more conserved from the evolutionary point of view and contain both organelle genes that can be important for the genetic improvement of the species. Various comparative DNA organelle studies have been carried out by sequencing (Stefanovic et al., 2009) or by RFLPs (Demesure et al., 1995), as a means of measuring genetic relationships between and within species. Uniparental inheritance and high conservation of these organelles in most plants has allowed designing universal primers that amplify noncoding regions (Taberlet et al., 1991; Demesure et al., 1995). These regions, amplified by polymerase chain reaction (PCR), can be studied for digestion with different restriction enzymes to determine the number of polymorphisms (PCR-RFLP) (Isshiki et al., 1998). The efficiency of this technique has been demonstrated in phylogeny and population genetic studies (Isshiki et al., 1998; Marchelli et al., 1998). Compared to the standard RFLP procedure used by organelles or organelle probes, restriction analysis of amplified regions of chloroplast DNA (cpDNA) and mitochondrial DNA (mtDNA) (PCR-RFLP) has various advantages, including its simplicity, reduced quantity of tissue needed for analysis, and reduced time and cost (Liston, 1992). The objectives of this research study were to determine the geographical origin of the Chilean common bean by comparing restriction patterns of conserved chloroplast and mitochondrial regions of cultivated race Chile accessions, and determine the relationship between these genotypes and wild genotypes of the Mesoamerican and Andean gene pool by PCR-RFLP analysis. MATERIALS AND METHODS Plant material The study evaluated 32 accessions of which 22 were cultivated belonging to race Chile, and 10 wild accessions (Table 1). Table 1. Cultivated accessions of race Chile analyzed by Polymerase Chain Reaction - Restriction Fragment Length Polymorphism (PCR-RFLP) in chloroplast and mitochondrial DNA.
Race Chile was represented by endemic and naturalized materials. Genotypes belonging to the commercial classes are in the endemic material: Tórtola, Coscorrón,, and Manteca, whereas the naturalized material included the following genotypes: Cuyano, Bayo, Frutilla, Blanco, and Sapito. These materials were provided by the Active Seed Bank of the Instituto de Investigaciones Agropecuarias, INIA Quilamapu, Chillán, Chile. The 10 wild accessions included in this study belong to the Mesoamerican and Andean gene pool, specifically from Mexico, Ecuador, Peru, Bolivia, and Argentina (Table 1). These wild materials were provided by the Genetic Resources Unit of the Centro Internacional de Agricultura Tropical (CIAT), Cali, Colombia. DNA Extraction DNA extraction was carried out using the first trifoliate leaves (Becerra and Gepts, 1994). DNA quality was verified by digestion of the total genomic DNA with the endonuclease EcoRV enzyme and subsequent electrophoresis of the digested product. DNA was finally treated with ARNasa and its concentration was measured in a fluorometer (DyNA Quant, Hoeffer, USA). CpDNA and mtDNA amplification by polymerase chain reaction (PCR) Universal primers for specific chloroplast and mitochondrial regions were employed for amplification (Table 2) (Demesure et al., 1995). The amplification reaction was carried out with 20 hg of DNA; 1X PCR buffer; 50 mM of each nucleotide (dNTP); 0.2 mm of each primer; 0.01% Newt; 2 mM MgCl2, and 1 U of Taq DNA polymerase (Invitrogene), in a total volume of 125 mL. Amplification conditions were three cycles at 95 °C for 1 min, 37 °C for 1 min, and 72 °C for 1.2 min, 37 cycles at 94 °C for 35 s, 42 °C for 40 s, 72 °C for 1 min with an extension period at 72 °C for 10 min and storage at 4 °C (PTC-220 Thermocycler, MJ Research, Watertown, Massachusetts, USA). Coupling temperatures varied between 53.5 and 62 °C (Table 2). Table 2. Primers that amplify conserved regions (I and II) of chloroplast and mitochondrial DNA of 32 Phaseolus vulgaris genotypes.
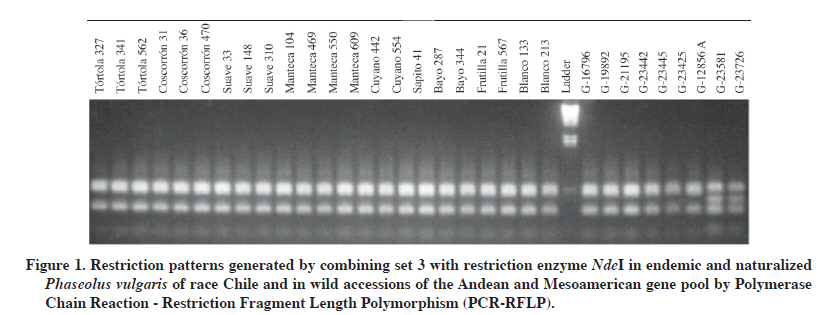
Amplified DNA digestion (RFLP) A total of 13 restriction enzymes were used to study RFLP diversity on chloroplast and mitochondrial DNA: AccI, EcoRI, EcoRV, HaeIII, HindIII, MboI, MseI, NdeII, RsaI, Sau3AI, ThaI, StyI, and XhoI restriction enzymes were selected according to the cutting sequence and the number of bases of the recognition site. After amplification, DNA digestion was carried out under the following conditions: 10 μL of amplified DNA, 1X restriction buffer, and 5 to 8 units of restriction enzyme according to the enzyme evaluated. The total volume varied between 12 and 12.5μL. Samples were incubated at 37 °C for 2 h. PCR-RFLP fragments were separated in agarose gels (4%) in 1X TAE buffer. Electrophoresis was carried out at 200 V for 2.5 h. Gels were dyed with ethidium bromide, visualized in a transilluminator (model FLUO-LINK FLX, Cole Palmer, France), and photographed for evaluation. Data analysis PCR-RFLP fragments generated by the primer-enzyme combinations were used to estimate the relationships between race Chile and wild genotypes. The 50 bp ladder was used as a standard to discriminate the size of the bands. Polymorphic bands were considered as binary characters and recorded as “1” in the presence of bands and “0” in their absence. The similarity between genotypes was estimated by Jaccard’s coefficient with the SIMQUAL option. The similarity matrix was employed in the “Sequential, agglomerative, hierarchical, and nonoverlapping” (SAHN) option (Sneath and Sokal, 1973) to generate the dendrogram with UPGMA. The MXCMOP program was employed to calculate the correlation between the cophenetic and original matrices generated by SIMQUAL. Analysis generated a cophenetic correlation value (r) that indicates if the original data was represented in the cluster analysis, under 1000 permutations. These analyses were carried out by the NTSYSpc 2.1 program (Rohlf, 2000). RESULTS Polymorphism level Of all the accessions evaluated (32), the polymorphism level was low in both organelles (Table 3) compared to polymorphism obtained at the nuclear DNA in this species (Becerra and Gepts, 1994; Becerra et al., 2010). The percentage of polymorphic bands was similar for cpDNA and mtDNA, 23 and 24%, respectively (Table 3). The 23% of cpDNA polymorphism was obtained by six primer-restriction enzyme combinations. Thus, set 1 with five restriction enzymes contributed 5%; set 2 with two of seven evaluated enzymes, 2.8%; set 3 with one of two evaluated enzymes, 1.4% (Figure 1); set 4 with one of four evaluated enzymes, 2%; set 5 with six of seven evaluated enzymes, 10%; and set 7 with two of six evaluated enzymes, 1.4% (Table 4). Enzymes that did not detect polymorphism were not included in the analysis. Figure 1 shows an example of a restriction pattern where set 3 combined with enzyme NdeI clearly showed genetic differences with the Ecuadorian accessions Table 3. Number of polymorphic, monomorphic, and total bands obtained by Polymerase Chain Reaction - Restriction Fragment Length Polymorphism (PCR-RFLP) in Phaseolus vulgaris chloroplast and mitochondrial DNA.
Table 4. Primer-restriction enzyme combinations evaluated in Phaseolus vulgaris chloroplast DNA.
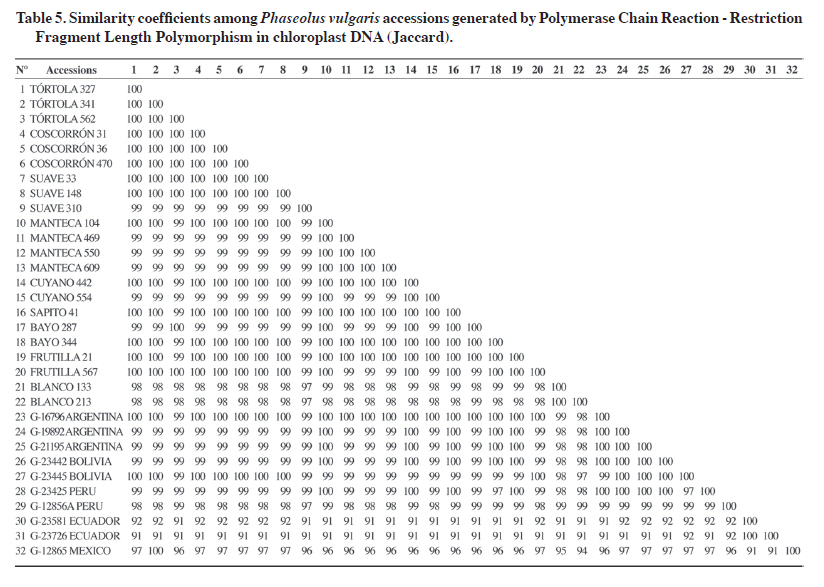
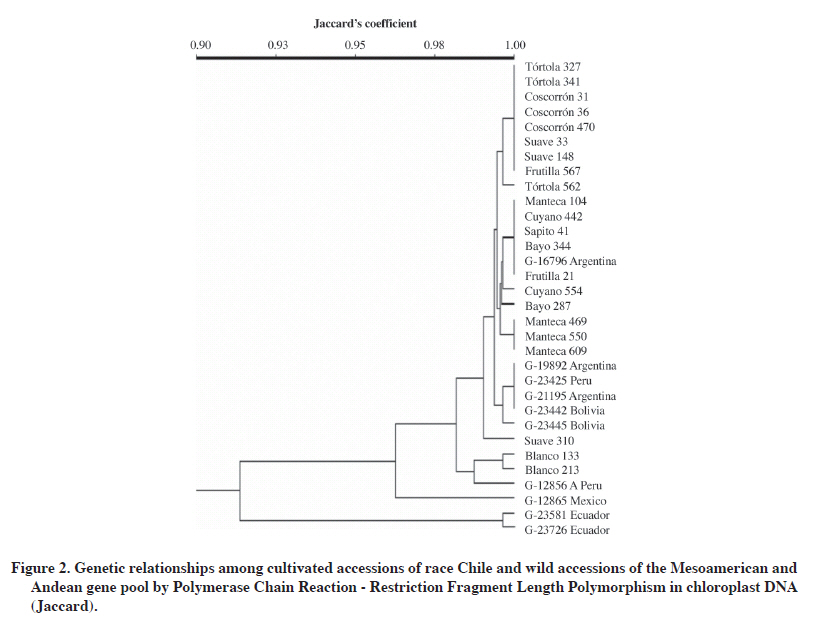
The 24% of mtDNA polymorphism was obtained in set 1 with four evaluated restriction enzymes (11%), and set 2 with six of seven evaluated enzymes (13%) (Table 5). Sets 3 and 4 of mitochondrial primers did not detect polymorphism for any of the evaluated restriction enzymes. PCR-RFLP of chloroplast DNA The nine cpDNA primers and 13 restriction enzymes used in this study generated 117 combinations of which 31 were genetically informative and included in the genetic analysis (Table 4). That is, 26% of the total combinations in cpDNA allowed establishing genetic relationships among the 32 analyzed accessions. However, it should be noted that sets 6, 8, and 9 did not amplify for any of the accessions. Furthermore, the restriction enzymes MboI and MseI did not generate RFLPs for any of the six sets of chloroplast primers analyzed. The greatest variability in the number of resulting patterns was detected with the combinations of chloroplast set 1 with AccI enzyme and chloroplast set 5 with EcoRV enzyme, both with four detected patterns (Table 4). Efficiency in detecting polymorphism in the different primer-restriction enzyme combinations varied greatly throughout this study. For example, by carrying out comparisons within the set of primers and restriction enzymes it was observed that 33% of the generated bands resulted polymorphic and the five enzymes used were informative in set 1 (Table 4). On the other hand, set 2 detected 14% polymorphic bands with two restriction enzymes (EcoRI and NdeI) from a total of seven enzymes. In general, chloroplast set 5 with six restriction enzymes detected the highest percentage of polymorphism (35%) (Table 4). Grouping of accessions by PCR-RFLP analysis of chloroplast DNA Mean genetic similarity observed in this study was 97%, value considered high and similar to that obtained in other plant species at the chloroplast DNA level (Frascaria et al., 1993). The data obtained by PCR-RFLP of chloroplasts in common beans allowed making a dendrogram that grouped the accessions according to their genetic distance (Figure 2, Table 5). The cultivated and wild Andean accessions were grouped at the top branch of the dendrogram, the wild Mexican and genetically distant accessions were located in the middle, and the Ecuadorian accessions were grouped in the bottom branch. The first group located at the top of the dendrogram included almost all the cultivated types of race Chile: Tórtola 327, Tórtola 341, Tórtola 562, Coscorrón 031, Coscorrón 036, Coscorrón 470, Suave 148, and Suave 033. All of them are very similar from the genetic point of view. A second group made up of the cultivated Chilean Manteca type (Manteca 469, Manteca 550, and Manteca 609) were grouped separately from the previous group with 99.5% similarity, but 100% among themselves. Most of the naturalized cultivated materials also showed 100% similarity among themselves (Cuyano 442, Sapito 041, Bayo 344, and Frutilla 021). Cuyano 554 and Bayo 287 genotypes were located further away from this group with 99.5% similarity. The rest of the naturalized accessions, Blanco 213 and 133 were grouped separately with 99.5% similarity between them (Figure 2, Table 5). It should be noted that the wild Andean accessions were separated from the cultivated Andean group which included the following: G-19892 and G-21195 from Argentina, G-23442 and G-23445 from Bolivia, and G-23425 from Peru (Figure 2). The group at the bottom of the dendrogram included the wild Mesoamerican genotypes. Within this gene pool, the wild genotype from Mexico (G-12865) was located apart from the other accessions with a 96.5% of similarity compared with the rest of the cultivated and wild accessions from the Andean region (Figure 2). At a greater genetic distance, the wild Ecuadorian accessions (G-23581 and G-23726) were grouped with a 99.5% of similarity between them (Figure 2). The similarity coefficient in chloroplast DNA between pairs of accessions varied between 91 and 100% (Table 6). The lowest similarity coefficient (91%) was obtained by comparison between the Mexican (G-12865) and Ecuadorian (G-23581 and G-23726) accessions with those from the Andean gene pool. The cophenetic correlation coefficient between the cophenetic matrix and the original PCR-RFLP data was considered high at 0.93 and showed that the original matrix is well represented in the dendrogram. Table 6. Primer-restriction enzyme combinations evaluated in Phaseolus vulgaris mitochondrial DNA.
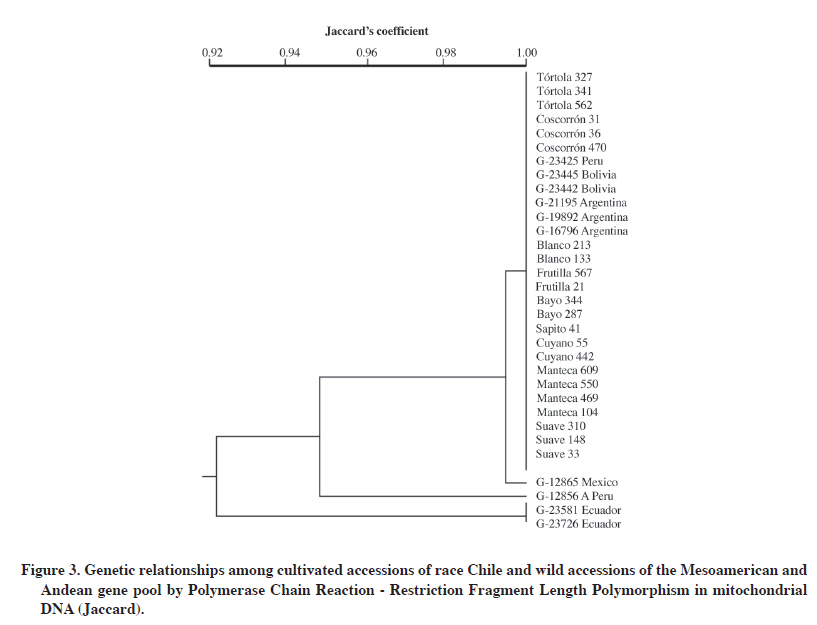
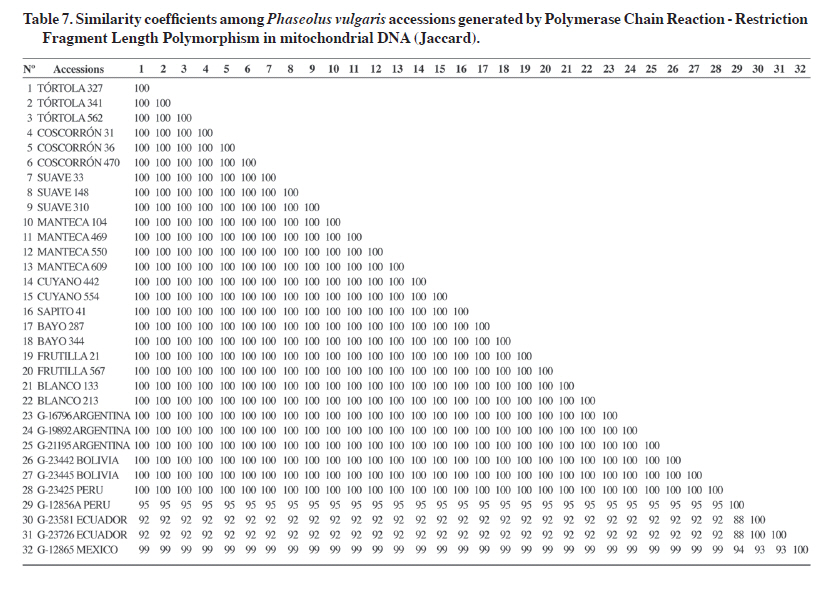
PCR-RFLP of mitochondrial DNA The four mtDNA primers combined with the 13 restriction enzymes used in the study generated 52 combinations of which 19 generated informative RFLPs. That is, 37% of them allowed establishing relationships among the 32 analyzed accessions (Table 6 ). Only two of the primer sets detected genetic diversity. Primer set 1 generated 38% of polymorphic bands, while set 2 detected 26%. Sets 3 and 4 did not detect any polymorphic bands (Table 6 ). Primer set 2 with the XhoI enzyme was the most efficient combination to detect polymorphism, even though it did not generate the highest number of RFLPs (10). Fifty percent of these fragments were polymorphic and generated two banding patterns in the 32 accessions (Table 5). Finally, primer set 2 combined with seven restriction enzymes was the most informative in terms of detecting RFLPs (Table 6). Grouping of accessions by PCR-RFLP analysis of mitochondrial DNA Mitochondrial analysis established a clear separation of the two main gene pools. The cultivated and wild Andean accessions were grouped at the top branch of the dendrogram the Mesoamerican accession from Mexico was located in the middle and further away from accessions from Ecuador (Figure 3). Mean genetic similarity of the 32 accessions was 98%, an expected value within the intraspecific variability at the mitochondrial DNA level (Wolfe, 1987) (Table 7). Twenty-eight accessions were grouped with 100% similarity, it means 88% of the total of genotypes analyzed (Figure 3, Table 7). This group included all the cultivated accessions: Tórtola 327, Tórtola 341, Tórtola 562, Coscorrón 31, Coscorrón 36, Coscorrón 470, Suave 33, Suave 148, Suave 310, Manteca 104, Manteca 469, Manteca 550, and Manteca 609, as well as the naturalized accessions: Cuyano 55, Cuyano 442, Bayo 344, Bayo 287, Frutilla 21, Frutilla 557, Blanco 133, Blanco 213, and Sapito 41 (Figure 3). Wild Andean materials were also grouped with the accessions from Argentina (G-21195, G-19892, and G-16796), Bolivia (G-23442 and G-23445), and Peru (G-23425), except for the G-12856 A accession from Peru which was separated from the group with 95% similarity (Figure 3; Table 7). It was also observed in the dendrogram that the accession from Mexico (G-12865) is closer to the group containing the highest number of accessions with a 99% similarity level. Wild accessions from Ecuador (G-23581 and G-23726) were grouped with a 99.5% genetic similarity and 92% with the rest of the accessions (Figure 3; Table 7). The lowest similarity coefficient between pairs of accessions was 88% (Table 7) observed by comparing the wild accession from Peru (G-12856A) and the wild accessions from Ecuador (G-23581 and G-23726). DISCUSSION Few studies have used the PCR-RFLP methodology to study genetic relationships in different crop species. In the case of common bean, where genotypes of both gene pools were included, the authors differed in their results. Vekemans et al. (1997) indicated a low level of variation at the cpDNA level in four genotypes analyzed, Khairallah et al. (1992) agree with this result. On the other hand, Chacón et al. (2005) detected 14 and five haplotypes in the wild and in the cultivated genotypes from the Andean gene pool, respectively. In this study, it was confirmed that the cultivated common bean had a greater genetic similarity than the wild common bean. The usefulness of cpDNA and mtDNA has been confirmed in other species in phylogeny studies and population genetics (Rajora and Dancik, 1995). Studies in common beans have indicated a limited to low degree of polymorphism at the inter- and intra-specific level, probably due to the low rate of nucleotide changes in their sequences (Palmer, 1992). This high degree of DNA conservation in both organelles was confirmed in this study, where it was detected only a 23 and 24% of polymorphism at chloroplast and mitochondrial level, respectively. In spite of these results, the analysis allowed separating the genotypes in the two gene pools, thus supporting the hypothesis that the domestication of the common bean in the Andean and Mesoamerican regions was independent. The use of cpDNA also indicated the presence of diverse haplotypes within the analyzed material. These results could have important implications in a breeding strategy where it is necessary to maintain genetic diversity at both the nuclear and cytoplasmic levels. The different levels of efficiency of restriction enzymes to detect polymorphism were also shown in this PCR-RFLP study. For example, in the case of cpDNA, 23% of total polymorphism was obtained in set 1 with five restriction enzymes (5%), set 2 with seven (3%), set 3 with two (1.4%), set 4 with four (2%), set 5 with seven (10%), and set 7 with six enzymes (1.4%) (Table 5). In the case of mtDNA, 24% polymorphism was obtained in set 1 with four evaluated restriction enzymes (11%) and set 2 with seven (13%). This differential response is due to the fact that restriction enzymes recognize palindromic sequences composed by a fixed number and order in the nucleotide composition, known as a cutting sequence. The mutations present in the amplified PCR fragment may influence its efficiency in detecting polymorphisms. Genetic similarity analysis once more indicates the existence of a narrow genetic base in the endemic and naturalized genotypes of race Chile at both chloroplast and mitochondrial levels. This situation has been observed before in genetic diversity studies at the nuclear DNA level using biochemical markers (Paredes and Gepts, 1995), and molecular markers such as RFLP (Becerra and Gepts, 1994) and RAPD (Vera et al., 1999). In contrast, higher levels of diversity have been found at cpDNA when genotypes from other bean species were included (Vekemans et al., 1998). The relationship of common bean from race Chile with wild Andean and Mesoamerican beans at the chloroplast DNA level indicates a greater genetic similarity with Andean materials (Argentinean, Peruvian, and Bolivian), an intermediate genetic distance with the wild Mexican bean, and a greater distance with wild Ecuadorian beans (Kami et al., 1995; Chacón et al., 2005; Kwak and Gepts, 2009). This result agrees also with the mitochondrial DNA analysis. Data available to date indicate that the common bean has two main geographical centers of origin, Mesoamerican and Andean (Gepts et al., 1986; Koenig et al., 1990), although there could be secondary centers such as Colombia and others (Debouck, 1996). In this context, it is currently assumed that the geographical origin of the cultivated race Chile is Andean as mentioned before by Singh et al. (1991) using different types of markers. The analysis of the wild beans from Ecuador and the North of Peru indicated that this genetic material varied very little in the phaseolin constitution, because the only phaseolin types found was the “type I”(Debouck et al., 1993 This low variability has been confirmed also by isozyme and mitochondrial DNA studies (Khairallah et al., 1992). These type of materials are considered as the oldest beans, and separated from the Mesoamerican and Andean beans gene pools (Kami et al., 1995; Debouck, 1996; Chacón et al., 2007). The position of the accession from Ecuador were similar to the previous studies mentioned above. On the other hand, a previous isozyme diversity study carried out with 95 Chilean accessions detected an important level of introgression from of Mesoamerican alleles into the Chilean genotypes and the presence of type “S” phaseolin, a specific Mesoamerican phaseolin type (Paredes and Gepts, 1995). This situation could be due to the gene flow from Mesoamerica genotypes sown closely to Chilean genotypes in the farmer fields and favored by the low cross-pollination percentage shown by the common bean In this regards, it has been reported the existence of genetic incompatibility in crossing some Mesoamerican and Andean genotypes, which constitute a biological barrier for genetic exchange between materials belonging to different gene pools (Shii et al., 1981; Singh and Gutiérrez, 1984; Gepts and Bliss, 1985; Koinange and Gepts, 1992). However, there are some Chilean materials that do not exhibit these incompatibilities. This material could be used as a genetic bridge to promote the recombination between these two main gene pools (Paredes and Gepts, 1995). Other important factor to be considered is that some studies indicated that wild Andean material has a lower yield potential and a lower physiological capacity than the Mesoamerican materials (Lynch et al., 1992; Singh et al., 1995). This situation has been confirmed by the study of early populations and F5 lines derived F8 that included wild and weedy Mexican beans as parents. This report showed higher yield material from Mexican material than those from Peru and Argentina (Singh et al., 1995). Similar results were obtained with cultivated materials (White et al., 1992). Other studies have demonstrated that the wild and weedy accessions from Mexico have a higher photosynthetic rate, low soluble protein content, and high efficiency in using N (Lynch et al., 1992). These and other results (Singh et al., 1992; Singh and Urrea, 1994) indicated that one of the possibilities to improve yield potential and other characteristics of the Andean material is using Mesoamerican materials. CONCLUSIONS The Chilean germplasm showed a high percentage of genetic similarity at the cpDNA and mtDNA level using PCR-RFLP The most probable geographic origin of the Chilean common beans germplasm is Andean because of its closer genetic relationship with the wild accessions from this germplasm. Wild accessions from Ecuador were shown genetically different from the wild accessions from the Mesoamerican and Andean gene pool. ACKNOWLEDGEMENTS The authors wish to thank the Fondo Nacional de Desarrollo Científico y Tecnológico (FONDECYT) for financing this research through the FONDECYT Projects Nº1980164 and N°1060185. LITERATURE CITED
Copyright 2011 - Chilean Journal of Agricultural Research The following images related to this document are available:Photo images[cj11001t3.jpg] [cj11001f2.jpg] [cj11001t7.jpg] [cj11001t2.jpg] [cj11001t6.jpg] [cj11001f1.jpg] [cj11001f3.jpg] [cj11001t1.jpg] [cj11001t5.jpg] [cj11001t4.jpg] | ||||||||||||||||||||||||||||||||||||||||||||||||||||||||||||||||||||||||||||||||||||||||||||||||||||||||||||||||||||||||||||||||||||||||||||||||||||||||||||||||||||||||||||||||||||||||||||||||||||||||||||||||||||||||||||||||||||||||||||||||||||||||||||||||||||||||||||||||||||||||||||||||||||||||||||||||||||||||||||||||||||||||||||||||||||||||||||||||||||||||||||||||||||||||||||||||||||||||||||||||||||||||||||||||||||||||||||||||||||||||||||||||||||||||||||||||||||||||||||||||||||||||||||||||||||||||||||||||||||||||||||||||||||||||||||||||||||||||||||||||||||||||||||||||||||||
| |||||||||
