 |
| About Bioline | All Journals | Testimonials | Membership | News |
|
||||||
|
||||||
Chilean Journal of Agricultural Research, Vol. 71, No. 1, 2011, pp. 148-156 RESEARCH Quantifying Nitrate Leaching in Irrigated Wheat with Different Nitrogen Fertilization Strategies in an Alfisol Cuantificación de la Lixiviación de Nitratos en Trigo Regado con Diferentes Estrategias de Fertilización Nitrogenada en un Alfisol. Marcelino Claret M.1*, Roberto Urrutia P.2, Rodrigo Ortega B.3, Stanley Best S.1, and Natalia Valderrama V.4 1Instituto de
Investigaciones Agropecuarias INIA, Casilla 246, Chillán, Chile. *Corresponding
author (mclaret@inia.cl). Received: 18 February
2010 Code Number: cj11018 ABSTRACT Consumption of water contaminated with nitrates is associated with important health effects such as methemoglobinemia and gastric cancer. Intensive agriculture, which uses large quantities of N fertilizer, is the main source of nitrates in water systems. There are several strategies to reduce leaching and increase Nitrogen Use Efficiency (NUE). An experiment was conducted with spring wheat (Triticum aestivum L.) under sprinkler irrigation (center pivot) to determine if adjusted N applications using precision agriculture tools and plant demand resulted in a lower groundwater nitrate load. Evaluated treatments were: produced fertilization (Pr), precision agriculture (Pa), chlorophyll meter (Sm), and control without N (W/N). The ceramic capsule methodology was used to evaluate N leaching losses that were sampled after each irrigation (six) and drainage water was also estimated. Differences among treatments in terms of N loss and grain yield were not significant (p > 0.05). However, N balance showed significant differences (p < 0.01) in soil residual N among treatments. A regression between applied and residual soil N after harvest showed that N, applied as fertilizer, explained 98% of residual soil N variation, which would probably be leached in the following winter since the soil would be bare. It was concluded that NUE can be improved to result in a lower environmental load by using precision agriculture tools and considering plant N demand. Key words: nitrates, precision agriculture, chlorophyll meter, Triticum aestivum, wheat. RESUMEN El consumo de agua contaminada con nitratos produce importantes efectos en la salud tales como metahemoglobinemia y cáncer gástrico. La agricultura intensiva es la principal fuente de nitratos en aguas superficiales y subterráneas. Hay varias estrategias para reducir lixiviación y aumentar la eficiencia de uso de N (NUE). Se realizó un experimento en trigo de primavera (Triticum aestivum L.) bajo pivote central, con el objetivo de determinar si las aplicaciones ajustadas de N, mediante el uso de herramientas de agricultura de precisión y considerando la demanda de la planta, resultaban en una menor carga de nitratos para el agua subterránea. Se evaluaron los siguientes tratamientos: productor (Pr); agricultura de precisión (Pa), medidor de clorofila (Sm) y sin N (W/N). Se utilizaron lisímetros para evaluar las pérdidas de N; se tomaron muestreas seis veces durante la temporada, evaluando además el agua de drenaje en cada riego. Las diferencias en pérdida de N y rendimiento del grano entre los tratamientos no fueron significativas (p > 0,05). Sin embargo, el balance de N mostró diferencias significativas en N residual del suelo entre los tratamientos (p < 0,01). El N aplicado como fertilizante explicó 98% de la variación del N residual, que probablemente sería lixiviado el siguiente invierno. Se concluyó que es posible mejorar la NUE, resultando en una menor carga ambiental mediante el uso de herramientas de agricultura de precisión y considerando la demanda de N de la planta. Palabras clave: nitratos, agricultura de precisión, medidor de clorofila, Triticum aestivum, trigo. INTRODUCTION Nitrates represent surface and groundwater contaminants on a global scale. Their long-term consumption is associated with health problems such as blue baby syndrome or methemoglobinemia (Hubbard et al., 2004) and non-Hodgkin lymphoma (Ward et al., 1996). According to Camargo et al. (2005), animal nitrate toxicity increases with concentration and exposure time. A good health impact indicator is the standards set by many countries and the World Health Organization, and the latter has established 10mg L-1 of N-NO3- as the limit for nitrate concentration in drinking water. Agriculture is one of the most important sources of nitrate contamination (Yefang and Somers, 2008), mainly inorganic N fertilization of intensive crops, such as corn (Zea mays L.), potatoes (Solanum tuberosum L.), and wheat (Triticum aestivum L.) (Ladha et al., 2005). One of the strategies to reduce environmental nitrate load is efficient N management in intensive crops. Wheat is an important crop in Chile and represents 49% of the total planted area with an estimated annual N use of 40 000 t (INE, 2010). Nitrogen fertilization of wheat responds to general recommendations that do not consider the spatial variability of soil properties. This variability factor is relevant, and an average N recommendation may be insufficient for one sector of a field and excessive for another. This can result in heterogeneous yields and greater nitrate losses because of an inefficient use of N by plants, which in turn can result in groundwater contamination. The objective of precision agriculture (Pa) or site-specific crop management is to detect soil variability through different technologies, including remote sensing, to distinguish soil types on a farm (Johnson et al., 1996), and then to sample, analyze, and recommend fertilization that corresponds to each area, thus improving N fertilization efficiency. Ortega and Mardonez (2005) reported high spatial variability on in situ N mineralization of an alluvial soil in the Central-South Chile. Díaz et al. (2002) demonstrated that using a SPAD meter for N management in cereal crops improves N use efficiency. The SPAD meter, also called “chlorophyll meter”, measures the relative chlorophyll content of crop leaves as compared to a fertilized reference crop; it can determine an N sufficiency index that indicates the correct time to fertilize the crop, thus improving the N efficiency by the plant (Villar and Ortega, 2003). On the other hand, Molina and Ortega (2006) found that using fertilizers with nitrification inhibitors (NI) reduced N leaching in Chilean soils as compared to urea. Ortega et al. (2002) found that variable rate technology (VRT) in wheat is technically and economically feasible. More recently, Ortega et al. (2009) developed a model to determine the best fertilizer blend for variable application in cereal crops. Aerial or satellite imagery can be used to elaborate prescription maps for site-specific management. Multi-spectral sensors collect data in the visible wavelengths (red, blue, and green), as well as in near infrared. A mathematical formula that combines the red and near infrared bands is used to estimate crop vigor that is expressed as green biomass (Fitzgerald et al., 1999). When crop management has been homogeneous in terms of fertilization, pest control, irrigation, and cultural management, differences in vigor captured by remote sensing show soil differences that allow separating soil types and perform directed sampling to generate site-specific fertilization recommendations. A common practice in wheat production management is to split N fertilization in accordance with determined stages during the crop cycle without considering the plant’s physiological demand for nutrients in its different stages; usually too much N is applied at early development stages where N crop needs are minimal. This can result in a less efficient use of applied N, thus reducing yields and producing nitrate losses that can contaminate groundwater (Dunbabin et al., 2009). The objective of this field experiment was to quantify nitrate losses in a wheat crop by comparing different N fertilization strategies: producer (Pr), precision agriculture (Pa), and chlorophyll meter (Sm) to assess whether better N fertilization strategies will reduce residual soil nitrate levels, and reduce the possibility of groundwater contamination without negatively affecting crop yields. MATERIALS AND METHODS Experimental area The study was conducted in the commune of Yungay (37º9’ S; 72º0’ W) in the Bío Bío Region, Chile during the 2008-2009 season. The area has a temperate Mediterranean climate with annual rainfall of 1400 mm, evaporation of approximately 350 mm (with water deficits for 3 to 4 mo during the year), and a mean annual temperature between 12.5 and 13.9 ºC (Papadakis, 1966). The main crops are wheat, oats (Avena sativa L.), and sugar beet (Beta vulgaris L.). The soil is classified as a fine, mixed, thermal Typic Rhodoxeralfs (Alfisol) belonging to the Collinco series, which is derived from volcanic ash and has a clay loam texture (Luzio and Casanova, 2006). The experiment was seeded manually on 12 September 2008 with the spring wheat var. Ciko-INIA. Plants were seeded in rows 0.15 m apart with a 220 kg ha-1 seed rate. Weed grasses were controlled 32 d after seeding with the fluroxypir, flumetsulan, and metsulfuron-methyl herbicides at rates of 0.75 L ha-1, 0.25 kg ha-1, and 0.08 kg ha-1, respectively, whereas broadleaf weeds were controlled 38 d after seeding with Diclofop-methyl at a rate of 2.0 L ha-1. The crop was irrigated with a central pivot system (irrigation efficiency > 90%) in accordance with producer management practices. The experimental design was a randomized complete block with four treatments and four replicates using 3 x 3 m plots as the experimental unit. Evaluated treatments were the following: Producer (Pr). Composite soil sampling was conducted in a 60 ha transect with enough sub-samples to provide a homogeneous sample that represented field- average soil fertility. An average N fertilization recommendation was based on laboratory analysis results (Table 1). Prescription was based on calibration data provided by the Instituto de Investigaciones Agropecuarias (INIA). Table 1. Temporal distribution of nitrogen fertilizer.
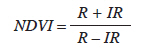
1Zadoks decimal scale values for cereals (Zadoks et al., 1974). Pr: producer fertilization; Pa: precision agriculture; Sm: chlorophyll meter; W/N: without N (control). Precision agriculture (Pa). Precision agriculture assumes that there are differences in soil properties that influence crop response to N management within an area. To visualize these differences, which are normally imperceptible to the producer in the sampling area, a multi-spectral image from the 2006-2007 growing season was used. The image was collected with a multi-spectral camera (Duncan Tech, MS310, Duncan Technologies, Plantation, Florida, USA) when the wheat crop was in full development. The normalized difference vegetation index (NDVI) (Ladha et al., 2005) was obtained from the image through computer analysis. This index is based on the maximum absorption of crops in the red band of the solar spectrum (690 nm) due to chlorophyll pigments and the maximum reflectance in the near infrared spectral band (800 nm) due to leaf cell structure (Haboudane et al., 2004). The index responds to the following equation:
where R is the red band of the visible spectrum and IR is the infrared band. NDVI showed crop areas with low, medium, and high vigor (HV). When crop management has been homogeneous, it is assumed that different levels of vigor (more foliage and green areas associated with chlorophyll) are due to differences in soil properties. The HV area for this study was selected because of the lower probability of N loss since the producer would apply an average rate that would probably not be enough for this high potential yielding area. If leaching occurred under these conditions, it could be expected that N losses would be even greater under any other conditions (Table 1).
Chlorophyll meter (Sm). A SPAD chlorophyll meter (Minolta, Chicago, Illinois, USA) was employed. To ensure value representativeness (Zhang et al., 2008) in accordance with the methodology, a 3 × 3 m plot was established 5 m from the study site and excessively fertilized (300 kg N ha-1) to serve as a reference (Villar and Ortega, 2003). Samplings were weekly and 20 randomly selected leaves in each sampling were measured from the reference plot and from each replicate per treatment. A sufficiency N index (SNI) was obtained with this methodology and the following formula:
If SNI was less than 95%, it was necessary to apply N (Díaz et al., 2002; Villar and Ortega, 2003). The total rate used and its distribution is shown in Table 1. Control without N (W/N). A control without N fertilization was included to calculate N use efficiency (Ladha et al., 2005). Urea was the N source (46% N). Fertilization treatments (Pr and Pa) responded to recommendations by a specialist in soil fertility and plant nutrition, and only soil test results (calibration method) were considered, not potential crop yield. The same N rate was applied to the three treatments at seeding to standardize crop establishment. Nitrogen was applied in three splits for the different treatments as shown in Table 1. Nitrate leaching estimation Nitrate samplings were made by the ceramic capsule methodology. Three capsules were installed for each replicate at a depth of 100 cm since wheat plant roots can reach an approximate soil depth of 90-95 cm. Consequently, it was assumed that the water collected by the capsules at this depth would correspond to N leaching. Six irrigations were applied during the crop cycle; therefore, six samplings where made each with 48 samples (three capsules x four replicates x four treatments), totaling 288 samples for the cycle. The day prior to each irrigation a 60 kPa vacuum was generated with an ad-hoc vacuum pump (model 2005G2, Soil moisture Equipment Corp., Goleta, California, USA) and left for 24 to 48 h to allow water at a higher water potential within the soil to move into the sampler. On the sampling day, leachates were extracted approximately 6 h after irrigation in order to obtain rapid flowing gravitational water through a hose connected to the lysimeter with a 200 mL syringe (Lord and Shepherd, 1993; Alfaro and Salazar, 2005). Samples were refrigerated until arrival on the same day at the EULA Center laboratory of the Universidad de Concepción for nitrate analysis by ionic chromatography. Potential evapotranspiration (ET0) was calculated at each irrigation interval with the Penman-Monteith FAO56 model (Allen et al., 2006) and employing ad-hoc parameters from a meteorological station located 300 m from the experiment. Real evapotranspiration (ETreal) was obtained for each period by correcting ET0 with crop coefficient values (Kc) for wheat. Finally, the ETreal value obtained was subtracted from the natural rainfall and/or irrigation (pluviometer from the meteorological station) to estimate drainage water. Since the experiment started with soil moisture at field capacity, drainage can be assumed to be the difference between the amount of water applied and the water evapotranspired by the crop. Drainage water (L m-2) was multiplied by nitrate concentration (mg L-1 N-NO3) in the leachates and finally transformed into kg N ha-1 for each irrigation (Jury et al., 1991). Crop yield measurement A 1.5 m2 area was manually sampled by replicate. Samples were threshed using a stationary machine and weighed with a precision scale to obtain yield per treatment (t ha-1). Analysis of N extracted by the crop The above-ground parts of five plants were sampled at random from each replicate of each treatment. Roots were left in the soil in accordance with standard procedure for this type of measurement (Ladha et al., 2005). Dry matter samples were dried at 60 ºC up to constant weight, finely ground, and analyzed for total N by the Dumas direct combustion method (AOAC, 1997). Based on these data, total dry matter and N fertilizer recovery efficiency (NFRE) were calculated for each treatment. Data analysis Analyses included ANOVA and regression analysis with SAS System software for Windows (SAS Institute, Cary, North Carolina, USA). RESULTS AND DISCUSSION The experimental area covers 35 702 ha. The initial physical and chemical characteristics (Tables 2 and 3) indicate soils with a high productive potential for intensive agriculture. Given the magnitude of the area, it is logical to conclude that all production activities undertaken there could have an impact on groundwater, particularly N management. Table 2. Physical soil analysis at the experimental site.
CC: field capacity; PMP: permanent wilting point; Dap: bulk density. Table 3. Initial chemical and physical soil analysis (0-20 cm): experimental site.
CEC: cation exchange capacity Agricultural production systems represent an important and ongoing source of nitrates in groundwater (Oenema et al., 2005; Jalali, 2005; Beaudoin et al., 2005; Gallardo et al., 2005) affecting the quality of drinking water, particularly in rural areas (Chen et al., 2004). In view of the adverse effects of nitrates on human health and on the environment, and given that global demand for N fertilizer is dictated by cereal grain production where three main grain crops (rice, corn, and wheat) account for 56% of world N fertilizer consumption (Cassman et al., 2003), it is imperative to improve its use efficiency in order to reduce groundwater nitrate loads. Several studies have indicated that crops do not efficiently use N fertilizers, thus losing approximately 50% of what is applied (Tilman et al., 2002; Dobermann and Cassman, 2004). Studies have also indicated that there is a direct relationship between groundwater nitrate levels and N rate applications (Kundu and Mandal, 2009). For example, high concentrations of nitrate in groundwater and intensive potato cultivation were positively correlated (Yefang and Somers, 2008), which supports the idea that a high proportion of leached nitrates that have extended below the crop root zone will inevitably end up in groundwater. However, the results of this experiment show that the differences in total N amounts applied in the treatments (Table 1) are not expressed as nitrate losses. ANOVA for total leached nitrates per treatment during crop development did not show significant differences (p > 0.05) (Table 5), which coincides with the results of Ortuzar et al. (2003). It would be logical to expect that greater amounts of applied N should result in larger nitrate losses during plant development. This could be explained by the low values of fast flowing gravitational water left by the water balance in each irrigation (Table 4) probably derived from a season with high atmospheric water demand and applying high efficiency sprinkler irrigation. On the other hand, only nitrate was determined on the leachates in this experiment, although it is known that urea can, as such, also be lost after irrigation (Molina and Ortega, 2006); therefore, if urea had been measured along with nitrate in the leachates, differences in N losses among treatments could have been significant (Molina and Ortega, 2006). All crops exhibit uncontrolled factors such as precipitation and mineralization rate of organic matter, which are highly spatially variable (Ortega and Mardonez, 2005), and controllable variables such as crop rotation, irrigation, and fertilization management that have variable influence on nitrate loss (Randall and Mulla, 2001). However, water has a direct influence on plant nutrient absorption and on N leaching particularly when urea that has a high solubility coefficient and is initially electrically uncharged is used. Results of this experiment showed that under constant physical and chemical soil characteristics and irrigation equally affecting all treatments, low values of gravitational water tended to homogenize nitrate losses by lixiviation. Table 4. Water balance and drainage water for each irrigation.
Evap.: accumulated evapotranspiration before irrigation; C Kc: evapotranspiration values corrected by wheat crop coefficient (Kc); R/LL: water applied by irrigation or rainfall; Drain.: drainage water after irrigation. Table 5. Nitrogen balance for evaluated treatments.
Treat.: experimental treatments; N apl: total applied N; N vol: volatilized
N (taken as 2% reference value); N ext: total N (straw and grain) extracted
by the crop; N lea: leached N; N res: soil residual N after harvest; Pr: agricultural
producer; Pa: precision agriculture; Sm: chlorophyll meter; W/N: without N
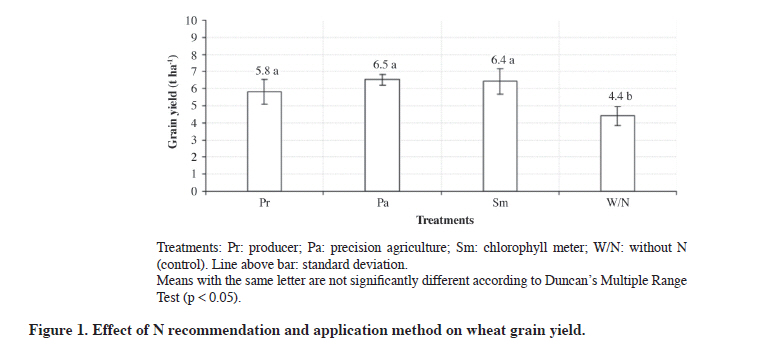
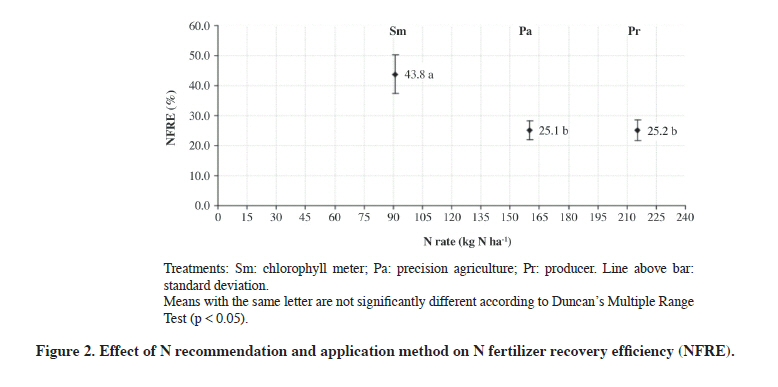
(control). Only the contradiction between the study hypothesis and nitrate losses by leaching is apparent; the positive N balance (Table 5) clearly shows that the difference remains in the soil as residual N (N-NO3+N-NH4) in quantities directly proportional to the N rate applied as fertilizer (Table 1). Soil residual N might be a gain in fertility, but observing the soil residual N value at the beginning of the experiment (Table 1), assuming that producer N fertilization practices prior to the experiment were similar and that immobilized N is marginal, it can be deduced that a large proportion of N remaining in the soil can be leached during winter, which constitutes a heavy environmental load involving the potential risk of reaching groundwater. Since ANOVA showed that the differences of the means of soil residual N among treatments at the end of the crop cycle (Table 5) were highly significant (p < 0.01), it can be deduced that lower rates of applied N fertilizer will result in a lower environmental nitrate load. As expected, the linear regression obtained between the values of applied N vs. soil residual N confirms this conclusion. Analysis indicates that the rate of applied N explains 98% of the variation in residual N. According to the adjusted model (Nresidual = 0.60 x Ntotal applied), 0.6 kg of residual N remains in the soil for every kilogram of N applied, and this represents an average N recovery efficiency of 40% with greater losses than those reported by Ortega and Molina (2003) in corn. An important aspect is that the results from all treatments show that nitrate losses were the highest with the first irrigation (35 to 43%), which is logical considering low crop N demand at early development stages. This raises doubts as to the need of applying N at seeding in wheat. This deeply-rooted practice among producers needs to be reconsidered since it translates into an unnecessary environmental load and higher production. Mellado (1993) demonstrated that higher agronomic efficiency was obtained with winter wheat when the first N split was applied 90 d after seeding. Yields, costs, and NFRE Differences in yield among Pa, Sm, and Pr treatments were not significant (p > 0.05). However, as expected, yields of fertilized treatments were higher than the control treatment W/N (Figure 1). This is positive if we consider that yields can be maintained with lower production costs by reducing N application with increased N efficiency use. Nitrogen accounts for the highest costs in terms of fertilization (Fundación Chile, 2005). In this experiment, N fertilization represented 27% of total labor and input costs per hectare of wheat. Considering the regression analysis, on the average, approximately 60% of applied N remained in the soil. Consequently, the cost of wasted N per treatment was approximately $(Ch)74 000 ha-1 for Pr; $(Ch)48 000 ha-1 for Pa, and $(Ch)20 000 ha-1 for Sm. Differences in NFRE among treatments were significant (p < 0.05) (Figure 2), particularly when comparing Sm with Pr and Pa. These results indicate that for wheat growing in an Alfisol, using N is more efficient when the fertilizer is applied in accordance with the demand of the plant. This agrees with findings by Dunbabin et al. (2009) in Australia where there is a strong interaction between crop development and timing for N fertilizer application. Improving N use efficiency is the most important step in reducing groundwater nitrate load. However, the incentive for farmers to adopt technologies that make this possible is usually increased yields and/or reduced production costs and not a decrease in environmental pollution. CONCLUSIONS Nitrogen losses by nitrate leaching during wheat development did not differ significantly among the evaluated treatments. N balance was positive in all cases, and the quantity of soil residual N was higher for those treatments where more N fertilizer was applied. Furthermore, precision agriculture and chlorophyll meter treatments showed the lowest residual N contents. Regression analysis of applied N vs. soil residual N after harvest showed a significant adjustment, which determined that, on the average, residual N represented approximately 60% of applied N. Between 35 and 43% of leached N is lost after the first irrigation event. Nitrogen split applications with the SPAD meter showed a significantly higher NFRE than the producer and precision agriculture treatments. A more adjusted N rate using advanced tools means less residual N after harvest and a lower risk of groundwater contamination. ACKNOWLEDGEMENTS We wish to express our sincere thanks to Gabriel Muñoz, pioneer producer in the use of Pa technology, and his efficient administrator Carlos Vásquez. Many thanks to the engineers: Claudio Aliaga, Paola Bustamante, Rodrigo Quintana, Lorenzo León, Nelson Becerra of INIA-Quilamapu, and Raúl Eguiluz of INIA-La Platina for their help with the field work. Thanks also to Johanna Beltrán from EULA Center of the Universidad de Concepción, to Valeska Concha for her administrative support, and to all the staff at the Soil Laboratory of INIA-Quilamapu for their valuable help in analyzing samples. LITERATURE CITED
Copyright 2011 - Chilean Journal of Agricultural Research The following images related to this document are available:Photo images[cj11018t3.jpg] [cj11018t2.jpg] [cj11018t5.jpg] [cj11018f2.jpg] [cj11018f1.jpg] [cj11018t4.jpg] [cj11018t1.jpg] | ||||||||||||||||||||||||||||||||||||||||||||||||||||||||||||||||||||||||||||||||||||||||||||||||||||||||||||||||||||||||||||||||||||||||||||||||||||||||||||||||||||||||||||||||||||||||
| |||||||||

