 |
| About Bioline | All Journals | Testimonials | Membership | News |
|
||||||
|
||||||
Research land use impacts on physical-based soil organic matter fractions on three hillside ferrasols in mexico Impacto del uso del suelo sobre las fracciones físicasde materia orgánica en tres Ferrasols de pendientesen México. Francisco Matus1*, Claudia Hidalgo2, Carlos Monreal3, Isabel Estrada2, Mariela Fuentes2, and Jorge Etchevers2 1 Universidad de la Frontera, Departamento de Ciencias Químicas, P.O.
Box 54-D, Temuco, Chile. Current Address: Agriculture and Agri-
Food Canada, Room 4046, 960 Carling Avenue, Ottawa, Ontario, K1A
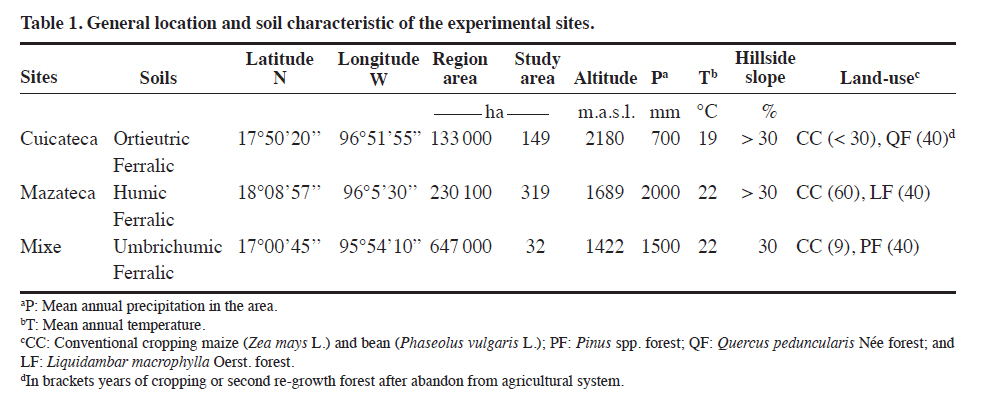
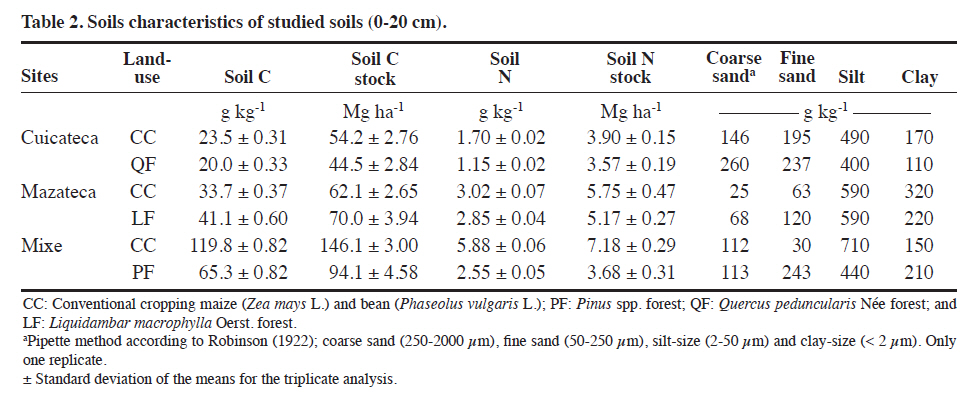
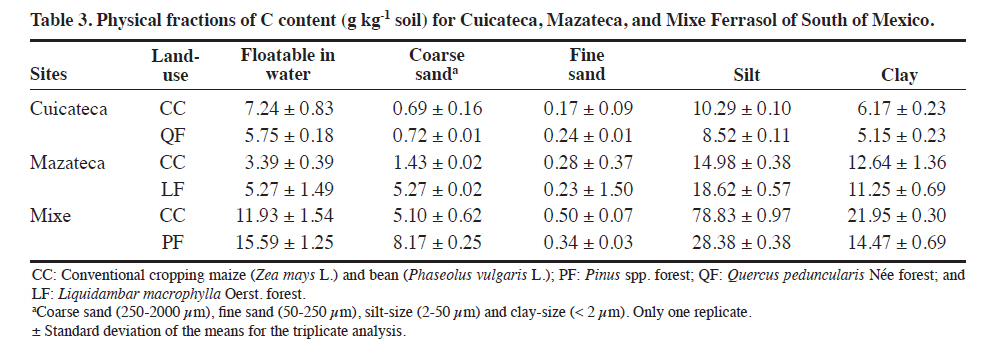
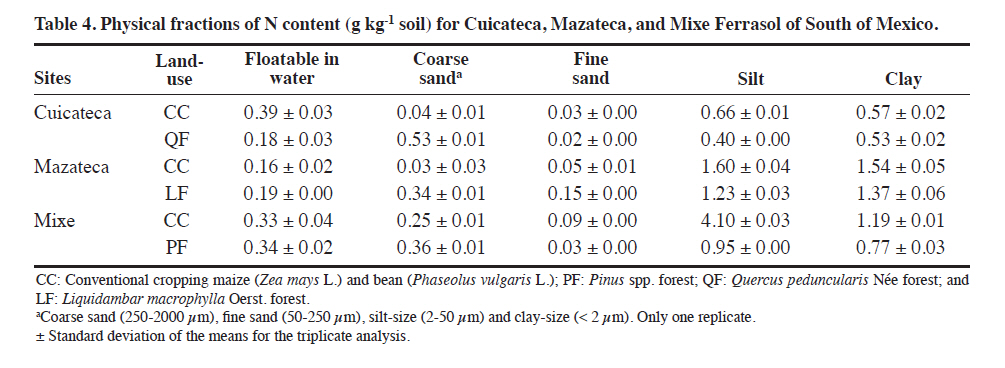
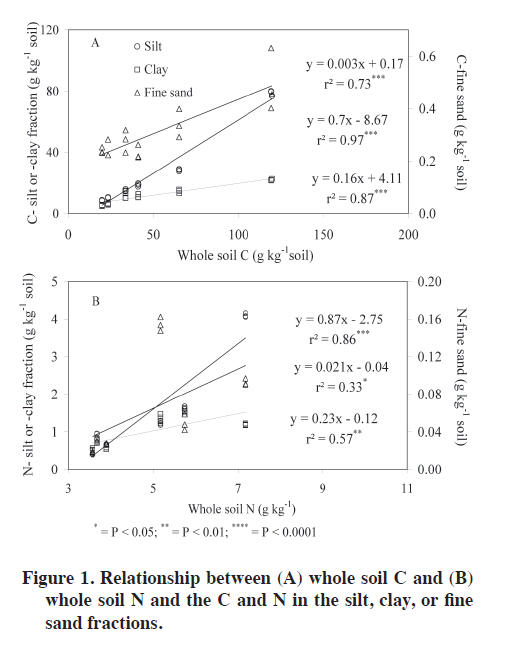
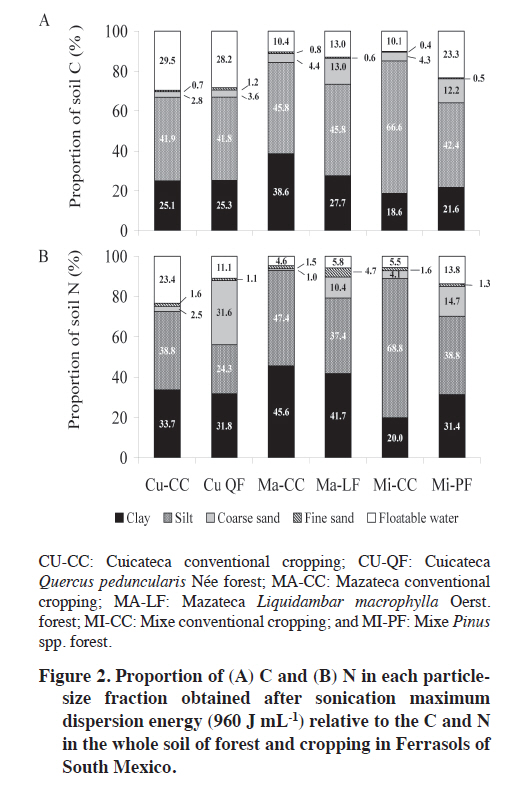
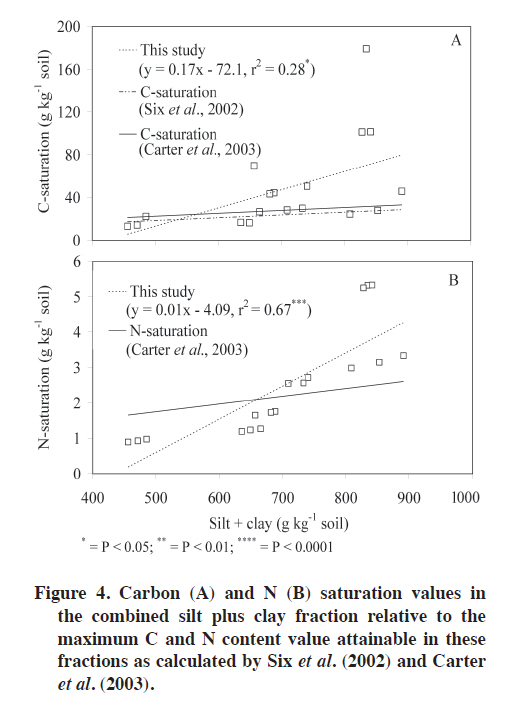
0C6, Canada. *Corresponding author (Francisco.Matus@agr.gc.ca). Received: 25 October 2010. Code Number: cj11034 ABSTRACT The effects of cultivation in hillside (> 30% slope) on soil C and N stocks after forest clearance and subsequent cultivation in new re-growth forest sites not always induce rapid soil organic matter (SOM) loss in subtropical areas. In the present study we evaluated the sensitivity to SOM changes of material floatable in water (Fw), coarse sand (> 250 µm), fine sand (50-250 µm), silt (2-50 µm) and clay (0-2 µm) fractions by the impact of cultivation of Mexican Ferrasols. This research also determined the relative degree of C and N saturation in the silt and clay size particles. The soil physical fractions were obtained after ultrasonic vibration and sedimentation. Soil organic matter stock (0-20 cm depth) in cultivated sites ranged from 54 to 146 Mg C ha-1 and from 3.9 to 7.1 Mg N ha-1 and in the forest soil 46-94 Mg C ha-1 and 3.7-5.1 Mg N ha-1. The relative distribution of C and N was lower in the coarse sand and highest in the silt fraction; the latter paralleled the changes of whole soil C and N. Coarse sand was the most sensitive fraction responding to cultivation, thus representing a diagnostic pool to assess the SOM shifts under cultivation. Half of our studied soil showed a low degree of C and N saturation in the silt and clay fraction indicating potential for accumulation of C and N, while the other half were well above the saturation limit. Key words: Soil C and N, sand-size, SOM saturation, Ultrasonic dispersion. RESUMEN Los efectos del cultivo de ladera (> 30% dependiente) sobre el C y N del suelo y su almacenamientodespués de la tala del bosque y sucesivo cultivo en nuevossitios de crecimiento del bosque no siempre induceuna pérdida de materia orgánica del suelo (SOM) enáreas subtropicales. En el presente estudio se evaluó la sensibilidad del cambio de la SOM del material que flota en agua (Fw), arena gruesa (> 250 µm), arena fina (50-250 µm), limo (2-50 µm) y arcilla (0-2 µm) por el impacto del cultivo en los Ferrasols mexicanos. Este estudio también determinó el grado de saturación relativo de C y N en laspartículas del tamaño de las arcillas y limo. Las fraccionesfísicas del suelo se obtuvieron con vibración ultrasónica yposterior sedimentación. El stock de materia orgánica enlos suelos cultivados varió desde 54 hasta 146 Mg C ha-1 ydesde 3,9 hasta 7,1 Mg N ha-1 y en suelos del bosque 46-94 Mg C ha-1 y 3,7-5,1 Mg N ha-1. La distribución relativa de C y N fue menor en la arena gruesa y mayor en la fracciónde limo; esta última siguió los cambios del C y N delsuelo. La arena gruesa fue la fracción más sensitiva queresponde a los efectos de la cultivación, lo que representaun reservorio de diagnóstico para evaluar los cambios de laSOM bajo cultivación. La mitad de las muestras de sueloestudiadas presentaron un bajo grado de saturación de C y N en las fracciones de limo y arcilla indicando que existe un potencial de estas fracciones para la acumulación de C y N, mientras que la otra mitad fueron muy por encima del límite de saturación. Palabras clave: N y C del suelo, tamaño de arenas, SOM saturación, dispersión ultrasónica. Management systems such as forest-clearance and subsequent food-cropping influence soil organic matter (SOM) stocks and the environmental quality (Diekow et al., 2005). Widespread form of land-use as forestry, agro-forestry and agricultural cropping systems in hillsides play a key role in the social and economy life strategies for small farmers in Southern Mexico. Among management systems in steeped subtropical hillside landscape of Cuicateca, Mazateca and Mixe regions of Oaxaca, cropping after forest clearance, abandonment and subsequent cultivation in re-growth forest ecosystem reduce SOM losses by diminishing mineralization and erosion processes (PMSL, 2004a). Monreal et al. (2005) measured the above- and below-ground C stocks (mineral soil and fine roots) in agricultural (10-60 yr) and degraded secondary forestry (40 yr) in the same Oaxaca soils. They found that below-ground C stocks (0-105 cm) in hillside agricultural soils were similar even higher (100-645 Mg ha-1 ) than those found in adjacent forested sites (101- 244 Mg ha-1 ). About 63% of the C stored below-ground was found in 0-45 cm of agricultural soils compared to 48% of forest soils. Furthermore, González-Molina et al. (2008) studied the variation of soil C stock (0-30 cm) in the position of the slope (far-top and far-bottom) of both, agricultural and forest soils. They found no significant differences in the soil C stock in the slope position and between years, supporting previous findings of low erosion of these cropping systems. Many studies have already investigated the effect of cropping systems on SOM dynamics in subtropical areas (Feller and Beare, 1997), but little is known about changes in soil physical fractions impacted after short term cultivation (> 9 yr) in subtropical and temperate soil of Mexico (Covaleda et al., 2006). The present study was conducted to know the land-use impact on soil organic matter on physical fractionations in the same sites examined by previous authors. It has been extensively reported that sand sized-C (Leifeld and Kögel-Knabner, 2005) as well as the finer size fractions (< 50 μm, < 20 μm or < 2 μm) (Cambardella and Elliott, 1992; Gregorich et al., 2006) are sensitive indicator to land-use and ecological changes. However, sand size and its associated C not always are responsive to land-use change. Leifeld and Kögel-Knabner (2005) reported that density fraction-C (< 1.8 g cm-3) showed no clear response to land-use of long-term grassland conversion to arable and from arable conversion to grassland than total C and C in stable micro-aggregates (20-200 µm). Jastrow (1996) reported that 80% of the C accumulated following prairie restoration was mineral-associated and that the stocks of sand-sized C of macro-aggregates (> 212 μm) were not related to the number (1-10) of growing season of restored prairies. The lack of sensitivity of sand size-C to land use may result from the variation of factors that impact this fraction such as soil texture, isolation technique and time of the years of sampling. Physical disruption of soil aggregates following clearing and cropping of forest may induce a rapid C loss, because of subsequent exposure of organic C and N to the oxidation. In humid soils depletion of C stocks following the conversion of forest vegetation to arable agriculture can be rapid, exceeding 40% within 5 yr (Detwiler, 1986). Considering adequate management strategies to improve SOM content in the forestry and agricultural systems in hillsides of Mexico, a related question is whether the soil or the physical fractions have a finite (protective) capacity (Diekow et al., 2005) to hold organic matter. A saturation limit of C pool in the silt and clay fractions was proposed due to silt + clay protection (Hassink, 1996; 1997; Hassik et al., 1997). Later a whole soil C saturation concept with respect to soil C input rates at steady-state was proposed by Six et al. (2002).This conceptual model included a non-protected C pool, biochemical protected, micro-aggregates protected and silt+clay protected, across 11 agro-ecosystems. The model dictate that a soil below the saturation limit i.e. under saturation deficit in the combined silt and clay particles, has greater capacity to sequester added C, whereas a soil approaching saturation will accumulate a smaller amount of SOM (Hassink and Whitmore, 1997). If the chemically protected pool is fulfilled, added C accumulate in the physically and non-protected fractions which are less stable and subject to increased mineralization (Chung et al., 2008; Gulde et al., 2008; Matus et al., 2008). The objectives of this study were to determine: i) the sensitivity of five physical soil fractions on its C and N storage changes as influenced by cultivation, and ii) the relative degree of C and N saturation of the silt and clay. MATERIALS AND METHODS Soils and site characteristics The study was conducted in three micro-basins representative of the Southern region of Mexico in Oaxaca State, namely Cuicateca, Mazateca, and Mixe where a Sustainable Hillside Management Project (PMSL, 2004b) was established. These sites are characteristic of steep soils (> 30% slope), Ferrasol (FAO-ISRIC-SICS, 1998) where agriculture is carried on by small farmers. At each location, sampling sites included forest that had been subject to slash and burn (for 1 yr) followed by cultivation of maize (Zea mayz L.) and beans (Phaseolus vulgaris L.). Low-input of nutrients has been the traditional farming (conventional cropping) in these locations. After 9 and occasionally up to 60 yr of cultivation food production will be move into new areas where secondary tree vegetation will be replaced. The dominant species in Mazateca and Mixe forest are Clethra hartweggi Britton, Rapanea myricoides (Schl.) Lundell., Liquidambar macrophylla Oerst., Alnus glabrata Fernald, and Pinus spp., while the dominant species in Cuicateca is Quercus peduncularis Née. The micro-basin coordinates and climatic conditions are shown in Table 1. At each micro-basin soils samples were collected from 0-20 cm depth because soil tilling is made by hand (few soil cm depth) and occasional use of animal traction. A total of six soil samples (3 micro-basins × 2 sites) of about 5 kg each were taken at one plot replicate (randomly selected) according to Vergara-Sánchez et al. (2004). The samples were air dried, homogenized, sieved to 2 mm and stored for further analyses. Oven dry (105 ºC) soil characteristics are presented in Table 2. The decision of taking one sample from the conventional cropping and another one from the forest site per micro-basin was based on the following: First, these sites have been intensively studied for C sequestration inventory (Monreal et al., 2005). Second the soil cropping did not result in losses of soil C stock and bulk density by the effect of year of sampling and slope position (PMLS, 2004a; Vergara-Sánchez et al., 2004; González-Molina et al., 2008). Our decision was also based on the robustness of our physical fractionation by improving data reproducibility using triplicate analyses (Taylor, 1999). Published data were also relied upon similar assumption used in this study. Similar one replicated sampling scheme was carried out by Monreal and Janzen (1993) to demonstrate the effects of crop rotation on decadal changes of soil organic matter in a Dark Brown Chernozem. Hidalgo et al. (2010) used just one replicate soil samples obtained from 0-20 cm depth at two experimental plots of degraded volcanic soils where the effect of clay mineralogy on the amount of C sequestered was studied. Physical fractionation From each composite sample, five physical fractions were obtained in triplicate: soil material floatable in water (Fw), coarse sand (> 250 µm), fine sand (50-250 µm), silt (2-50 µm) and clay (< 2 µm). The latter three fractions were separated by ultrasonic energy and sedimentation after removing Fw and coarse sand by wet sieving. The Fw material was obtained as described by Balesdent et al. (1991). Briefly, a 50 g of moist soil sample was suspended in 180 mL of demineralized water in a 500 mL capped plastic bottle containing 10 glass beads (5 mm diameter). After 16 h shaking (40 cycles min-1 ) the soil suspension was poured into a 250 μm sieve. Material remaining on the sieve consisted of large and small visible fragments of plant and animal structures plus coarse sand size particles. The material retained by the sieve was then placed in a glass beaker and washed several times with water. Any floating material was collected and separated from the coarse sand particles. Soil material that passed the 250 μm sieve consisted of fine sand particles plus silt and clay. The separated coarse sand particles were mixed with the materials passing the 250 μm (fine sand, silt, and clay particles), re-suspended in 100 mL of demineralized water, and ultrasonically treated at 910 J mL-1 (power output 37.3 W) with a previously calibrated Fisher Sonic Dismembrator, Model 300, equipped with a titanium probe with flat tip (18.8 mm diameter and 56 mm length) operating at 20 kHz. Coarse- and fine sand particles size was separated by wet sieving. Clay and silt were obtained separately after corrected settling time by gravity sedimentation, applying Stoke’s law at room temperature. Less than 15 decantation cycles were required before clear supernatant was obtained for each of the silt and clay fraction. During decantation, any visible floatable material remaining in suspension was collected and added to the Fw . All collected fractions were oven dried at 60 ºC and weighted (Six et al., 1998) On average, the amount of soil material recovered amongst all particle size fractions after dispersion and fractionation was about 102%. The slope of standard major axis regression (see data analysis) (R2 = 0.76, P < 0.01) and 1:1 bisector of soil mass obtained for coarse-, fine sand, silt and clay by particle-size analysis using pipette method (Robinson, 1922) and maximum ultrasonically dispersion at 910 J mL-1 showed no significant difference. The physical fraction of silt plus clay (< 50 µm) showed no visual evidence of plant and animal fragments that could have been transferred from both sand fractions during sonication and sedimentation as observed under scan electronic microscope (SEM). Soil carbon and nitrogen determination The C concentration for Fw, particle-size classes and whole bulk soil samples was determined using an automatic C analyzer (TOC, Shimadzu 5000 SSM). The N concentration in the same samples was determined by the micro-Kjeldahl procedure of Bremner (1996). Carbon and N content in the Fw, sand- (including coarse- and fine-sand), silt- and clay-size fractions were obtained by multiplying the C and N concentration of each fraction by its corresponding mass. The soil C stocks at 0-20 cm in the whole soils were obtained by multiplying the C and N concentration by its corresponding bulk density. The estimations of the soil bulk density in the same sites were done as described earlier (PMLS, 2004a). Impact of land-use on relative changes of soil carbon and nitrogen The relative change of C or N (%C or %N change) in the whole and in the physical fraction of the cultivated soil sample was calculated as: %C (or %N) change = where: CF (or NF) is the C or N as percentage of the total C or N in the whole soil sample or in the physical fractions of forest sites and CC (or NC) is the C or N as percentage of the total C or N in the whole soil sample or in the physical fractions of cropping sites. Soil organic matter saturation in physical fractions The protective capacity is the maximum amount of SOM associated to the silt and clay particles of a soil. The protective capacity of SOM (C- and N-saturation) in the silt+clay particles (< 50 µm) (g kg-1 soil) was estimated by using the model proposed by Six et al. (2002) and Carter et al. (2003). We used the model of Carter et al. (2003),because unlike the model of Six et al. (2002), Carter et al. considered the N from a wide Canadian data set: C -saturation (Carter et al.) = 9.04 + 0.027 (silt + clay) [2] N -saturation (Carter et al.) = 0.65 + 2.2x10⁻⁴ (silt + clay) [3] C -saturation (Six et al.) = 5.5 + 0.026 (silt + clay) [4] We assume that there is a linear relationship between the silt+clay content of the soil and their SOM in the silt and clay particles. Therefore, the C and N in the silt and clay fraction of any soil below the maximum (equation 2, 3 or 4) were considered to show a degree of C or N saturation. Data analysis The statistical package SMATR V.2.0 (Warton et al., 2006) was used to examine the bivariate relationships between soil properties (e.g. particle size analyses and the yield weight of each physical fraction after fractionation). This package computes standardized major axis (SMA), which, in contrast to least squares (or ‘model I’) regression, minimizes variance from the best line in the x and y dimensions. This is important when the primary concerns are the slope and/or intercept of a relationship, rather than a significant correlation or predicting one variable from another. The use of least squares regression models will give misleading estimates of the slope of such relationships when correlation coefficients are low (Warton et al., 2006). RESULTS Soil carbon and nitrogen In general the agriculture plots under conventional cropping showed a greater accumulation of C and N than the forest plots in the 0-20 cm depth of Ferrasols. The soil C content in cropped soils ranged from 24 to 120 g kg-1 soil and soil N ranged from 1.7 and 5.9 g kg-1 soil. For forest soils, these values ranged between 20-65 g C kg-1 soil, and 1.2-2.9 g N kg-1 soil. Soil samples taken from the Mixe showed the highest C and N content, while the samples from Cuicateca plots, the lowest one (Table 2). Mixe and Cuicateca showed highest C content in the cropped soils,while Mazateca showed similar values in the forested and cropped plots. Similar trends were observed for N,but cropped soils always showed the highest N content. The soil C stock in the top 20 cm of cropped soils varied from 54 to 146 Mg ha-1 and for soil N between 3.9 and 7.2 Mg ha-1, while, the soil C stock in the forest soils ranged from 44.5 to 94 Mg ha-1 and for soil N between 1.2 and 2.6 Mg ha-1 (Table 2). Bulk density values in cropped and forest soils ranged from 0.6 to 1.2 g cm-3 (data not shown). Noteworthy, soil samples taken from the cropped Mixe sites, still presented visible intact and partially decomposed tree litter after 9 yr of cropping. Bulk densities in cropped soils were similar than those of forest soils. Table 2 shows that the clay content ranged from 110 to 320 g kg-1 soil and soil samples taken from the Mazateca plots showed the highest clay content. For all soils the decreasing content of coarse sand was strongly associated with an increase of clay, rather than to a variation in fine sand and silt content. In all soils the silt content was highest one and ranged from400 to 710 g kg-1 soil. The largest difference of silt content between forest and cropped soils was in the Mixe plot, 440 versus 710 g kg-1 soil, respectively. Distribution of carbon and nitrogen in the physical fractions The amount of C and N content in the various particle size fractions is presented in Tables 3 and 4. Silt content was higher than any other size separates and generally contained most of C and N followed by the clay fractions.In general the lowest C and N content was found in the fine sand fraction followed by the coarse sand and Fw. Interestingly, the changes of soil C and N in the whole samples (attributed to cultivation) paralleled those in all fractions especially in the silt (Figure 1A). The r2 between the soil C content in whole samples and the C in the silt was 0.97, while in the fine sand it was 0.73 and in the clay it was 0.87 (all significant at P < 0.0001). The other fractions did not show the same close relationship. For N,the r2 values were 0.86, 0.33, and 0.57 (Figure 1B). Figure 2 shows the proportion of C and N in the physical fractions expressed as percentage of their total mass. The Cuicateca and Mixe cropped soils that showed an increase in the total soil C content showed generally an increase of soil C for the silt and a loss for the coarse fractions after cultivation (Figure 2A). Similar trends were also observed for soil N in the various physical fractions (Figure 2B). Furthermore,the C- to N-ratio of the silt fraction was generally higher than that of the clay fraction and followed closely that of whole sample in all sites (data not shown). Figure 3 shows the relative change of C and N in each physical fraction after nine years of cultivation with respect to the forest soil samples. The relative change in the whole soil and in all fractions fluctuated c.a. -92 and 131% and coarse sand always showed a net decline in C and N content while the silt fraction showed generally a relative increase. Saturation of soil organic matter in physical fractions Figure 4 shows the C and N saturation of the combined silt plus clay fraction relative to the maximum C and N content attainable in these fractions according to the models of Six et al. (2002) and Carter et al. (2003). The maximum C saturation values using the model of Carter et al. (2003) ranged from 22 to 32 g C kg-1 soil. Using the model of Six et al. (2002) the C saturation ranged from17 to 28 g C kg-1. Both models give similar trends and values (Figure 4A). In our study the C saturation (y = gC kg-1 soil) was estimated (y = -72.1 + 0.17x, r2 = 0.28, P < 0.05), where x is the silt+clay content (g kg-1 soil). The slope calculated was more than six time higher than that of Six et al. (2002) and Carter et al. (2003). We also estimate the N saturation from full data set of cropped and prairie soils of Canada from Elustondo et al. (1990) and used by Carter et al. (2003). The estimate values ranged from 1.7to 2.5 g N kg-1 soil (Figure 4B). Our protective capacity for N (y = g N kg-1 soil) was (y = 0.01x - 4.09, r2 = 0.67, P < 0.0001), where x is the silt+clay content (g kg-1 soil). On average the content of C and N in the silt plus clay fraction was about 25% (18.24 g C kg-1 soil) and 60% (1.08 g Nkg-1 soil) below the maximum SOM in Cuicateca, while this value was slightly higher in the Mazateca, 114% (34.5g C kg-1 soil) and 121% (89 g N kg-1 soil) and greater than the saturation limit in Mixe, 306% (89.9 g C kg-1 soil) and152% (3.51 g N kg-1 soil). DISCUSSION Soil organic matter changes after cultivation Soil organic matter stock in cropped soils (54-146 MgC ha-1 and 3.9-7.2 Mg N ha-1) were higher than that in the forest soils (44.5-94 Mg C ha-1 and 1.2-2.6 Mg N ha-1). Similar values were measured by Monreal et al. (2005) who quantified the above- and -below ground C stock in the same plots studied here and by Vergara-Sánchez et al. (2004), who also reported the spatial variability of soil C in the same hillside soils. Our data shows that soil C stocks represent mostly the influence of management practices involving hand tilling and occasional plowing by animal traction. The differences in soil C stock between cropped and forest hillside soil samples may indicate that decades of maize and beans cultivation induce the accumulation of a greater amount of C and N than forest systems with the only exception of Mazateca forest samples that showed the highest C stock. These findings were in agreements with the data showing soil losses by erosive processes were negligible in the cropped soils measured between 2001 and 2004 (PMSL, 2004a). Also soil C content did not relate with the slope position, measured in the year 2000 and 2004 (González-Molina, 2008). In the present study, the C and N content in the coarse- and fine-sand fraction were the lowest and their content also decreased with cultivation; while their content in the silt fraction always followed the changes observed in whole soil samples. This means the silt fraction plays an important role in SOM accumulation in these silty loam Ferrasols. This may be explained in terms of aggregation and the mechanisms controlling their formation. The silt size fraction can be considered as a partially reactive fraction (Virto et al., 2008). The increase in silt-C and -N may be due to this fraction contains a mixture of plant fragment residues and mineral-associated organic matter (Diekow et al., 2005), but also due to mineral-organic matter associations and aggregation (Denef et al., 2004).Furthermore, our ultrasonic dispersion could affect the distribution of organic matter fractions (Oorst et al., 2005). In the present study, however, SEM did not show plant fragments in the sand size fraction and within the pore space of the silt fractions. Silt fraction consisted of rather larger bound particles which in turn were made up of smaller grain particles. The latter characteristic indicates a relatively high void volume as part of the arrangement of architectural units. Thus, the architectural and primary particles assemblage influences SOM storage of a less processed organic microbial material particularly in soils with high proportion of silt fraction in microaggregates 50-250 µm according to Monreal and Kodama (1997). This aggregate fraction created the most favorable environment for the establishment the habitat for actinomycete and bacteria (Monreal and Kodama, 1997). In the present study the proportion of soil C in the silt averaged 47% of the whole soil compared with 26% in the clay fraction. The lower C to N-ratio of the clay compared to the silt fraction and whole soils indicates a more microbial origin. This point out that SOM associated with the clay was processed by soil organisms to a greater extent than that in the corresponding silt fraction. The C and N content in the Fw and coarse sand-size fraction showed no consistent relationship with their content in whole soil samples. In the present study, both the sand and silt fractions better reflected the anthropogenic disturbance of cultivation than any of the other particle size fractions. Soil organic matter may be loosely associated with the sand-size fraction indicating that SOM in the sand size fraction are easily affected by cultivation. However, land-use changes not always impact the sand size fraction (Jastrow, 1996; Leifeld and Kögel-Knabner, 2005). This also might be associated to different biochemical composition of SOM resulting in different sensitivity to cultivation. Our results also complement those reported by others: Covaleda et al. (2006) studied the SOM of an Acrisol from Mexico after 2yr of cropping. They reported a significant decrease in the C and N in very coarse sand aggregate (2-0.2 mm) under conventional management and an increase in the C and N contents in the fine silt aggregates (< 50 µm) under organic management practices. Diekow et al. (2005) studied the C and N stocks of soil physical fractions to evaluate the influence of cereal- and legume-based cropping on a non-tilled Acrisol in Southern Brazil. They computed a C management index (CMI) using density separation of sand-size and light fraction. The CMI was sensitive for monitoring changes of SOM compared with more stable mineral associated organic matter in subtropical soils. Denef et al. (2004) identified and isolated diagnostic SOM fractions in two temperate and one tropical (Brazilian Oxisols) soils of different mineralogy under conventional cropping and no-tillage. In all soils, the total SOC was greater in no-tillage than in conventional cropping. More than 90% of the total difference in soil C between the two systems was explained by the difference in the microaggregates (< 53 µm) protected within macro-aggregates(< 250 µm) in the three soils. Saturation of soil organic matter in the silt and clay particles The C and N in the silt+clay fraction were compared to the maximum C and N content attainable in these fractions as by Six et al. (2002) and Carter et al. (2003). Our results indicate the potential sink of C and N accumulation for the silt and clay size fractions in Cuicateca soils as indicated by the C and N saturation from literature. Ferrasols with a C and N above this limit appear to have space to store additional SOM, especially in the silt fraction. Clay fraction was less responsive to the soil C and N changes. It may indicate different mechanism of SOM stabilization (Gulde et al., 2008).In the clay fraction the mechanism of adsorption and stabilization of by-products of microbial metabolism takes place, while in the silt fraction the architectural and primary particles assemblage for as SOM accumulation may explain the storage of silt C-pool. CONCLUSIONS In this study the protected and non-protected organic matter accomplish the C and N storage in these agricultural and forestry sites revealing the complexity of these systems of hillside Ferrasols of Mexico. The content of C and N in the coarse sand size fraction was more sensitive to express the relative change in SOM content induced by cultivation than those shown by a material floatable in water (Fw), fine-sand silt and clay. While the relative C and N content in the coarse sand size fraction was lower in the cropped than in the forest soils,the SOM content increased in the silt size fraction and paralleled changes of SOM in whole Ferrasol samples. The maximum SOM protective capacity of the combined silt plus clay fraction using the linear model of Six et al. (2002) and Carter et al. (2003) give similar values, while the slope of our estimates were much higher. On average, one third of the samples presented low C and N values relative to the maximum expected, indicating potential for additional SOM storage in the silt and clay fraction; the other two third of the soils samples are above this limit,because SOM accumulated in the silt fraction. ACKNOWLEDGEMENTS We thank to CONACYT (Mexico), the European Union (REVOLSO Project) and the GEF/World Bank (PMSL Project) and FONDECYT-Chile (projects numbers 1060421 and 1080065) for their financial contributions to this study. We also thank to Dr. Morris Schnitzer, Emeritus Distinguished Research Scientist, Agriculture and Agri-Food Canada, Ottawa, Canada, and Dr. Dries Huygens, Universidad Austral de Chile, Valdivia, Chile, for their valuable comments on the manuscript. We are greatly indebted from the editor and the two anonymous referees for their helpful criticism on the manuscript. LITERATURE CITED
Copyright 2011 - Chilean Journal of Agricultural Research The following images related to this document are available:Photo images[cj11034t1.jpg] [cj11034t2.jpg] [cj11034t4.jpg] [cj11034f1.jpg] [cj11034f4.jpg] [cj11034f2.jpg] [cj11034f3.jpg] [cj11034t3.jpg] |
| |||||||||
