 |
| About Bioline | All Journals | Testimonials | Membership | News |
|
||||||
|
||||||
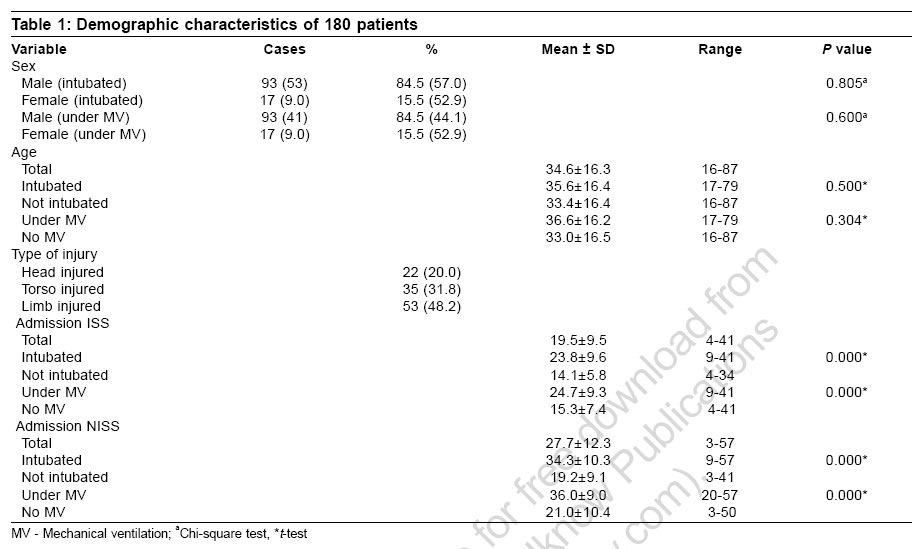
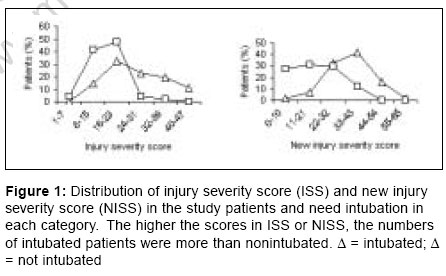
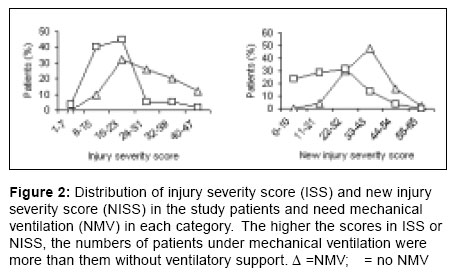
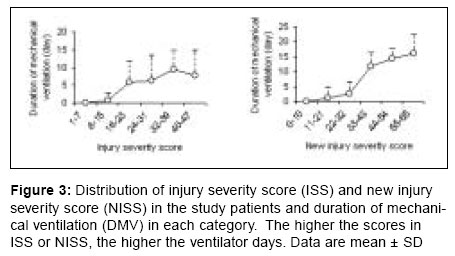
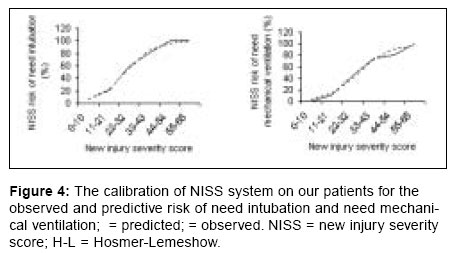
Indian Journal of Critical Care Medicine, Vol. 10, No. 4, October-December, 2006, pp. 219-224 Research Article The new injury severity score: A more accurate predictor of need ventilator and time ventilated in trauma patients than the injury severity score Honarmand Azim, Safavi Mohammadreza Department of Anesthesiology and Intensive Care, School of Medical Science, Isfahan University, Isfahan Code Number: cm06030 Abstract Objectives: This study validates the accuracy of the injury severity score (ISS) and the new injury severity score (NISS) systems for prediction of need intubatin (NI), need mechanical ventilation (NMV) and duration of MV (DMV) in intensive care unit (ICU) trauma patient admissions.Design: On the day of admission, data were collected from each patient to compute the ISS and NISS. Setting: Prospective cohort study. Materials and Methods: One hundred and ten nonselected trauma patients were included in our study in a consecutive period of six months. Results: The predictive accuracies of the ISS and the NISS were compared using receiver operator characteristic (ROC) curves and Hosmer-Lemeshow (H-L) statistics for the logistic regression model of ICU admission. For prediction of NI, the best cut-off points were 22 for ISS and 27 for NISS. The positive prediction value was 91.6% in NISS and 87.8% in ISS. The Youden index had best cut-off points at 0.47 for NISS and 0.57 for ISS. The area under ROC curve was 0.79 in the ISS and 0.86 in the ISS. There were statistical differences among NISS with ISS in terms of Youden Index and the area under the ROC curve ( P <0.05). For the prediction of NMV, NISS yielded significantly better results in the area under the ROC curve and Youden index than those of ISS ( P <0.05). None of the two scoring systems provided good discrimination in prediction of more than three or five days assisted-ventilation under MV. Conclusions: For prediction of NI or NMV, the NISS has better accuracy than ISS. Keywords: Injury severity score, iIntubation, mechanical ventilation, new injury severity score Many different clinical conditions can lead to respiratory failure and mechanical ventilation.[1] The length of time a patient remains on mechanical ventilation depends on the cause and severity of respiratory failure.[2] A common difficulty in the intensive care unit (ICU) is predicting the weanability of patients following prolonged mechanical ventilation.[3] Many clinically measured parameters and calculated laboratory variables have been investigated as possible predictors of mechanical ventilation dependency and outcome.[3] Measurements reflecting lung mechanics (e.g., tidal volume, lung and chest wall compliance), the strength of respiratory muscles (e.g., peak inspiratory pressure) and gas-exchanging capability (e.g., Paco 2 ) have been proposed to predict the success of discontinuing mechanical ventilation.[4],[5] Although pulmonary function tests are important in determining mechanical ventilation dependency, other components of the clinical situation need to be considered when attempting to wean a patient from mechanical ventilation.[3] Illness severity scoring systems have become important tools for the study of patient outcomes relating to withdrawal of mechanical ventilation.[2],[6],[7],[8] The direct correlation between these scores and duration of ventilation may initially surprising, since they do not specifically include pulmonary function tests or weaning parameters. There appear to be several reasons for this correlation and several advantages to incorporating general severity of illness score as part of a comprehensive approach to predicting duration of mechanical ventilation: First, they include many respiratory physiologic variables, such as respiratory rate, P (A-a) O 2 , PaO 2 and PaCO 2 that are known to be influential determinant of successful weaning.[9] Second, they include nonrespiratory variables, such as a neurologic assessment and chest wall or lung injury scale which influence the duration of ventilation. The impact of these nonrespiratory variables on the duration of ventilation is considerable, may be underestimated by physicians and is not included in many traditional weaning indexes.[5] Finally, these scores, while not requiring specific pulmonary function testing, dose provide an objective summary measure of many respiratory and nonrespiratory variables that are important to weaning and mortality risk and thus duration of ventilation. On the other hand, ICU patients requiring mechanical ventilation have a high mortality and consume disproportionate amount of nursing and financial resources.[10],[11] The ability to systemically predict the duration of ventilation for a general ICU population would also be useful for examining resource allocation, designing and evaluating clinical trials and as a mean for analyzing practice pattern among ICUs.[9] Since its creation in 1974 by Baker et al[12] the injury severity score (ISS) has been considered the "gold standard" in anatomic injury severity indicators. ISS is used to describe trauma populations, to evaluate the quality of trauma care[13],[14] and to control for case mix in trauma research.[15] ISS sums the severity score for the three most severe injuries, but it only considers one injury per body region. Therefore, one can suspect that the ISS underscores the severity in trauma victims with multiple injuries confined to one body region.[16] Perhaps the most important drawback of the ISS cannot be addressed with statistical techniques: the ISS only considers one injury in each body region. This leads to injuries being overlooked and to less severe injuries occurring in other body regions being included in the calculation over more serious ones in the same body region.[17] A simple modification to the ISS, the new injury severity score (NISS), was designed by Osler et al in 1997 to counter this problem.[13] The NISS is simply the sum of squares of the three most severe injuries, regardless of body region injured. Therefore, the NISS will be equal to or higher than the ISS. Lavoie et al[18] study showed that significantly more patients required prolonged mechanical ventilation (PMV) if they had any one of the following: Swan-Ganz, ISS more than 20, PaO 2 /FiO 2 less than 250 or fluid retention more than 2000 cc at 48h. Despite the fact that the ISS was designed to predict death, it is also used to model many other outcomes such as hospital stay, ICU stay, time ventilated, complications and emergency surgery.[19] There were no studies to evaluate NISS in predicting duration of mechanical ventilation and investigate any potential advantages of NISS over ISS in this relation. The purpose of this study was to determine whether the ISS or NISS is a predictor of need-ventilator and time-ventilated in general and in subgroups of trauma patients according to age, penetrating trauma and body region injured. Materials and Methods The database consisted of prospectively identified, consecutive trauma patient admissions in Alzahra hospital. Between May 2005 and October 2005, all consecutive trauma admissions during the six month period with age older than 16 years and survival greater than 24h were entered into the study. For the purpose of this study, patients who suffered burn trauma, patients who were dead on arrival at the emergency department or patients with isolated hip fractures, because these constitute a unique population of patients with a high probability of death, were excluded. The Institutional Review Board at university approved the study. abbreviated injury scale (AIS) coding is performed by a trained physician from patients' medical files. This parameter takes values from 1 to 75 and is computed from AIS severity values, which vary from 1 to 6. The ISS is the sum of squares of the largest AIS severity value from each of the three most severely injured body regions. Any patient with an AIS value of 6 is automatically scored 75 on the ISS scale. NISS values were computed as the sum of squares of the three highest AIS values, regardless of body region. During ICU stay, patients' need intubation or assisted ventilation and duration of mechanical ventilation were evaluated. The ISS, the NISS, partial arterial oxygen tension (PaO 2 )/inspired fraction of oxygen (FiO 2 ), net fluid balance fluid (retention more or less than 2000 cc), calculated during 48h after surgical intensive care unit admission. The objective criteria for ventilator discontinuation readiness were defined as[1] passage of the spontaneous breathing trial (SBT screen and[2] successful completion of a 30 min SBT performed on flow-by mode, PS ≤8 cm H 2 O on PEEP ≤ 8 cm H 2 O or T piece. Successful discontinuation of mechanical ventilation was defined as continuous independence from ventilator support for a 24h period.[20] Data analysis The sensitivity, specificity and correct prediction of outcome for each cut-off point were calculated in MedCalc ® version 9.0.1.1.for ISS and NISS. The best cut-off point in each scoring system is determined when the point yields the best specificity and sensitivity in the two-by-two table. The best Youden index also determines the best cut-off point. The Youden index is used to compare the proportion of cases correctly classified. The higher the Youden index[21] the more accurate is the prediction (higher true positive and true negatives and fewer false positive and false negatives) at the cut-off point. Descriptive statistics were expressed as mean ± SD unless otherwise stated. A receiver operating characteristic (ROC) curve[22] depicts the relation between true positive and false positive for each scoring system. This method compares scores without fixing arbitrary cut-off points. The ROC curve is calculated by the MedCalc ® version 9.0.1.1. The area under the ROC curve is evaluated. Such an area represents the probability that a randomly chosen diseased subject is more correctly rated or ranked than a randomly chosen nondiseased subject.[22] A value of 0.5 under the ROC curve indicates that the variable performs no better than chance and a value of 1.0 indicates perfect discrimination. A larger area under the ROC curve represents more reliability[23] and good discrimination of the scoring system. The value of the Hosmer-Lemeshow statistic was obtained by SPSS 11.0. Values of more than 15.5 represent poor agreement of calibration between the outcomes estimated from the model and the observed outcomes. Lower chi-square values and higher P values are associated with a better fit. A good fit was defined as P > 0.05. Results One hundred ten trauma patients were admitted into our ICU in a 10 month period. Their ages varied from16 to 87 years with a mean of 34.65 ± 16.34 years. There were 93 males and 17 females [Table -1]. Of all trauma patients enrolled in the study, blunt trauma accounted for 90.9% of the admissions. The patients also were grouped according to region injured: 1) head (skull, face and neck); 2) torso (chest, abdomen and pelvic content); and 3) limbs including pelvic girdle. Sixty-two (56.4%) patients needed intubation in ICU; fifty (45.5%) patients needed respiratory support under mechanical ventilation (MV). Among the intubated patients, 50 (80.6%) patients were supported by MV.Admission ISS and NISS scores (0-24h) were significantly higher in patients need intubation (NI) or mechanical ventilation (NMV). The distribution of scores on day 1 and probability of need intubation (NI) or mechanical ventilation (NMV) and duration of mechanical ventilation (DMV) or intubation (DI) derived from each scoring system are shown in [Figure - 1][Figure - 2][Figure - 3]. The sensitivity, specificity, correct prediction outcome, Youden index and area of the ROC curve at the best cutoff point for NI or NMV are presented in [Table -2] and 3. There are statistical differences in Youden index and area under the ROC curve between NISS with ISS for NI or NMV. In both NI and NMV, the NISS provides good results, as shown in [Table -2][Table -3]. By contrast, ISS, yield poor results. Therefore, NISS plays a crucial role in the prediction of NI or NMV. None of the three scoring systems provide good discrimination in prediction of more than three or five days respiratory support under MV (AUC < 0.5). The calibration of the NISS system is adequate for prediction of NI or NMV, as shown in [Figure -4].Discussion In comparing the NISS with the ISS, we find the accuracy of the NISS is significantly better than that of the ISS for prediction of need intubation or mechanical ventilation. The NISS is certainly a more logical choice of anatomic trauma severity measure.[24],[25] For example, a patient with three injuries to the head/neck or spine, all with AIS values of 5, will have an ISS value of 25 but an NISS value of 75. Meanwhile, a patient with AIS values of 5 in three different body regions will have both an ISS and NISS value of 75. A comparison of the two patients based on their ISS would therefore be inaccurate.[19] This study demonstrates that in addition to making more clinical sense, the NISS is also a more accurate choice from a statistical standpoint. The NISS is not much better than the ISS in the prediction of duration of MV, because many biases are found in the use of these systems. First, treatment error is not predictable, especially in surgical patients.[26] Second, the data collected on the day of admission may not reflect completely the unforeseen events which may be major determinants of outcome.[27] Third, the co-morbidity condition[28] is not taken into account enough in these systems. There are severs potential uses for the relations on predicting NI or NMV. First, the equation provides a new tool for quality assessment and improvement.[9] Mechanical ventilation constitutes one of the greatest personnel, resource and financial commitments for most critical care units, but, to date and to our knowledge, there has not been an adequate method for ICU managers to assess ventilator utilization or compare their unit's practices to those of other ICUs after adjusting for differences in patients treated.[9] If an ICU has more patients requiring intubation or ventilator and longer duration of ventilation than predicted over a prolonged period, this may represent sufficient evidence for a study of the unit's ventilator practice. Such an internal study might discover that patients in certain diagnostic categories are routinely ventilated longer than similar patients in the other units. Alternatively, the study might discover opportunities for streamlining or improving ventilatory practices. The ICU manager could then institute quality improvement measures, e.g., establish improved weaning protocol and use future analyses to document the impact of those changes.[29],[30] Patients undergoing prolonged (seven days or more) ventilation represented 52.6% of all ventilated patients and 18.2% of all ICU admission in our study. Such patients consume a disproportionate amount of technological and financial resources and reimbursement is frequently incomplete. Several studies have reported the success of intermediate care units, noninvasive respiratory units, long-term weaning facilities and multidisciplinary "weaning teams" in maintaining quality of care at a substantial cost saving and less resource use.[31],[32] Further research is needed but our study may have an application in helping to identify a selected group of ventilated patients with a predicted long duration of ventilation (i.e., > seven days) who might benefit from wean team consult or early consideration for transfer to a subacute facility. To our knowledge, this study is the first to date to investigate the question of whether NISS more accurately predicts need intubation on mechanical ventilation than the ISS. One flaw of this study is associated with the well-known lack of data precision, which plagues all trauma registries.[33] Most importantly, coding errors could affect the accuracy of the AIS values assigned. Physicians cannot be blinded to patients' status. It is therefore possible that they may pay more attention to AIS coding of intubated than of nonintubated. This bias would lead to an underestimation of injury severity among intubated compared with non-intubated and would artificially increase the accuracy of AIS-based severity measures in predicting outcome. Because ISS/NISS values are based on the same AIS codes, however, this bias should not affect the comparison of the two measures. It would also be interesting to verify whether the differences in NISS/ISS predicting power hold up for Level II or III trauma centers and to perform analyses according to the presence or absence of comorbidities. In conclusion, we have shown that the NISS outperforms the ISS in predicting NI or NMV. One result of our study has been an emphasis on better outcome analysis and improved cost-efficiency. We recommend that future studies adopt the NISS for controlling bias caused by trauma severity case mix but that particular attention be paid to the form of the variable introduced into regression models. When predicting NI or NMV from trauma, the importance of investigating the contribution of other risk factors such as age, comorbidity, physiologic indicators, injury mechanism and body area injured should not be overlooked. This work is preliminary, but we believe that, because of these results, further efforts to define outcome- documentation, analyze practice pattern and improve cost-efficiency for mechanical ventilation and other high-cost technologies common to ICUs are warranted.References
Copyright 2006 - Indian Journal of Critical Care Medicine The following images related to this document are available:Photo images[cm06030f2.jpg] [cm06030f3.jpg] [cm06030t3.jpg] [cm06030t2.jpg] [cm06030f1.jpg] [cm06030f4.jpg] [cm06030t1.jpg] |
| |||||||||