 |
| About Bioline | All Journals | Testimonials | Membership | News |
|
||||||
|
||||||
Indian Journal of Critical Care Medicine, Vol. 10, No. 4, October-December, 2006, pp. 230-234 Research Article Correlation of mixed venous and central venous oxygen saturation and its relation to cardiac index Ramakrishna MN, Hegde DeviPrasad, Kumaraswamy GN, Gupta Ratan, Girish TN Consultant Intensivist, Adult ITU, Narayana Hrudayalaya Institute of Medical Sciences, 258/A, Bommasandra, Anekal Taluk, Bangalore Code Number: cm06032 Abstract Background and Aim: The clinical applicability of substitution of central venous oxygen saturation for mixed venous oxygen saturations in monitoring global tissue hypoxia is still a matter of controversy. Hence aim of the study is comparison of paired samples of mixed venous and central venous oxygen saturation and comparison in relation to cardiac index in varying hemodynamic conditions.Materials and Methods: Prospective clinical observation: Postoperative cardiac surgical ITU: 60 adult patients, >18 years of age of either sex: A PAC was inserted through® IJV, triple lumen catheter was inserted through® IJV. Blood samples were taken from distal tip of PAC and central venous catheters. An arterial blood sample was drawn from either radial or femoral arterial line. Measurements: Continuous cardiac output monitoring. Analysis of blood samples for hemoglobin concentration and oxygen saturation. Mixed venous oxygen saturations and central venous oxygen saturations were compared. The study was carried over a period of 30h in the postoperative period and samples were taken at 6h intervals. Patients were classified into three groups as follows depending on the CI: Low (< 2.5 L/m 2), medium (2.5-4 L/m 2), high (> 4 L/m2) and correlated with Svo 2 and Scvo 2 . Results: 298 Comparative sets of samples were obtained. Svo2 was consistently lower than Scvo2 throughout the study period. The difference was statistically significant. By using Bland - Altman plot, the mean difference between Svo 2 and Scvo 2 (Svo 2 -Scvo 2 ) was - 2.9% ± 5.14 and confidence limits are + 7.17% and - 12.97%. The co-efficient r is > 0.7 throughout the study period for all paired samples. The correlation Svo 2 and Scvo 2 with cardiac index in all the three groups were >0.7. Conclusion: Scvo 2 and Svo 2 are closely related and are interchangeable. Even though individual values differ trends in Scvo 2 may be substituted for trend in Svo 2 Keywords: Cardiac index, central venous oxygen saturation, mixed venous oxygen saturation, shock Introduction Shock is defi ned as the presence of global tissue hypoxia secondary to an imbalance between systemic oxygen delivery and demands. The pathological processes involved in shock are complex and varied. Clinical indicators of shock that are used in the early phase of resuscitation include heart rate, blood pressure urine output and mentation and skin temperature. These variables are prone to compensatory mechanism and are late signs of adequate oxygen delivery and even if normalized, global tissue hypoxia still exists. Biochemical estimates of shock include serum lactate, ph, base deficit and anion gap in common with other global indices, which may be normal in the presence of significant regional ischemia and subject to a time delay and cannot be used for continual monitoring. The global tissue hypoxia if left untreated, leads to anaerobic metabolism and oxygen debt. The magnitude and duration of oxygen debt have been implicated in the development of multi system organ failure and increased mortality. This had lead to further investigation into more invasive means of assessing the adequacy of O 2 delivery and consumption.Mixed Venous Oxygen Saturation (Svo2) The measurement of mixed venous oxygen saturation is used as a surrogate for the balance between systemic oxygen delivery and consumption. The clinical advantage of monitoring Svo 2 is that unlike biochemical markers, it is not subject to a significant time delay. Declines in Svo 2 preceded the fall of myocardial function and shock although physiological signs were within normal limits. It is a predictor of poor outcome in postoperative cardiothoracic patients, septic shock and cardiogenic shock. The technique also lends itself to continuous measurements by means of reflection spectrophotometry.Limitations of Mixed Venous Measurements Measurements of Svo 2 requires placement of a PA catheter with a risk versus benefit relation that is still a matter of controversy. It is only possible to obtain mixed venous blood from a PAC which limits the use of Svo 2 to an intensive care setting. Information from Svo 2 will only be available after ICU admission and once resuscitation is already underway, hence there may be considerable delay in its application and this may have several implications. A number of well-conducted randomized control trials have examined the effectiveness of PAC in the treatment of critical illness and have failed to identify outcome improvements using PAC.Central Venous Oxygen Saturation (Scvo2) Central venous catheterization is a very common procedure in critically ill patients and is often done in other settings such as the emergency departments. Therefore measurement of Scvo 2 seems to be an attractive alternative to monitoring Svo 2 because it can be performed more easily, is less risky and less costly.Materials and Methods This study is a prospective observational study done on patients who underwent cardic surgery in Narayana Hrudayalaya Institute of Medical Science and were admitted in Adult Intensive Therapy unit post operatively. We enrolled patients of either sex who were > 18 years of age. The study was conducted only in the postoperative period. After receiving patient in the ICU, Continuous Cardiac output monitor was connected and three simultaneous blood samples were taken after confirming proper pulmonary artery pressure waves, central venous pressure waves and arterial pressure waves on the monitor, before radiological confirmation of the catheter position. Multiorificed CV catheter 7.5 F was inserted via (R) IJV and CCO monitoring catheter was introduced through 8.5F PA sheath in the (R) IJV. First 3-5 ml of blood drawn from each sample was discarded to prevent contamination with the flushing fluid. Three blood samples were collected simultaneously.
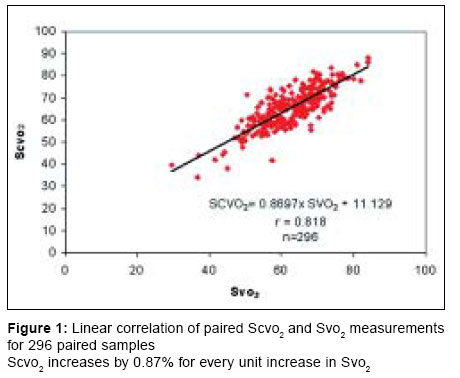
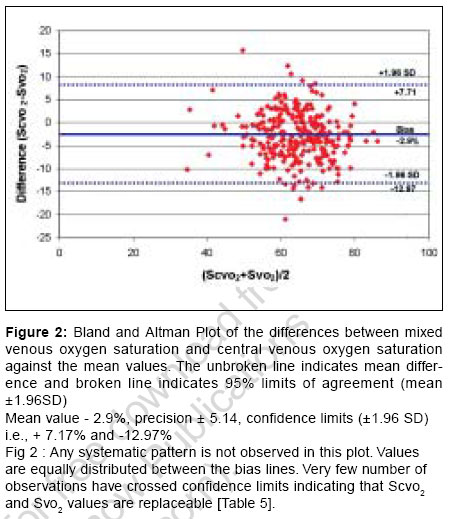
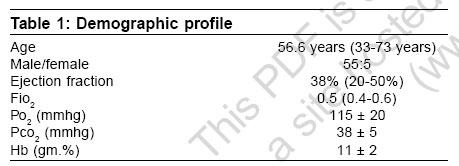
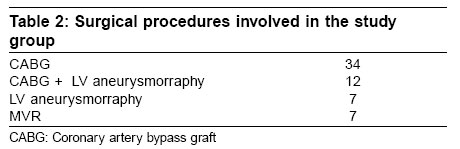
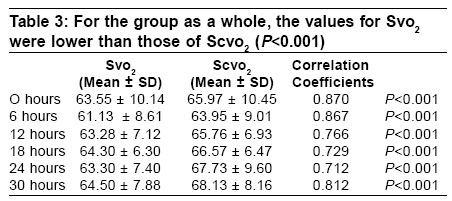
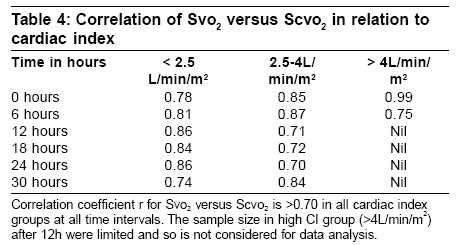
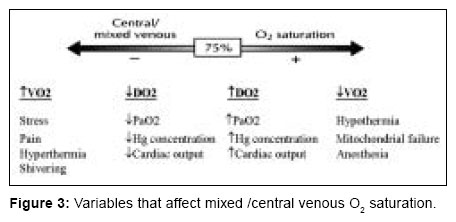
A standard volume of 1.5 ml blood was obtained from each site. Blood samples were analyzed for estimated oxygen saturation using a standard blood gas analyzer (Bayer Health Care). Hemoglobin, partial pressure of carbon dioxide were recorded from arterial sample. Oxygen saturation from pulmonary artery sample (Svo 2 ) and central venous sample (Scvo 2 ) were also recorded. Cardiac index was noted. The study was carried over for a period of 30hs in the post operative period and blood samples were taken as above mentioned at 6h interval. Exclusion criteria: Arterial samples which shows hemoglobin of < 9 gm.%, partial pressure of oxygen < 90 mmhg, partial pressure of carbon dioxide> 45 mmhg and valve incompetecies were excluded. Data analysis Paired student t test was used to compare Svo 2 and Scvo 2 and to determine whether the mean differences were significantly different from zero [Figure - 1]. Values were presented as mean ± SD unless otherwise stated. Pearson correlation coefficients between Svo 2 and Scvo 2 were determined and compared in different cardiac index groups. For all statistical procedures a "P" value < 0.05 was considered significant. Further more, 95% limits of CI were calculated as bias ± 1.96 SD. Paired samples were compared using Bland Altmann plotting and linear correlation [Figure - 2]. Results We enrolled 60 patients in the study of whom five were women [Table -1]. In our study, partial pressure of carbon dioxide and hemoglobin were kept relatively constant as the oxygen saturations tend to change depending on these values [Table -2]. The mean ejection fraction was 38%. All surgeries were done on cardio pulmonary bypass. All patients required mechanical ventilation and ionotropes for a minimum period of 24 hours [Table -3][Table -4]. Discussion The relationship between Scvo 2 and Svo 2 has been examined in numerous studies with controversial conclusions. But in this study, the investigations were conducted in a post-operative cardiac ICU setting, where the entire scenario of the study is different from other medical or trauma or surgical patients, as postoperative cardiac surgical patient behave differently. Hemodynamics of these patients in the immediate postoperative period will have an extremely labile course due to various causes during which time the investigations were conducted to compare the individual values as well as trends of central venous and mixed venous oxygen saturations in relation to cardiac index at that point of time [Figure - 3]. The correlation between Svo 2 and Scvo 2 in the postoperative period of cardiac surgical patients is not adequately analyzed in previous studies especially in Indian population. Hence in our study, the Svo 2 and Scvo 2 were analyzed along with continuous cardiac output monitoring in these patients. It is observed that Svo 2 values were always lower than that of Scvo 2 at various intervals and in different cardiac output values. Scheinman et al[1] compared Scvo 2 and Svo 2 in critically ill patients and found Scvo 2 levels were consistently higher than Svo 2 and changes in Scvo 2 in shock reflect changes in Svo 2 (r=0.90) even though correlation decreases with onset of shock. This is observed as the mixed venous samples were obtained from pulmonary artery after complete mixing of venous blood with different oxygen saturations coming from various regions of body including that of coronary sinus, whose oxygen saturations were very low as the myocardium extract maximum amount of oxygen from the blood, where as Scvo 2 obtained from superior venacava indicates only the balance between oxygen delivery and consumption in the cranial part of the body, mainly in the brain which has decreased oxygen saturation as a result of anesthesia. Now various factors including peripheral utilization of O 2 in conditions such as sepsis or low cardiac output can affect the values of Svo 2 which can alter the relationship between Scvo 2 and Svo 2 . In such conditions it becomes highly irrelevant to consider that Svo 2 values can be substituted by Scvo 2 . It has been demonstrated by many authors in various studies that under stressful conditions the Svo 2 values cannot be replaced by Scvo 2 values. Scheinman et al[1] (no CHF/shock; r=0.99; CHF, r=0.59; cardiogenic shock, r= 0.55) and Lee et al[2] (nonshock, r=0.88; shock, r=0.73) showed that there was poor correlation between Scvo 2 and Svo 2 when shock and heart failure were present in critically ill patients. In contrast to above findings many other authors have found that the correlation between Scvo 2 and Svo 2 were clinically acceptable even under various stressful conditions. JC Berridge et al[3] studied influence of cardiac output on the correlation between Svo 2 and Scvo 2 He found that correlation coefficient for the three groups studied as per cardiac output were statistically significant (Low CI = 0.95, mod CI = 0.88, high CI = 0.95; P < 0.001). Ladakis et al[4] compared central and mixed venous oxygen saturation in critically ill patients and concluded that Scvo 2 and Svo 2 are closely related and interchangeable for initial evaluation of critically ill patients. In our study we found a good correlation coefficient between Scvo 2 and Svo 2 throughout the study. We have also observed that correlation coefficient was good even in various cardiac index group (3 groups: low < 2.5 L/m/m 2, r>0.74; moderate 2.5 - 4 L/m/m 2sub , r>0.70; Good > 4 L/m/m 2sub , r>0.75) But the most important observations made in our study was that even when the values of Scvo 2 and Svo 2 differed, the trend in the changes of values of both paralleled under the similar cardiac index and was corresponding to each other. Dueck et al[5] compared the trends of Scvo 2 with Svo 2 during varying hemodynamic conditions. They found that correlation between changes of Scvo 2 and Svo 2 were clinically acceptable (r = < 0.75, P =0.001) to which our study finding corres ponds very well. Our study reveals a good correlation between the trends of Scvo 2 and Svo 2 , Which is in accordance with several previous studies (Reinhart et al ,[6] Scheinman et al ,[1] Reinhart et al ,[7] Dueck et al ,[5] Tahvanainen et al[8]) Scheinman et al[1] even though found a poor correlation between absolute values in patients with severe heart failure or shock, observed a better correlation between changes of Scvo 2 and Svo 2 . Reinhart et al[7] in an animal model demonstrated a close tracking of the O 2 saturations continuously measured in the PA and SVC across a wide range of hemodynamic conditions. In a recent study the same group could confirm these findings in critically ill patients.[8] Tahranainen et al[8] found a significant correlation between PA blood samples and both SVC and RA blood samples during subsequent changes of O 2 saturations in critically ill patients. In a similar way, Dueck et al[6] found excellent correlation between changes in the trends of O 2 saturation between Svo 2 and Scvo 2 during varying hemodynamic conditions. These data suggest that Scvo 2 is equivalent to Svo 2 in the course of clinical decisions as long as absolute values are not required, which is well supported by our study data. Conclusion The aim of our study is not to replace the values of Svo 2 by Scvo 2 , but rather study the applicability of the central venous oxygen saturations in the setting of various hemodynamic conditions and find out the possibility of its usage in certain conditions where PA catheter usage is limited or not advised. It is well known and proven that insertion as well as maintaining PA catheter carries its own disadvantages and contraindications because of which its usage has been restricted mostly to cardiac centers only. Our study intended to find out the clinical applicability of using Scvo 2 instead of Svo 2 in these settings which can be of great value in treating critically ill patients. After comparing and studying the data available from our study, we conclude that despite some differences between absolute values of Svo 2 and Scvo 2 in patients with varying haemodynamic situations, there was a reasonably good correlation between these values and trends. Hence, trend in Scvo 2 may be used as a surrogate variable for the trend in Svo 2 which can be valuable in treating critically ill patients. References
Copyright 2006 - Indian Journal of Critical Care Medicine The following images related to this document are available:Photo images[cm06032t5.jpg] [cm06032t1.jpg] [cm06032t4.jpg] [cm06032f1.jpg] [cm06032t3.jpg] [cm06032f3.jpg] [cm06032f2.jpg] [cm06032t2.jpg] |
| |||||||||