 |
| About Bioline | All Journals | Testimonials | Membership | News |
|
||||||
|
||||||
Indian Journal of Critical Care Medicine, Vol. 14, No. 2, April-June, 2010, pp. 57-64 Review Article Interpretation of arterial blood gas Pramod Sood, Gunchan Paul, Sandeep Puri 1 Critical Care Division, 1 Department of Medicine, Dayanand Medical College and Hospital, Ludhiana, Punjab, India Code Number: cm10010 DOI: 10.4103/0972-5229.68215 Abstract Disorders of acid-base balance can lead to severe complications in many disease states, and occasionally the abnormality may be so severe as to become a life-threatening risk factor. The process of analysis and monitoring of arterial blood gas (ABG) is an essential part of diagnosing and managing the oxygenation status and acid-base balance of the high-risk patients, as well as in the care of critically ill patients in the Intensive Care Unit. Since both areas manifest sudden and life-threatening changes in all the systems concerned, a thorough understanding of acid-base balance is mandatory for any physician, and the anesthesiologist is no exception. However, the understanding of ABGs and their interpretation can sometimes be very confusing and also an arduous task. Many methods do exist in literature to guide the interpretation of the ABGs. The discussion in this article does not include all those methods, such as analysis of base excess or Stewart's strong ion difference, but a logical and systematic approach is presented to enable us to make a much easier interpretation through them. The proper application of the concepts of acid-base balance will help the healthcare provider not only to follow the progress of a patient, but also to evaluate the effectiveness of care being provided.Keywords: Arterial blood gas interpretation, ABG analysis, rules for rapid ABG analysis, Anion gap, Approach to mixed disorders Introduction Arterial blood gas (ABG) analysis is an essential part of diagnosing and managing a patient′s oxygenation status and acid-base balance. The usefulness of this diagnostic tool is dependent on being able to correctly interpret the results. Disorders of acid-base balance can create complications in many disease states, and occasionally the abnormality may be so severe so as to become a life-threatening risk factor. A thorough understanding of acid-base balance is mandatory for any physician, and intensivist, and the anesthesiologist is no exception. The three widely used approaches to acid-base physiology are the HCO 3 - (in the context of pCO2 ), standard base excess (SBE), and strong ion difference (SID). It has been more than 20 years since the Stewart′s concept of SID was introduced, which is defined as the absolute difference between completely dissociated anions and cations. According to the principle of electrical neutrality, this difference is balanced by the weak acids and CO 2 . The SID is defined in terms of weak acids and CO 2 subsequently has been re-designated as effective SID (SID e ) which is identical to "buffer base." Similarly, Stewart′s original term for total weak acid concentration (A TOT ) is now defined as the dissociated (A - ) plus undissociated (AH) weak acid forms. This is familiarly known as anion gap (AG), when normal concentration is actually caused by A - . Thus all the three methods yield virtually identical results when they are used to quantify acid-base status of a given blood sample. [1] Why is it Necessary to Order an ABG Analysis? The utilization of an ABG analysis becomes necessary in view of the following advantages:
Potential Preanalytical Errors Preanalytical errors are caused at the following stages: During preparation prior to sampling Missing or wrong patient/sample identification;
During sampling/handling
During anticoagulation Modern blood gas syringes and capillary tubes are coated with various types of heparin to prevent coagulation in the sampler and inside the blood gas analyzer:
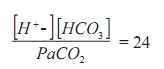
Other anticoagulants, e.g., citrate and EDTA are both slightly acidic which increase the risk of pH being falsely lowered. Liquid heparin The use of liquid heparin as the anticoagulant causes a dilution of the sample, i.e., dilutes the plasma, but not the contents of the blood cells. As a consequence, parameters such as pCO 2 and electrolytes are affected. Only 0.05 mL of heparin is required to anticoagulate 1 mL of blood. Dead space volume of a standard 5 mL syringe with 1 inch 22 gauge needle is 0.2 mL; filling the syringe dead space with heparin provides sufficient volume to anticoagulate a 4-mL blood sample. If smaller sample volumes are obtained or more liquid heparin is left in the syringe, then the dilution effect will be even greater. The dilution effect also depends on the hematocrit value. Plasma electrolytes decrease linearly with the dilution of the plasma along with pCO 2 , cGlucose, and ctHb values. pH and pO 2 values are relatively unaffected by dilution. paO 2 is only as little as 2% of the O 2 physically dissolved in the plasma, and so the oximetry parameters given in fractions (or %) will remain unaffected. [3] Syringes for blood gas analysis can have a wide range of heparin amounts. [4] The units are typically given as IU/mL (international units of heparin per milliliter) blood drawn into the syringe. In order to obtain a sufficient final concentration of heparin in the sample, blood volume recommended on the syringe must be drawn. Example: a syringe stated to contain 50 IU/mL when filled with 1.5 mL of blood means that the syringe contains a total 75 IU of dry heparin. If the user draws 2 mL of blood, then the resulting heparin concentration will be too low and the sample may coagulate. If the user draws only 1 mL, then the resulting heparin concentration will be higher than that aimed for, which may lead to producing falsely low electrolyte results. Heparin binds to positive ions such as Ca 2+ , K + , and Na + . Electrolytes bound to heparin cannot be measured by ion-selective electrodes, and the final effect will be measurement offalsely low values. The binding effect and the resulting inaccuracy of results are especially significant for corrected Ca 2+ . The use of electrolyte-balanced heparin significantly reduces the binding effect and the resulting inaccuracy. [5] The following steps for rapid interpretation of ABG are recommended: Check for the consistency of ABG While making an interpretation of an ABG always check for the consistency of the report by the modified Henderson equation.
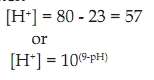
The hydrogen ion is calculated by subtracting the two digits after the decimal point of pH from 80, e.g., if the pH is 7.23 then
The hydrogen can be calculated from [Table - 1]. Obtain a relevant clinical history While making an interpretation of anABG,never comment on the ABG without obtaining a relevant clinical history of the patient, which gives a clue to the etiology of the given acid-base disorder. For example, a patient with a history of hypotension, renal failure, uncontrolled diabetic status, of treatment with drugs such as metformin is likely to have metabolic acidosis; a patient, with a history of diuretic use, bicarbonate administration, high-nasogastric aspirate, and vomiting, is likely to have metabolic alkalosis. Respiratory acidosis would occur in COPD, muscular weakness, postoperative cases, and opioid overdose, and respiratory alkalosis is likely to occur in sepsis, hepatic coma, and pregnancy. Look at the oxygenation status of the patient The oxygenation status of the patient is judged by the paO 2 ; however, never comment on the oxygenation status without knowing the corresponding FiO 2 . Calculate the expected paO 2 (generally five times the FiO 2 ). [6] Based on the expected paO 2 classify as mild, moderate, and severe hypoxia. Ventilatory status Look at paCO 2 . Acid-base status Identify the primary disorder by looking at the pH pH > 7.40-Alkalemia: < 7.40-Acidemia Then look at paCO 2 which is a respiratory acid, whether it is increased, i.e., >40 (acidosis) or decreased <40 (alkalosis) and if this explains the change of pH, then it is respiratory disorder; otherwise, see the trend of change of HCO 3 - (whether increased in alkalosis or decreased in acidosis)-if it explains the change of pH, then it is a metabolic disorder. In a normal ABG
If the trend of change in paCO 2 and HCO 3 - is the same, check the percent difference. The one, with greater % difference, between the two is the one that is the dominant disorder. e.g.: pH = 7.25 HCO 3 - =16 paCO 2 =60 Here, the pH is acidotic and both paCO 2 and HCO 3 - explain its acidosis: so look at the % difference HCO 3 - % difference = (24 - 16)/24 = 0.33 paCO2 % difference = (60 - 40)/40 = 0.5 Therefore, respiratory acidosis as the dominant disorder. Respiratory disorders After the primary disorder is established as respiratory, then the following points will help us to approach further with regard to the respiratory disorder). [8]
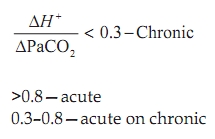
The above ratio of rate of change in H + to change in paCO 2 helps in guiding us to conclude whether the respiratory disorder is acute, chronic, or acute on chronic. As we have seen, the hydrogen can be calculated from [Table - 1] and the change in H + is calculated by subtracting the normal H + from the calculated H + ion. [9]
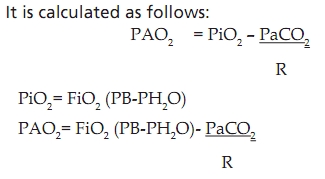
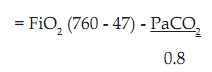
Alveolar Arterial Oxygen Gradient
where PAO 2 , alveolar partial pressure of oxygen; PiO 2 , partial pressure of inspired oxygen; FiO 2 , fraction of inspired oxygen; PB, barometric pressure (760 mmHg at sea level); PH 2 O, water vapor pressure (47 mm Hg), PaCO 2 , partial pressure of carbon dioxide in blood; R, respiratory quotient assumed to be 0.8.
Hypoxemic respiratory failure can be associated with normal (10-15 mmHg) or increasedalveolar arterial oxygen gradient. [Figure - 2] shows the alogrithim for approach in a patient with hypoxemic respiratory failure. If this gradient is <20, then it indicates an extrapulmonary cause of respiratory failure. Differentials of extrapulmonary causes of respiratory failure:
Rules of compensation
Respiratory acidosis Acute: [HCO 3 - ] increase by 1 mEq/L for every 10 mmHg increase in paCO 2 above 40. Chronic: [HCO 3 - ] increase by 3.5 mEq/L for every 10 mmHg increase in paCO 2 above 40. Respiratory alkalosis Acute: [HCO 3 - ] decrease by 2 mEq/L for every 10 mmHg decrease in paCO 2 below 40. Chronic: [HCO 3 - ] decrease by 5 mEq/L for every 10 mmHg decrease in paCO 2 below 40. Metabolic disorders In patients with metabolic acidosis, an excess of acid or loss of base is present. This causes the HCO 3 - :H 2 CO 3 ratio and pH to fall while no change occurs in pCO 2 -uncompensated metabolic acidosis. As a result of compensatory mechanisms, the lungs in the form of CO 2 excrete H 2 CO 3 and the kidneys retain HCO 3 - . pCO 2 falls and HCO 3 - : H 2 CO 3 ratio and pH rise toward normal even though concentrations of HCO 3 - and H 2 CO 3 are less than normal. This is called compensated metabolic acidosis and the expected paCO 2 is calculated as paCO 2 = [1.5 Χ HCO 3 + 8] ± 2. Anion gap For more than 40 years, the AG theory has been used by clinicians to exploit the concept of electroneutrality and has evolved as a major tool for evaluating the acid-base disorder. Anion gap is the difference between the charges of plasma anions and cations, calculated from the difference between the routinely measured concentration of the serum cations (Na + and K + ) and anions (Cl - and HCO 3 - ). Because electroneutrality must be maintained, the difference reflects the unmeasured ions. Normally, this difference or the gap is filled by the weak acids (A - ) principally albumin, and to a lesser extent phosphates, sulfates, and lactates. When the AG is greater than that produced by the albumin and phosphate, other anions (e.g., lactates and ketones) must be present in higher than normal concentration. Anion gap = (Na + + K + ) - [Cl - + HCO3 - ] Because of its low and narrow extracellular concentration, K + is often omitted from the calculation The normal value ranges from 12 ± 4 when K + is considered, and 8 ± 4 when K + is omitted. [Figure - 3] shows the alogrithm for the approach to patients with normal AG acidosis. The primary problem with AG is its reliance on the use of the normal range produced by the albumin and to a lesser extent phosphate, the level of which may be grossly abnormal in critically ill patients. Because these anions are not strong anions, their charges will be altered by changes in pH. [10],[11] Serum protein and phosphate Normal AG = 2{albumin(gm/L)} + 0.5 {phosphate (mg/dL)} Acid-base status In Acidemic state - Anion gap decreases by 1-3 In Alkalemic state - Anion gap increases by 2-5 Major clinical uses of the anion gap
[Table - 3] elaborates the species of the unaccounted anions along with their sources of origin and diagnostic adjunts in case of high AG metabolic acidosis. In the patients with metabolic alkalosis, there is an excess of base or a loss of acid which causes the HCO 3 - :H 2 CO 3 ratio and pH to rise, but with no change occurring in pCO 2 , which is called uncompensated metabolic alkalosis. However, the kidney has a large capacity to excrete excess bicarbonate and so, for sustaining the metabolic alkalosis, the elevated HCO 3 - concentration must be maintained through an abnormal renal retention of HCO 3 - . Compensatory respiratory acidosis may be so marked that pCO 2 may rise higher than 55 mmHg. Expected paCO 2 is calculated as paCO 2 = [0.7 Χ HCO 3 - + 21] ± 2 or 40 + [0.7 ∆HCO 3 ]. This is called compensated metabolic alkalosis. Most of the patients with metabolic alkalosis can be treated with chloride ions in the form of NaCl (saline responsive) rather than KCl (which is preferable). When NaCl is given, Cl - ions are supplied, and so the blood volume increases and the secretion of aldosterone in excess decreases. Thus, excessive urinary loss of K + and excessive reabsorption of HCO 3 - stops. When metabolic alkalosis is due to the effects of excessive aldosterone or other mineralocorticoids, the patient does not respond to NaCl (saline resistant) and requires KCl. Based on the urinary chloride, metabolic alkalosis is divided into: Chloride responsive or extracellular volume depletion (urinary chloride < 20)
Aproach to mixed disorder Mixed metabolic disturbances (e.g., high AG from diabetic ketoacidosis plus normal AG from diarrhea) can be identified using the relationship between AG and HCO 3 - , which is called the gap-gap ratio. It is the ratio of change in anion gap (∆AG) to change in HCO 3 - (∆HCO3 - ). When hydrogen ions accumulate in blood, the decrease in serum HCO3 - is equivalent to the increase in AG and the increase in AG excess/HCO3 - deficit ratio is unity, i.e., pure increase in AG metabolic acidosis. When a normal AG acidosis is present, the ratio approaches zero. When a mixed acidosis is present (high AG + normal AG), the gap-gap ratio indicates the relative contribution of each type to the acidosis. If it is <1, then it suggests that there is a normal AG metabolic acidosis associated with it and if >2 it suggests that there is associated metabolic acidosis. Rules for rapid clinical interpretation of ABG When required to make a proper approach towards the evaluation of blood gas and acid-base disturbances in the body, the following scheme is suggested: 1. Look at pH - < 7.40 - Acidosis; > 7.40 - Alkalosis 2. If pH indicates acidosis, then look at paCO2 and HCO3 - 3. If paCO2 is ↑, then it is primary respiratory acidosis (a) To determine whether it is acute or chronic ∆H + /∆paCO2 <0.3-chronic >0.8-acute 0.3-0.8-acute on chronic (b) Calculate compensation by the respective methods Acute : [HCO3 - ] ↑ by 1 mEq/L for every 10 mmHg ↑ in paCO2 above 40. Chronic : [HCO3 - ] ↑ by 3.5 mEq/L for every 10 mmHg ↑ in paCO2 above 4 4. If paCO2 ↓ and HCO3 - is also ↓→ primary metabolic acidosis Calculate expected paCO2 as follows: paCO2 = [1.5 Χ HCO3 + 8] ± 2 metabolic acidosis only paCO2 < expected paCO2 → concomitant respiratory alkalosis. paCO2 > expected paCO2 → concomitant respiratory acidosis 5. If HCO3 - is ↓, then AG should be examined. 6. If AG is unchanged → then it is hyperchloremic metabolic acidosis. 7. If AG is ↑ → then it is wide AG acidosis. 8. Check gap-gap ratio ∆AG/∆ HCO3 - = 1, pure increased AG metabolic acidosis <1 normal anion gap metabolic acidosis >2 associated metabolic acidosis. 9. If pH indicates alkalosis, then look at HCO3 - and paCO2 . 10. If paCO2 is ↓ → then it is primary respiratory alkalosis. (a) Whether it is acute or chronic (with the same formula as above) (b) Calculate compensation by the respective methods: Acute: [HCO3 - ]↓ by 2 mEq/L for every 10 mmHg ↓ in paCO2 below 40. Chronic: [HCO3 - ] ↓ by 5 mEq/L for every 10mmHg ↓ in paCO2 below 40. 11. If paCO2 ↑ and HCO3 - also ↑ → then it is primary metabolic alkalosis. Calculate the expected paCO2 paCO2 = [0.7 Χ HCO3 - + 21] ± 2 Or 40 + [0.7 ∆HCO3 ] → metabolic alkalosis only paCO2 < expected paCO2 → concomitant respiratory alkalosis. paCO2 > expected paCO2 → concomitant respiratory acidosis 12. Check urinary chloride if urinary chloride < 20 → chloride responsive or ECV depletion if urinary chloride > 20→ chloride resistant 13. If pH is normal ABG may be normal or mixed disorder (a) ↑paCO2 and ↓HCO3 - → respiratory and metabolic acidosis (b) ↓paCO2 and↑ HCO3 - → respiratory and metabolic alkalosis. Calculate % difference (∆HCO3 - /HCO3 - and ∆paCO2 /paCO2 ) to see which is dominant disorder. References
Copyright 2010 - Indian Journal of Critical Care Medicine The following images related to this document are available:Photo images[cm10010f3.jpg] [cm10010f1.jpg] [cm10010t3.jpg] [cm10010t1.jpg] [cm10010f2.jpg] [cm10010t2.jpg] |
| |||||||||

![[Figure - 1]](/showimage?cm/photo/cm10010f1.jpg)
![[Table - 1]](/showimage?cm/photo/cm10010t1.jpg)
![[Figure - 2]](/showimage?cm/photo/cm10010f2.jpg)
![[Figure - 3]](/showimage?cm/photo/cm10010f3.jpg)
![[Table - 2]](/showimage?cm/photo/cm10010t2.jpg)
![[Table - 3]](/showimage?cm/photo/cm10010t3.jpg)