 |
| About Bioline | All Journals | Testimonials | Membership | News |
|
||||||
|
||||||
Indian Journal of Cancer, Vol. 42, No. 3, July-September, 2005, pp. 138-144 Original Article Validation of quality of life questionnaire for patients with cancer - Indian scenario Vidhubala E, Latha, Kannan RaviR, Mani CS, Karthikesh K, Muthuvel R, Surendran V, Premkumari Rohini Departments of Psycho-oncology, Cancer Institute (WIA), Adyar, Chennai Code Number: cn05024 Abstract BACKGROUND: Quality of Life (QOL) is an important health outcome measure in oncology. Given the underlying pressure of individual geo-political entities, a universal solution may not be applicable and hence there is a need to develop a regional tool and standardize the same to address the linguistic and socio-cultural factors. Keywords: Cancer, Quality of life, Reliability, Validity Introduction Quality of Life is vital health outcome measure that is relevant to the care of cancer patients. There has been a shift in the management of the cancer patient from quantity to quality of survival in international research studies. The Quality of Life is a general term integrating several aspects of life such as physical, psychological, social, economical, spiritual, cognitional and sexual dimensions. A disturbance in any one aspect will in turn affect the other domains and this influences the overall QOL.[8] One of the major areas of concern in Psycho-oncology is to understand the Quality of Life and to find ways of enhancing it. In Clinical Oncology, increasing importance is being given to the incorporation of Quality of Life as an outcome, in addition to other clinical endpoints. The key objective measurement for QOL is the development of a ′quality of life′ questionnaire. There are numerous studies on QOL tools, general and site specific.[1],[2],[3],[4],[6],[7] None of these tools however were developed to suit the Indian population except the QOL index,[5] which is suitable only for the normal population as described by the author. Given the underlying pressure of individual geo-political entities, a universal solution may not be applicable and hence there is a need to develop a regional tool and standardize the same to address the linguistic and socio-cultural factors. Keeping this in mind, the present study is aimed at developing a standardized QOL questionnaire to suit the Indian cancer population, covering all domains of life. Methodology The samples were collected from Cancer Institute (WIA) , 0 Chennai, which is a Regional Cancer Center for Cancer Research and Treatment in the Ministry of Health and Family Welfare of the Government of India. It is an autonomous non-profit organization. Over 15,000 new patients and over 1,10,000 follow-up patients are seen annually from all over the country and also from South Asia and the Middle East. The period of the study extended from January 2001 to January 2002. Irrespective of the stage, site, age, education and treatment, all cancer patients were enrolled for the study and totally 400 samples were collected for standardizing the QOL tool. Samples were represented by more men (58.2%) than women (41.8%) and the age range was 17 - 90 years. Item pooling and validation of QOL scale
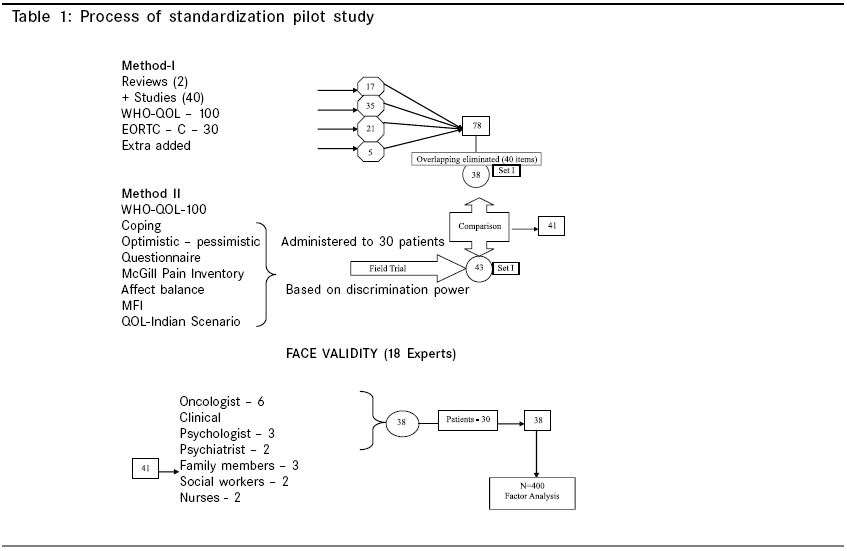
Method I Method II The 38 items chosen through method I was verified with 43 items, chosen from method II. Both set of measures depicted similar issues except 3 items. Adding these items, finally 41 items were retained for further validation. Face Validity Scaling technique 1 2 3 4 Very much Moderate A little Not at all A few items were scored in reverse in order to make the questionnaire unidirectional and to yield a global QOL score. For example, ′Are you satisfied with your working capacity?′If the answer is very much, it will be scored inreverse i.e. 4 as 1 and 1 as 4 to get positive QOL index. The direct and reverse scoring items are given below. Direct Scoring: 1, 2, 3, 5, 6, 7, 8, 11, 14, 17, 18, 16, 19, 21, 26
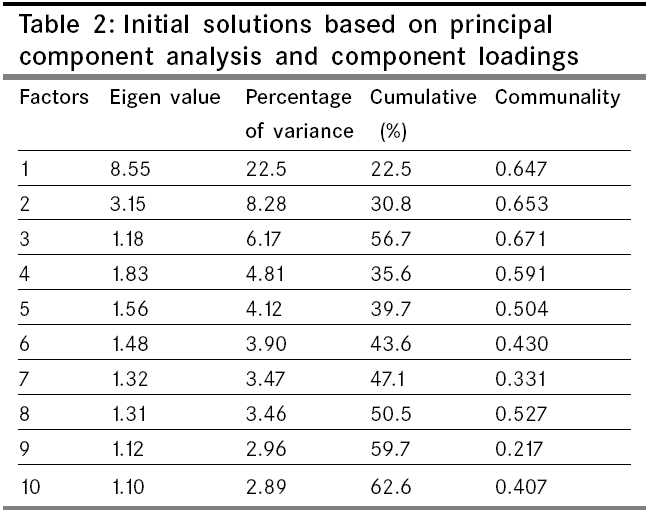
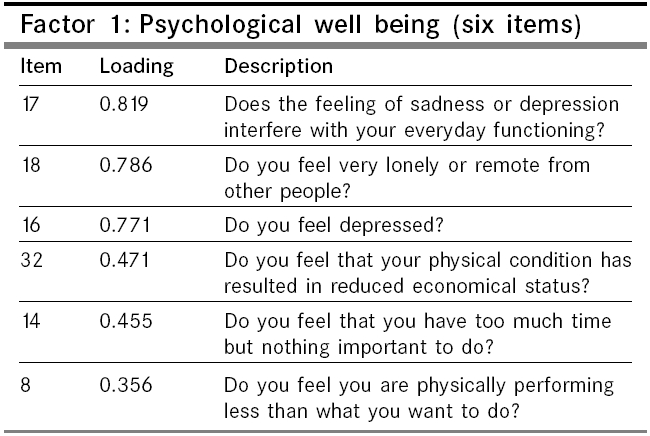
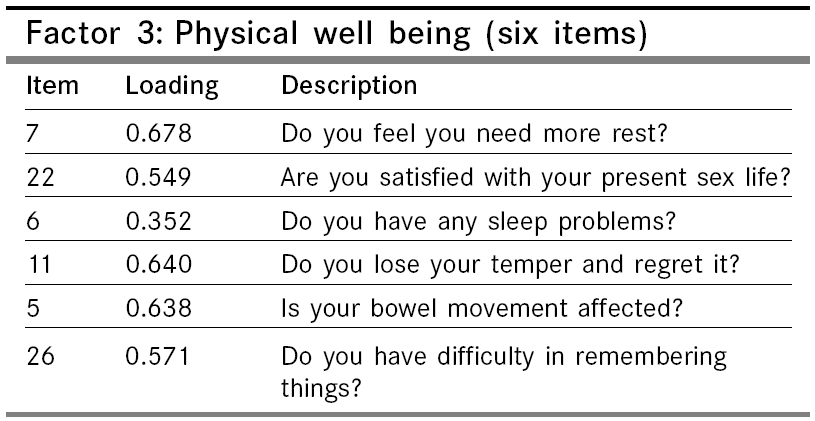
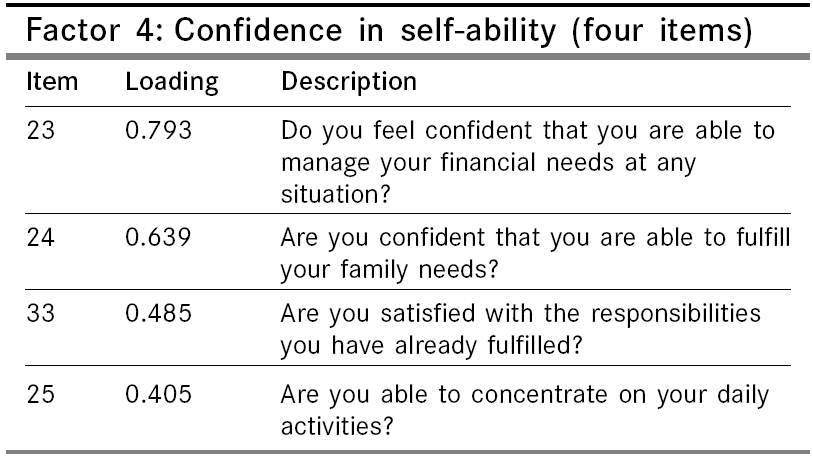
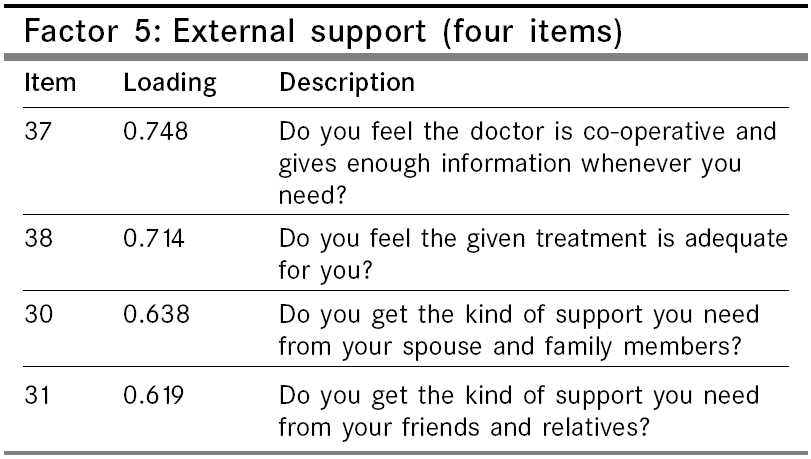
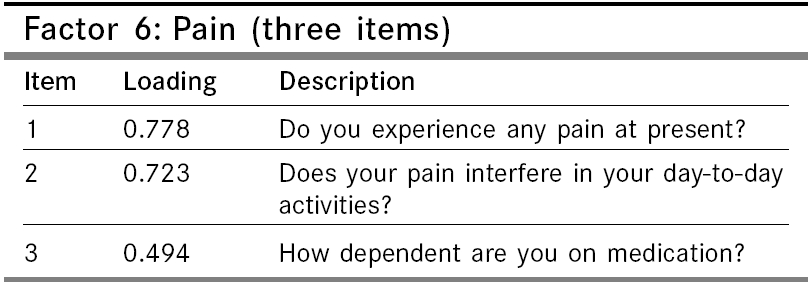
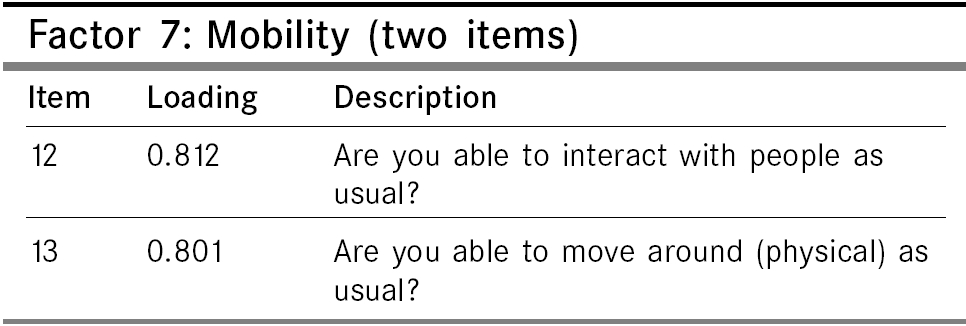
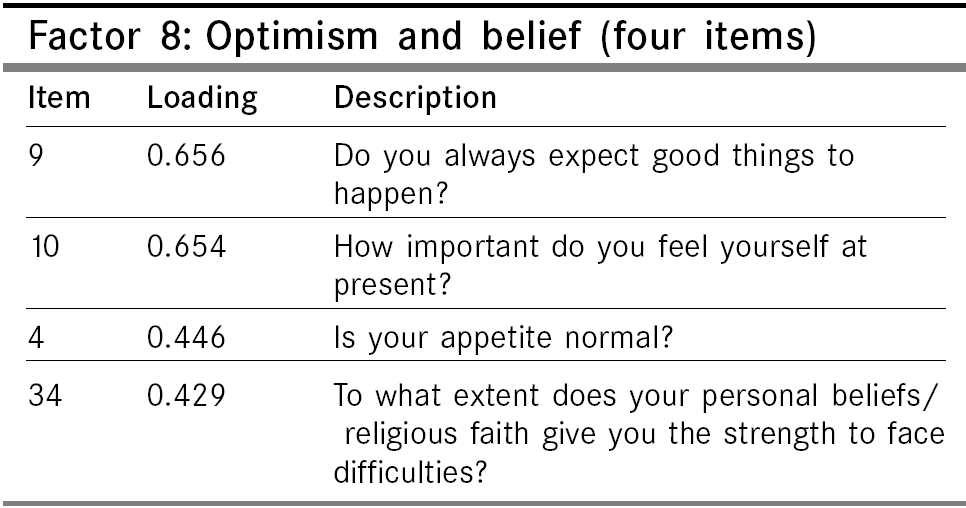
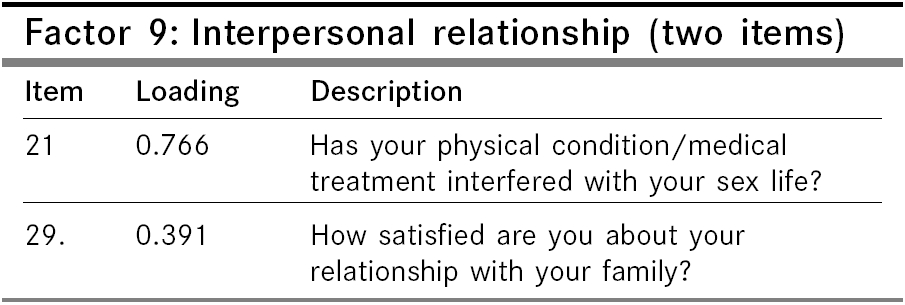
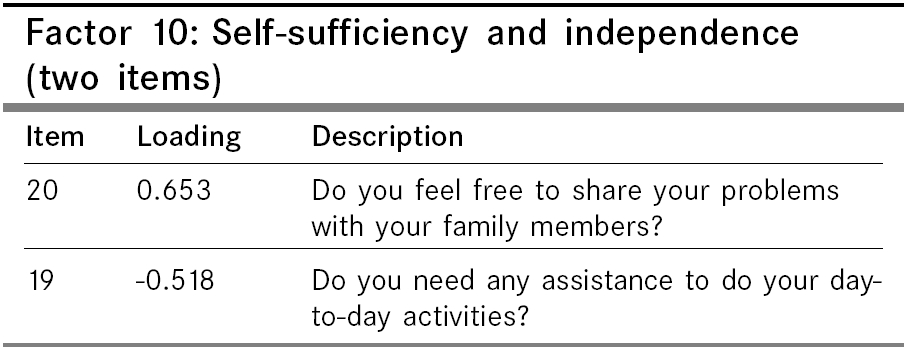
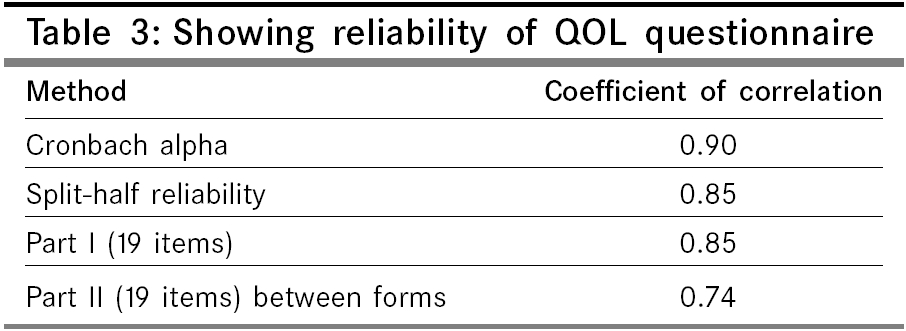
and 32. Statistical analysis Results As the primary objective of this study was to identify the nature of the factors underlying the set of measures in the questionnaire, the data was subjected to factor analysis. This analysis was typically used to construct a scale and simultaneously identify the concepts. The KMO value of 0.83 and the high significant level (p value = 0.00) in Bartlett′s Test of Sphericity showed that the sample was adequate for factor analysis. Ten factors emerged with Eigen values ranging from 8.55 to 1.10. Ten factors accounted for 62.6 % of variance. The first factor contributed maximally 22% of variance. The remaining 9 factors contributed totally 40% of the variance on QOL. The "% of Variance" gives the percent of variance accounted for by each specific factor or component, relative to the total variance in all the variables. The Eigen value is the ratio of the between groups sum of squares to the within groups sum of squares. The largest Eigen value corresponds to the eigenvector in the direction of the maximum spread of the groups means. The second largest eigen value corresponds to the eigen vector in the direction that has the next largest spread, and so on. Eigen value shows the purity of a variance contributed by a factor or component. Eigen value of 1 is usually acceptable, hence only those factors were included. The communality factor indicated a significant loading and common factor variance and unique variance in the structure. Even though some solutions had minimal loading of items, they were included to explain the underlying constructs. The following table represents the Eigen values and contribution to total variance. The communality (h2sub) indicates the common variance attributed to each factor, which ranges from 0.21 to 0.65. Theoretically, many aspects of a person′s life influences Quality of Life, and therefore the researcher used as many factors, which significantly contributed to variance. Items within each factor were analyzed and were named based on the item description. There were totally 38 items within 10 factors. These factors and its loadings are explained in the following tables. The first factor with an Eigen value of 8.55 emerged significant with six items. This factor contributed a variance of 22.5% to the total variance. The factor loadings ranged from 0.82 to 0.36. The items in this factor underlined the significance of psychological well being. Item 17 had the highest loading of 0.82. Sadness or depression interfering with everyday functioning, feeling lonely or remote, feeling depressed, the physical condition reducing economic status, and feeling of low performance compared to one′s ability are described in the first factor. All the items mentioned, referred to psychological feelings. The common variance is high (0.64) showing the underlying communality. Hence, this factor was named as "Psychological Well-being". The second factor has five items with significant loading, which ranged from 0.68 to 0.46. This factor contributed a variance of 8.28% to the total variance with an Eigen value of 3.15. The items described the individual′s feelings of adequacy towards working capacity, attending functions, body image, health status and overall well-being. The communality of 0.65 indicates that the items share a common variance. The higher score on these items indicates satisfaction, sense of worth, ability and confidence and thus this factor was named as "Self-Adequacy". The Eigen value of the third factor was 1.18. The variance contributed by this factor was 6.17%. The six items in this factor describes sleep problems, rest, satisfaction with sex life, losing temper and regretting, problems in bowel movements and dependency on medication. The loading ranged from 0.67 to 0.35. The communality was 0.67 showing high common variance. The responses to these items in terms of higher scores indicate freedom from the above-mentioned symptoms and also physical comfort and satisfaction. Hence, the factor was named as "Physical Well-being". The fourth factor has four items contributing a variance of 4.81% to the total variance with an Eigen value of 1.83. The items describe one′s efficacy in managing financial needs, fulfilling family needs, satisfaction in fulfilling responsibilities and ability to concentrate on daily activities. These items refer to the satisfaction and confidence that a person has in fulfilling his/her role as a family member, social and work roles, and effectively meeting the demands placed on them. The communality of 0.59 indicates the items share a common variance. Thus, this factor was termed as "Confidence in self-ability". The fifth factor has four items with an Eigen value of 1.56 and contributed a variance of 4.12%. These items describe the support of doctor, informational support, treatment adequacy, support of family, spouse, friends and relatives. All the items are positively stated. Hence, higher scores indicate greater support received and also satisfaction with the support. The communality was 0.50 indicating 50% of the common variance within items. Since, it measures the satisfaction with various supports, it was named "External Support". The sixth factor has three items with significant positive loading. This factor contributes a variance of 3.90% to the total variance with an Eigen value of 1.48. The item 1 and 2 describes the experience of pain and its interference in day-to-day activities and item 3 describes dependency on medication. This dimension was more related to the clinical condition and it is a significant factor contributing to the overall differences in QOL. The communality was 0.43, which indicates the common variance within items to be moderate. Hence, this factor was named "Pain". The seventh factor consists of item 12 and 13 with a very high loading of 0.81 and 0.80 respectively. This factor has an Eigen value of 1.32 and contributes a variance of 3.47% to the total. The items describe the patient′s ability to interact and move around as usual. This factor was named "Mobility". Mobility means functional ability that includes the freedom of movement and ability to perform social roles and also the capacity to execute these functions. The lowest communality value of 0.33 indicates that the factor represents the social or physical ′mobility′and they may not relate to each other. The four items in eighth factor contributes a variance of 3.46% with an Eigen value of 1.31. The items on this factor describe a positive outlook characterized by always expecting good things to happen, self-importance and personal beliefs and/or religious faith. This factor almost borders on the spiritual dimension of health and QOL. The communality was 0.52 indicating the items share a common variance. Based on these positive loadings, this factor was named as "Optimism and Belief ". Item No.4 seems to be a physical aspect, but here it denotes optimism about health for this population. Hence it was loaded in this domain and retained as it is. The ninth factor contributes a variance of 2.96% with an Eigen value of 1.12. The two items in this factor describe the interference of medical treatment in sexual life and in the relationship with family members. The items 21 and 29 were loaded at 0.76 and 0.39 respectively. The communality of 0.21 indicates both the items share few unique variances. However, the satisfaction in relationship and the disease condition differentially influence the need for intimacy (Love) and the need for belongingness (Affection). Hence, this factor was named as "Interpersonal relationship". The tenth factor contributes a variance of 2.89% with an Eigen value of 1.10. This factor has two items. The item 20 has a positive loading of 0.65 and item 19 has a negative loading of - 0.51. The common factor variance of 0.40 indicates that the items within this component share minimal unique characteristics. These items show if the patient freely shares his or her problems with his or her family or not and also whether he or she require assistance in daily activities. This factor was named as "Self-sufficiency and Independence". Thus, the QOL scale had 38 items with 10 factors namely, Psychological well-being, Self-adequacy, Physical well-being, Confidence in self-ability, External support, Pain, Mobility, Optimism and belief, Interpersonal relationship and Self-sufficiency and Independence. These factors have every aspect of an individual′s life relevant to the cancer envisaged. The face validity and factorial validity were thus established. Reliability Interpretation of QOL scale The skewness value was found to be -.410 and hence it was evident that the sample size was normally distributed. Therefore, the percentiles were taken into consideration for establishing the cut off points for the Quality of Life Scale. Based on the percentiles, the norms for the scale were established
as follows. Conclusion The validity was established through face/content validity and construct, also called factorial validity. Internal consistency reliability of the module was satisfactory (Chronbach′s a = 0.90). This is the self-administered questionnaire where the importance has been given to the patient′s satisfaction in different aspects of life. It can be concluded from the present study that QOL is a multidimensional construct with many factors within it. Quality of Life is a multidimensional concept and the dimensions that emerged are Psychological well-being, Self-adequacy, Physical well-being, Confidence in self-ability, External support, Pain, Mobility, Optimism and belief, Interpersonal relationship and Self-sufficiency and Independence. This tool was less time consuming (12 - 15 minutes) and hence it was feasible to administer at clinical settings.Limitation The study was confined to a single Institution. Further standardization of the Quality of Life tool across different cancer populations and cultures are needed. Multi - center trial will help in developing a comprehensive, sensitive tool for QOL.Acknowledgement Mr. F.U. John Paul for assistance in writing and editing the manuscript; Mr. Krishnamurthy for helping in data extraction and Ms. P. Saritha for her secretarial assistance. References
Copyright 2005 - Indian Journal of Cancer The following images related to this document are available:Photo images[cn05024t3.jpg] [cn05024f5.jpg] [cn05024f1.jpg] [cn05024f10.jpg] [cn05024t1.jpg] [cn05024f2.jpg] [cn05024f3.jpg] [cn05024f4.jpg] [cn05024f7.jpg] [cn05024f8.jpg] [cn05024f6.jpg] [cn05024f9.jpg] [cn05024t2.jpg] |
| |||||||||