 |
| About Bioline | All Journals | Testimonials | Membership | News |
|
||||||
|
||||||
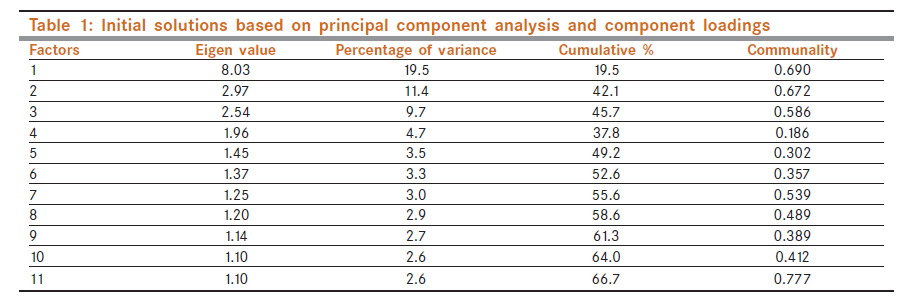
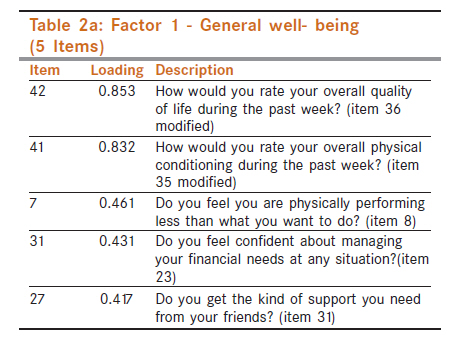
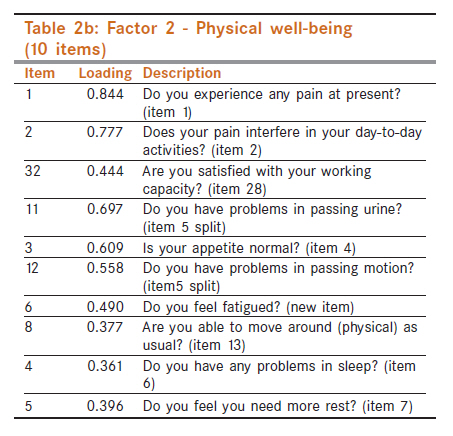
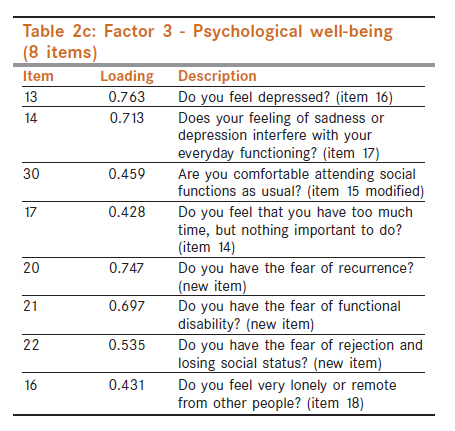
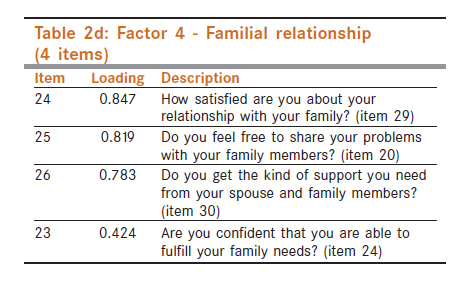
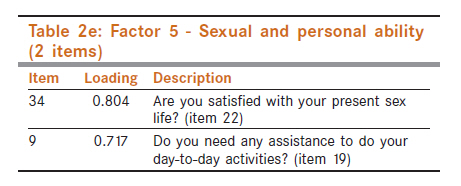
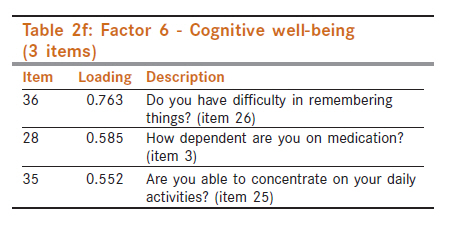
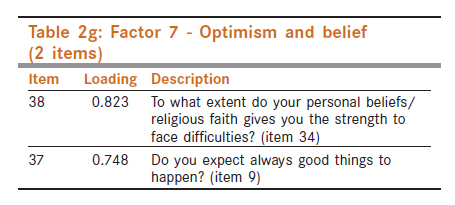
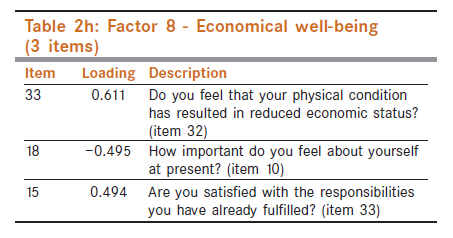
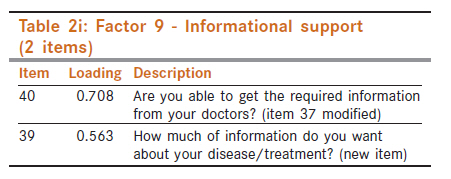
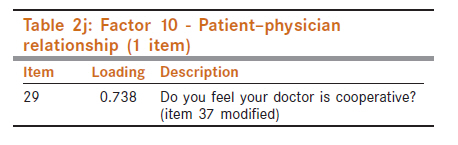
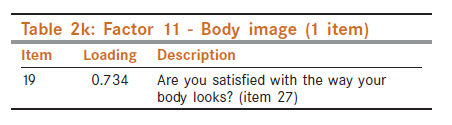
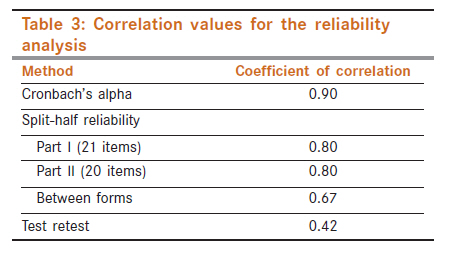
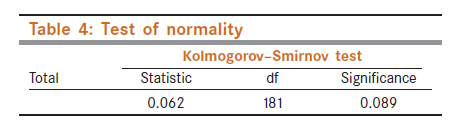
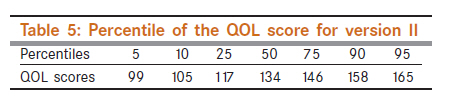
Indian Journal of Cancer, Vol. 48, No. 4, October-December, 2011, pp. 500-506 Supportive Care - Original Article Validation of Cancer Institute Quality of Life Questionnaire Version II for cancer patients in India E Vidhubala1, Latha2, R Ravikannan3, CS Mani4, R Muthuvel5, V Surendren1, FU John Paul6 1 Department of Psycho-oncology, Cancer Institute, Chennai, India Code Number: cn11133 PMID: 22293268 Abstract Background: The Quality of Life (QOL) questionnaire version I consisted of 38 items that were validated using 392 patients. The experiences gained through the interaction with the patients during the administration of the questionnaire provided a lot of inputs for the improvization of the tool. Keywords: Cancer, India, quality of life questionnaire, reliability, validity Introduction The primary purpose of any cancer treatment is to improve the quality of patients′ lives and the Quality of Life (QOL) instruments help health care professionals to better understand the impact of treatments on various aspects of a patient′s life. Among the available instruments, [1],[2],[3],[4] most of them were Western based. Given the underlying pressure of individual geopolitical entities, a universal solution may not be applicable [5],[6],[7] and hence there is a need to develop a regional QOL tool to assess the cancer patients and standardization of the same to address the sociocultural factors. In lieu of this, Cancer Institute Quality of Life Questionnaire for cancer patients was constructed and validated. [8] Though the reliability and validity of the tool was found to be satisfactory, the experiences gained through the interaction with the patients during the administration of the questionnaire provided a lot of inputs for the improvization of the tool. Studies have also suggested that future work on instrument development focuses on refining currently available measures. [9],[10] Therefore, the present study is aimed at certain modifications in QOL questionnaire version I based on the experience gained in interviewing and administering the questionnaire to 392 cancer patients. Materials and Methods QOL questionnaire version I consisted of 38 items and the tool was validated using 392 patients. During the administration of the tool, the items which were clarified by the patients were noted down. In addition, the patients were asked to write down the issues they had other than those covered in the questionnaire. The items clarified by more than 50% of the patients were considered for modification. Finally, of the 38 items in version I, 9 items required modifications. The item numbers 5, 11, 12, 15, 21, 35, 36, 37, and 38 were modified and all the other 29 items remained unchanged. The items underwent splitting, modifying, deleting, and adding of new items as follows. Since many did not understand the word "bowel movement" in item number 5, it was simplified and divided into two items in version II as follows: "Do you have problems in passing urine?" (item 11) "Do you have problems in passing motion?" (item 12). Similarly, item 37 was found to be a complex question ("Do you feel the doctor is co-operative and gives enough information whenever you need?"), and it was felt that not all the patients are expecting for detailed information except the doctors cooperation. Therefore, the item was broken down into three asking each issue separately in version II, and were as follows: "Do you feel your doctor is cooperative?" (item 29) "How much of information do you want about your disease /treatment?" (item 39) "Are you able to get the required information from your doctors?" (item 40). Item 15 of version I - "Are you comfortable attending functions as usual?" - was modified as follows: "Are you comfortable attending social functions as usual?" (item 30). Items 35 and 36 of version I - "Are you satisfied with your present health status? - and - "Are you satisfied with your overall quality of life?" - were modified and presented in a 10-point scale in version II. To elicit a more precise and accurate response, a 10-point scale was used for these two items: "How would you rate your overall physical condition during the past week?" (item 41) "How would you rate your overall quality of life during the past week?" (item 42). Items 11, 12, 21, and 38 of version I were deleted for the following reasons. Many patients did not answer item 11, which measured patient′s loss of temper and regretting about it. Item 12 which measured one′s ability to interact with people was identified with item 15, "Are you comfortable attending social functions as usual?" This measured the social life of the cancer patient, which includes one′s interaction with people. Hence, item 12 was removed. Item 21 was found to be repetitive as another item (22) measured satisfaction in sex life. The patients responded in the same way to the item that measured interference of physical condition or medical treatment in sex life and another item measuring the satisfaction with the sex life. Therefore, item 21 was removed. Item 38 was also removed which measured the adequacy of treatment. Many patients came out with the reply that "only doctors know" as they decide the type and duration of treatment. Besides the modifications of version I, there were some new items, which were added to version II. While interviewing the patients, it was found that many patients were troubled by the fear of recurrence. Therefore, in version II, an item assessing the fear of recurrence was included. In the same way, the fear of functional disability and the fear of rejection and losing social status were also found to be a psychological trauma for the cancer patients. Therefore, the new version included the following five new items: "Do you feel fatigued?" (item 6) "Do you have nausea or vomiting?" (item 10) "Do you have the fear of recurrence?" (item 20) "Do you have the fear of functional disability?" (item 21) "Do have the fear of rejection and losing social status?" (item 22). With the above modifications, version II included a total of 42 items and was administered to 183 cancer patients for further standardization. Irrespective of the demographic and biomedical details all the cancer patients were included. Statistics used Statistical analysis was performed using the Statistical Package for Social Sciences (SPSS), version 10.0. To ascertain the sampling adequacy, Kaiser-Meyer-Olkin measure and Bartlett′s test of sphericity were performed. As the primary objective of this study was to identify the nature of the factors underlying the set of measures in the questionnaire, the data were subjected to factor analysis. The extraction method used was principal component analysis (Nunnally and Bernstein) which extracts the observable variables. Factor analysis was used to uncover the latent structure of a set of variables. It reduces attribute space from a large number of variables to a smaller number of factors. The varimax rotation method was used which seeks to maximize the variances of the squared normalized factor loadings across variables for each factor. This is equivalent to maximizing the variances in the columns of the matrix of the squared normalized factor loadings. The eigenvalue for a given factor reflects the variance in all the variables which is accounted for by that factor. If a factor has a low eigenvalue, then it is contributing little to the explanation of variance in the variables and may be ignored. The factor that had an eigenvalue of more than 1 was considered here. The proportion of variance of a particular item that is due to a common factor shared with other items is called communality. The reliability of the tool was tested using the split-half reliability method and Cronbach′s alpha coefficient test to find out the internal consistency of the tool. It is used to assess the consistency of results across items within a test. Scoring Version II consists of total of 42 items, in which 40 items were in a 4-point Likert scale and the remaining two items (41, 42) in a 10-point semantic scale. [INLINE:1] The maximum obtained score is 180 and the minimum score is 42. Higher the score, better the quality of life. Some items were scored as reverse and they are given below: Reverse: 3, 8, 15, 18, 19, 23, 24, 25, 25, 26, 27, 29, 30, 31, 32, 34, 35, 37, 38, 39, and 40 Direct: 1, 2, 4, 5, 6, 7, 9, 10, 11, 12, 13, 14, 16, 17, 20, 21, 22, 28, 33, 36, 41, and 42 Results To explore the structure of factors in version II, data were subjected to factor analysis. The higher KMO value (0.767) and the significant value of Bartlett′s test (P = 0.001) indicate that the sample is adequate for factor analysis. A factor loading of less than 0.40 was disregarded. Even though some solutions had minimal loading of items, they were included to explain the underlying constructs. Eleven factors emerged, which resulted in 66.7% variance. Only for one common factor, i.e., the fourth factor, the communality is 0.18 that indicates low common factor variance. [Table - 1] displays the factors with eigenvalues, communality, and percentage of variance. [Table - 2] represents the factor structure with items and its loadings. The justification of naming the factors has been made by referring to the clinical observation, previous literature, and also the underlying theoretical views that run through the items. The items in the parentheses refer to the respective item in version I. The first factor with an eigenvalue of 8.03 emerged as a significant factor with a loading of five items contributing 19.5% variances. Item 42, which measured the overall quality of life, had the highest loading of 0.853. Similarly, item 41 which measured the overall physical condition had a higher loading of 0.832. The other items described less physical performance, managing financial needs, and the support from friends and relatives. The communality value of 0.69 indicates that the items share a common variance. As the items in this factor include physical, financial, social, and overall well- being, it was named as "general well-being [Table - 2]a." The second factor had 10 items with an eigenvalue of 2.97 and contributed a variance of 11.4%. The common variance was high (0.672) showing the underlying communality. The items in this factor described the experience of pain and its interference in work capacity and sleep, and also dealt with physical problems such as passing urine, motion, appetite, feeling fatigued, and physical mobility. The second factor was therefore named as "physical well-being"[Table - 2]b. The third factor contributed a variance of 9.7% with an eigenvalue of 2.54. The common variance (0.586) indicates that items share a common variance. The items measured depression and its interference in everyday functioning, comfort in attending social functions and feeling nothing important to do, and also measured the psychological aspects such as the fear of recurrence, fear of functional disability, fear of rejection and losing social status and feeling lonely or remote. This factor was therefore named as "psychological well-being [Table - 2]c." The fourth factor with an eigenvalue of 1.96 emerged as a significant factor with four items. This factor contributed a variance of 4.7%. The items in this factor were highly loaded ranging from 0.847 to 0.424. The very low common variance (0.186) indicates that the items are sharing low common characteristics. All these items measured an individual′s satisfactory relationship with family members, ability to interact freely, and share and access support from the family members. These items imply the harmony of relationships within the family and also the adjustment of the individual with the family. This factor was named as "familial relationship" which was confined to the family [Table - 2]d. The fifth factor emerged as a significant factor with two items contributing a 3.5% variance and an eigenvalue of 1.45. The communality value of 0.302 indicates the moderate common characteristics among the items. The items 34 and 9 had loadings of 0.804 and 0.717, respectively. These items measured sexual satisfaction as well as the need for assistance in day-to-day activities. This factor was named as "sexual and personal ability [Table - 2]e." The sixth factor had an eigenvalue of 1.37 and contributed a 3.3% variance. The communality is moderate in this factor. The items in this factor described difficulty in remembering, dependency on medicine, and concentration ability. This factor was named as "cognitive well-being [Table - 2]f." In the seventh factor, items 38 and 37 had a significant loading of 0.823 and 0.748, respectively. This factor contributed a variance of 3% with an eigenvalue of 1.25. The communality value is 0.539 which indicates the high common variance within the items. The two items described the optimism, belief, and faith in oneself and in religion. This factor was named as "optimism and belief [Table - 2]g." The eighth factor had three items contributing a variance of 2.9% with an eigenvalue of 1.20. This factor had moderate communality among the items. The items assessed the reduced economic status as a result of physical condition, feeling important, and satisfaction with the responsibilities. All these items are interrelated with economy. Therefore, this factor was named as "economical well-being [Table - 2]h." The ninth factor with an eigenvalue of 1.14 and a variance of 2.7 emerged as a significant factor with a communality value of 0.38 emphasizing the importance of informational support. The two items in this factor reflected the significance of receiving information from doctors about treatment or disease. This factor was therefore named as "informational support [Table - 2]i." The 10 th factor had emerged as a significant factor with a common variance of 0.41% with only one item, which measured the cooperation of doctors with the patient. Item 29 had emerged with a loading of 0.738. This factor was named as "patient-physician relationship". It is central to the practice of medicine and is essential for the delivery of high-quality health care in the diagnosis and treatment of cancer. The physician may be viewed as superior to the patient, because the physician has the knowledge and credentials. Therefore, majority of the patients are dependent on their physician to relieve their ailments believing that they will do the best for them. In this context, the good communication of the physician itself enhances the relationship. However, it is not the determining factor for the good relationship for the educated patients who necessitate more information about the disease and treatment to make a decision or to cope up with the problem. Therefore, the informational support and the cooperation of the doctor have emerged as two independent factors [Table - 2]j. The 11 th factor also had a significant positive loading of 0.734 for item 19, which measured the satisfaction with body image. This item had emerged singly as a separate factor with a communality value of 0.77, which shows its significance. This factor was named as "body image [Table - 2]k." One item ("Do you have nausea and vomiting?" - item 10) was deleted, because it did not load in any of the factors. Finally, QOL scale version II had 41 items with 11 factors. Reliability of the QOL scale Reliability analysis for the questionnaire was carried out using the alpha coefficient, Guttmann split-half reliability method, and test-retest method. The Cronbach alpha of 0.90 and split-half reliability of 0.80 for both Part I and Part II were indicating a high reliability. The test-retest reliability of 0.42 indicated a moderate reliability of the tool. The reasons like mood fluctuations that patients experience during the period of treatment, physical and psychological problems aroused on account of illness and treatment, waiting for a long time for the treatment, and so on might significantly influence the patient′s response to the questionnaire, which could be attributed for the moderate test-retest ability [Table - 3]. Interpretation of the QOL scale The maximum score in version II is 176 and minimum is 41. Of the 183 samples, 181 samples were included for estimating the cutoff scores after eliminating one extreme case (score 85) and one outlier (score 65). The Kolmogorov-Smirnov test was carried out to establish the normality of the data. The table value indicates that the distribution of the data do not differ significantly from the normal distribution. The mean value is 133 and the median value is 134 with standard deviation of 19. The skewness value was -0.016. Hence, it was assumed that QOL scores for the selected sample were distributed normally [Table - 4]. Based on the percentiles, it was estimated that a score below the 5 th percentile was very low, and that between 5 th and 25 th percentiles was low. Similarly, the scores above the 95 th percentile were considered as very high and those between 75 th and 95 th percentiles as high. A score between 25 th and 75 th percentiles was considered as average [Table - 5]. Hence, the interpretation for QOL scale version II is as follows: Below 99 - significantly poor QOL; 9-117 - below average QOL; 118-146 - average QOL; 147-165 - above average QOL; above 165 - significantly high QOL. Discussion The common factors or constructs identified in version I (N = 400) and version II (N = 183) were psychological well-being, physical well-being, and optimism and belief. Self-adequacy (factor 2) and personal efficacy (factor 3) of versions I have emerged as familial relationship (factor 4) and cognitive well-being (factor 8) in version II. Previously observed constructs like mobility and pain have been extracted in the physical well-being factor in version II. Few new constructs have emerged. They are economic well-being, sexual and personal ability, informational support, patient-physician relationship, and general well-being. Even though the items are few in each of these constructs, they are powerful to contribute common and unique variance to the factor structure and are thus included. QOL is a multidimensional concept; the dimensions that emerged in version II and its respective items in the questionnaire are as follows:
Content validity and factorial validity were established. Stability and the internal consistency of the tool were also established. With minimum modification, a new version of 41-item questionnaire was developed from the 38-item scale. On factor analysis of version I, 10 factors emerged. In version II, 11factors emerged, which resulted in 66.7% variance. The Cronbach alpha of 0.90 and split-half reliability of 0.80 were indicating a high reliability of the tool. It is feasible to administer in the Indian oncology clinical settings. Limitation The study was confined to a single institution. Further standardization of the Quality of Life tool across different cancer populations and cultures is needed. A multicenter trial will help in developing a comprehensive, sensitive tool for QOL. References
Copyright 2011 - Indian Journal of Cancer The following images related to this document are available:Photo images[cn11133t3.jpg] [cn11133t2j.jpg] [cn11133t2c.jpg] [cn11133t2d.jpg] [cn11133t2f.jpg] [cn11133t2a.jpg] [cn11133t2i.jpg] [cn11133t2g.jpg] [cn11133t2b.jpg] [cn11133t1.jpg] [cn11133t2k.jpg] [cn11133t2h.jpg] [cn11133t4.jpg] [cn11133t5.jpg] [cn11133t2e.jpg] |
| |||||||||
