 |
| About Bioline | All Journals | Testimonials | Membership | News |
|
||||||
|
||||||
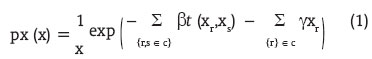
Journal of Cancer Research and Therapeutics, Vol. 1, No. 4, October-December, 2005, pp. 232-234 Brief Communications Detection of breast cancer by mammogram image segmentation Sheshadri HS, Kandaswamy A Department of Electronics & Communication Engineering, PSG College of Technology, Coimbatore-641 004, Tamilnadu, India Code Number: cr05049 Abstract An important approach for describing a region is to quantify its structure content. In this paper the use of functions for computing texture based on statistical measures is pescribed.MPM ( Maximizer of the posterior margins) algorithm is employed.The segmentation based on texture feature would classify the breast tissue under various categories. The algorithm evaluates the region properties of the mammogram image and thereby would classify the image into important segments.Images from mini-MIAS data base (Mammogram Image Analysis Society database(UK)) have been considered to conduct our experiments. The segmentation thus obtained is comparatively better than the other normal methods .The validation of the work has been done by visual inspection of the segmented image by an expert radiologist.This is our basic step for developing a computer aided detection (CAD)system for early detection of breast cancer.Keywords: Mammograms, CAD, Textural analysis, Segmentation Introduction In the past several years there has been tremendous interest in image processing and analysis techniques in mammography. One common approach for detecting abnormalities in mammograms[1],[2] is to use a series of heuristics, e.g. filtering and thresholding, which may include texture analysis to automatically detect abnormalities.[3] These heuristic methods suffer from a lack of robustness when the number of images to be classified is large.[4] Statistical methods have also been developed to address this problem. Brzakovic[5] used fuzzy pyramid linking to identify homogeneous regions in mammograms, and then used a statistical model to classify regions as non-tumor, benign tumor, or malignant tumor.Kegelmeyer[4],[6] extracted a five dimensional feature vector for each pixel which included edge orientation and the output of four spatial filters. Each feature vector was then classified using a binary decision tree. In this paper we present a new statistical algorithm[7],[10] which partitions a mammogram into homogeneous texture regions. Our algorithm assigns each pixel in the mammogram membership to one of a eight number of classes depending upon the statistical properties of the pixel and its neighbors.The individual pixel classifications form a two-dimensional labeled which must be estimated from the observed image. Both the mammogram and it's labeled fields are modeled as discrete-parameter random fields. We estimate the pixel classes by minimizing the expected value of the number of misclassi ed pixels, this is known as the\maximizer of the posterior marginals (MPM) estimate. The expectation-maximization (EM) lgorithm is employed to estimate from the observed mammogram the unknown parameters needed for the MPM estimate. Mathematical model We model the texture class labels X as a Markov Random Field (MRF) with a four-point nearest-neighbor neighborhood system and probability mass function is defined as
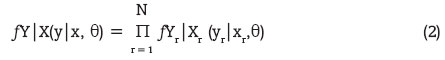
Where β and γxr are MRF model parameters, z is a normalizing constant, C is the collection of cliques for the MRF, and t(m; n) = 0, if m= n; t(m; n) = 1, if m is not equal to n. We will assume that the pixels in the observed image Y can be modeled as conditionally independent Gaussian random variables given the pixel labels X, and that the conditional probability density function of the pixel at location r given X depends only on the value of X at the same pixel location, i.e.
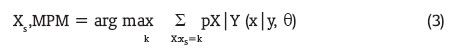
where N is the total number of pixels in the image and θ = [μ1, σ21,..., μL, σ2L], with μi and σ2i being the unknown mean and variance for texture class i, i = 1,..., L. L. L is the number of texture classes. Algorithm employed We must assign each pixel in the mammogram membership in one of the L classes subject to minimizing the expected value of the number of misclassi ed pixels. The estimate which minimizes this expected value is the MPM estimate of X. The MPM estimate at pixel s is given by
Where k ε {1, 2, ...., L}. A close form solution of the marginal probability mass functions in Equation (3) is infeasible. Our algorithm uses a Gibbs Sampler [11] to generate a Markov chain x(i) which converges in distribution to a random field with probability mass function pX|Y (x|y, θ).[10] The conditional probability mass functions are the approximated by
where n is the number of iterations performed for the Gibbs Sampler. In order to implement the Gibbs Sampler, we will use the EM algorithm to estimate the value of q. The EM algorithm is an iterative procedure for approximating maximum-likelihood estimates.Refer [7] for more details on EM algorithms. Experimental Results Images used in this research were obtained from mini MIAS mammogram database. Abnormal mammograms have an interpretation le that indicates the type(s) of abnormalities. In our experiments, images were assumed to consist of three classes: background, normal tissue, and tumor.For the spatial interaction parameter,we shall assume that its value is 2:4[7],[11] γk can be viewed as a cost parameter for class k. If for a given k, k is larger, then class k is less likely to occur than classes with smaller costs. These cost parameters were determined experimentally using a variety of sample mammography images and are set to 1,2 and 3 for this study, where class 3 is the tumor class. The e ect of this is to increase the cost of belonging to the tumor class. Since a tumor is usually associated with higher grayscale values than the other regions, we sort the grayscale values in the observed image and use the sample mean and variance of the largest grayscale values as the initial parameter estimates for the tumor class. The remaining values are then used to obtain initial estimates of the parameters for the normal tissue and background region. In addition to segmenting abnormalities, our algorithm can also indicate the reliability of each classi ed pixel by using the marginal conditional probability mass function of the label eld estimated by Equation (4). This information is displayed as an image where each pixel value is proportional to the marginal conditional probability associated with classi ed pixel, i.e. larger graylevel indicates higher reliability of classi cation.We have tested our algorithm on all the mammograms in the database that contain Microcalci cations, circumscribed masses, and stellate lesions. [Figure - 1] [Figure - 2] show some of our segmentation results. Our algorithm detected 100% of the abnormal tissues in the 7 mammograms that contain circumscribed masses, 65% of the 17 mammograms that have microcalci cations, but only 58% of the 12 mammograms that have stellate lesions. The number of false classi cations is larger with stellate lesions because our observation model is not very good at modeling locally radiating structures such as stellate lesions.Conclusions We developed the above image processing algorithms using Matlab codes and applied over to several images from the miniMIAS data base. The results are found to be satisfactory and they have been validated by expert radiologists. Further we are incorporating the above algorithms for the development of CAD system for early detection of breast cancer. References
Copyright 2005 - Journal of Cancer Research and Therapeutics The following images related to this document are available:Photo images[cr05049f2.jpg] [cr05049f1.jpg] |
| |||||||||

![[Figure - 1]](/showimage?cr/photo/cr05049f1.jpg)
![[Figure - 2]](/showimage?cr/photo/cr05049f2.jpg)