 |
| About Bioline | All Journals | Testimonials | Membership | News |
|
||||||
|
||||||
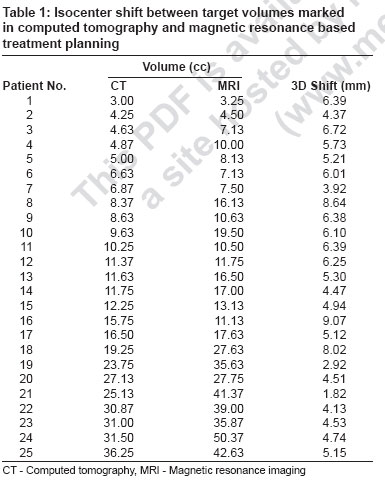
Journal of Cancer Research and Therapeutics, Vol. 3, No. 2, April-June, 2007, pp. 121-123 Brief Report Comparison of computed tomography and magnetic resonance based target volume in brain tumors R Prabhakar, KP Haresh, T Ganesh, RC Joshi, PK Julka, GK Rath Department of Radiation Oncology, Institute Rotary Cancer Hospital, All India Institute of Medical Sciences, New Delhi - 110 029 Code Number: cr07031 Abstract Purpose : This study was mainly framed to study the difference in tumor volumes as seen on computed tomography (CT) and magnetic resonance (MR) and their significance in planning.
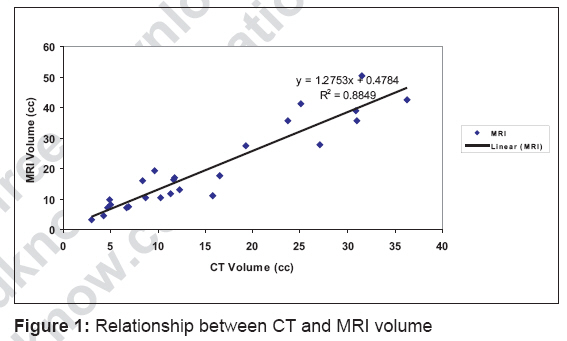
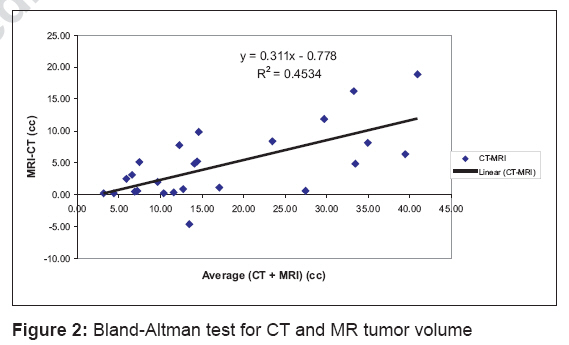
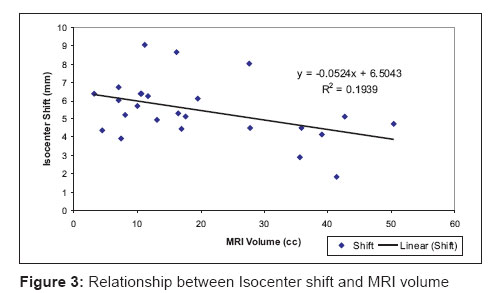
Keywords: Brain tumor, computed tomography, magnetic resonance imaging Introduction Computed tomography (CT) has made a dramatic impact in radiotherapy treatment planning. Although, CT provides geometrically precise scans, it gives less information about the soft tissues, in comparison to magnetic resonance imaging (MR). The high sensitivity of MR to variations in tissue proton density and in T 1 and T 2 relaxation times can be of value for radiotherapy imaging in central nervous system lesions. Magnetic resonance imaging (MRI) provides excellent contrast resolution, easy multiplanar imaging and absence of artifacts. Because of the absence of bone artifacts, as seen on CT, MRI is superior for imaging the lesions at the vertex, in the posterior fossa, near the walls of the middle fossa and at the base of the skull . CT is superior to MRI for detecting meningioma but requires contrast enhancement. Both MRI and contrast-enhanced CT are effective in defining pituitary tumors, but MRI may provide more information about the precise extent of the lesions and their effect on adjacent structures. In many instances, the sensitivity of MRI exceeds that of CT. Though CT - MR fusion is the standard imaging technique for radiotherapy treatment planning for brain tumors, many centers still use CT alone. This study was mainly framed to study the difference in tumor volumes as seen on CT and MR and their significance in planning.Materials and Methods Twenty-five patients with brain tumor of different diagnoses who underwent stereotactic radiotherapy were included in this study. The diagnoses include pituitary adenoma, glioma, craniopharyngioma, meningioma and brain metastasis. Immobilization was done with a relocatable frame (Gill-Thomas Cosman). Using the sequential scanning mode, 60 to 80 slices were taken for each patient. Contrast enhanced CT scan was done with CT localizer frame placed over the GTC frame for 2.5 mm slice thickness (Siemens Volume Zoom CT TM ). Similarly, contrast enhanced MR imaging was performed with MR localizer frame for 2.5 mm slice thickness (Sonata TM ). Both the image data sets were transferred to the Xknife-RT TM treatment planning system. Both the CT and MR datasets were registered using the MR and CT localizer rods attached to the patient frame. Tumor volume was marked separately on CT and MR image datasets. The CT tumor volume and MR tumor volume were measured and compared with each other. The center of mass of the tumor volume delineated on CT and MR were computed and the shift between the two CMs was determined with the distance formula. Statistical analysis was done with SPSS ver.10.0 software. The CT and MR volume comparison was done by paired t-test.Results The tumor volume delineated on CT and MR datasets along with the CM is shown in [Table - 1]. The mean and median volume of the tumor as measured from the MR scans was 19.67 cc ± 13.73 and 16.13 cc (range: 3.25 cc - 50.37 cc). Similarly, the mean and median volume of the tumor as measured from CT scans was 15.05 cc ± 10.13 and 11.63 cc (range: 3.0 cc - 36.25 cc) respectively. The mean and median CM shift between CT and MR was 5.47 mm and 5.21 mm respectively. There is a linear relationship between MRI and CT volume with a good correlation coefficient of r= 0.94 and MRI shows 1.27 times more volume when compared to CT volume [Figure - 1]. [Figure - 2] shows the Bland-Altman test for CT and MR tumor volumes. It shows that MRI volume is larger than CT volume in most of the studied cases. Statistical analysis using paired sample t-test for the difference in CT and MR tumor volume was highly significant ( P < 0.0001). [Figure - 3] shows the relationship between CM shift and MRI volume. It shows that the CM shift (Planning isocenter shift) decreases with increase in tumor volume.Discussion CT-based planning in brain tumor without the use of MRI will lead to under-dosage to the tumor. In our study, except in the case of meningiomas in more than 44% of the patients, MRI showed more than 40% increase in the tumor volume. The statistics clearly show that MRI plays a very important role for tumor delineation for brain tumors and MRI should compulsorily be incorporated for radiotherapy treatment planning. Our results clearly show that CT underestimates the tumor volume in brain tumors and the isocenter shift also indicates a possible tumor under-dosage when CT alone is used for planning. The fact that MRI shows larger tumor volume compared to CT is well in accord with the published results. [1],[2] The relationship between isocenter shift and MRI volume reveals that isocenter shift decreases with increase in tumor volume. It shows that there may be geometric miss in small tumors especially if CT alone is used for treatment planning. It is also evident from these figures that small tumor may get under-dosed if CT alone is used for planning. It was reported about a decade ago that on using MRI for radiation treatment planning in brain tumors, there was a mean reduction of 30% in field size from the purely CT defined one. [3] However, two other groups have reported an increased MRI defined target volume with a greater volume seen on MRI alone as opposed to CT only. [1],[4] It can therefore be concluded that there is an increased sensitivity of MRI in defining target volumes. This will in turn lead to better dose delivery to the tumor as well as more sparing of normal tissues. [5] Although CT scanning provides geometrically precise scans, it gives less detailed tumor and normal tissue anatomic definition, in comparison to MRI. [6] Conclusion The study demonstrates that MR is an indispensable imaging modality in radiotherapy for planning brain tumors. References
Copyright 2007 - Journal of Cancer Research and Therapeutics The following images related to this document are available:Photo images[cr07031f3.jpg] [cr07031f2.jpg] [cr07031f1.jpg] [cr07031t1.jpg] |
| |||||||||
