 |
| About Bioline | All Journals | Testimonials | Membership | News |
|
||||||
|
||||||
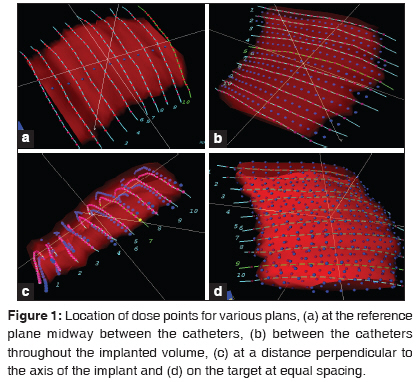
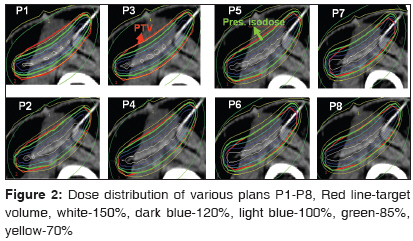
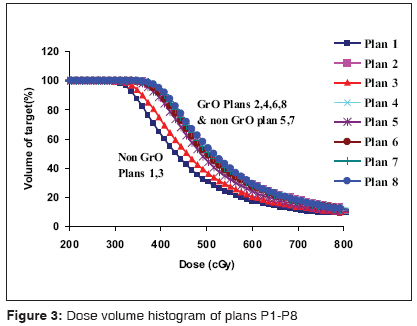
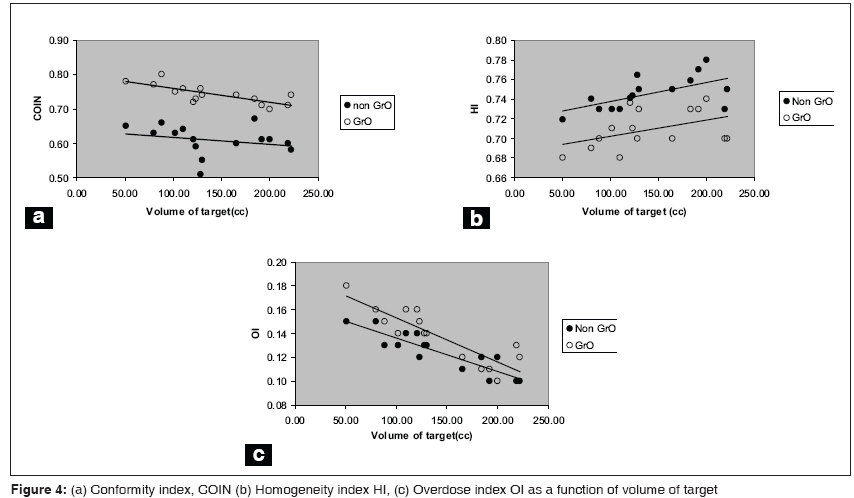
Journal of Cancer Research and Therapeutics, Vol. 5, No. 4, October-December, 2009, pp. 240-246 Original Article Dose optimization of intra-operative high dose rate interstitial brachytherapy implants for soft tissue sarcoma Jamema SwamidasV, Sharma PramodK, Sharma Dayananda, Laskar Siddhartha, Deshpande DeepakD, Shrivastava ShyamK Department of Medical Physics, Tata Memorial Hospital, Parel, Mumbai Code Number: cr09060 PMID: 20160356 DOI: 10.4103/0973-1482.59893 Abstract Objective : A three dimensional (3D) image-based dosimetric study to quantitatively compare geometric vs. dose-point optimization in combination with graphical optimization for interstitial brachytherapy of soft tissue sarcoma (STS).Materials and Methods : Fifteen consecutive STS patients, treated with intra-operative, interstitial Brachytherapy, were enrolled in this dosimetric study. Treatment plans were generated using dose points situated at the "central plane between the catheters", "between the catheters throughout the implanted volume", at "distances perpendicular to the implant axis" and "on the surface of the target volume" Geometrically optimized plans had dose points defined between the catheters, while dose-point optimized plans had dose points defined at a plane perpendicular to the implant axis and on the target surface. Each plan was graphically optimized and compared using dose volume indices. Results : Target coverage was suboptimal with coverage index (CI = 0.67) when dose points were defined at the central plane while it was superior when the dose points were defined at the target surface (CI=0.93). The coverage of graphically optimized plans (GrO) was similar to non-GrO with dose points defined on surface or perpendicular to the implant axis. A similar pattern was noticed with conformity index (0.61 vs. 0.82). GrO were more conformal and less homogeneous compared to non-GrO. Sum index was superior for dose points defined on the surface of the target and relatively inferior for plans with dose points at other locations (1.35 vs. 1.27). Conclusions : Optimization with dose points defined away from the implant plane and on target results in superior target coverage with optimal values of other indices. GrO offer better target coverage for implants with non-uniform geometry and target volume. Keywords: 3D image based dosimetry, graphical optimization, soft tissue sarcoma implants Introduction Brachytherapy represents an effective means of enhancing the therapeutic ratio of radiation therapy, offering both biological and dosimetric advantage in the treatment of patients with soft tissue sarcomas (STS). [1] In particular, intra-operative high dose rate (HDR) brachytherapy, after a wide local excision, has shown significant improvement in the local control of STS as compared to patients treated with surgery alone. [2],[3] Appropriate patient selection, implant techniques and treatment planning are the key factors contributing to improved treatment outcomes. The most challenging aspect of STS implants is to maintain the inter-catheter spacing in a highly irregular anatomical site. The non-uniform spacing of catheters will increase the likelihood of hot or cold spots occurring within the tumor bed. Due to the highly irregular nature of the anatomy at most STS sites, the inter-catheter distances become uneven. Optimization plays an important role to achieve a uniform dose distribution in the implanted volume even if the catheter spacing is non-uniform. Further, the underlying bone needs to be spared, which could also be achieved through optimization. The recent introduction of graphical optimization allows the user to manipulate the isodose lines manually to ensure adequate target coverage and spare critical structures. However, irrespective of the implant technique and dosimetry, our intent to deliver optimum dose to the tumor is often limited, due to the difficulties in maintaining optimum implant geometry in irregular anatomy of extremities. Conventionally, orthogonal or variable angle radiographs had been used to reconstruct the implant geometry. Currently, 3D image-based planning, using CT scans, is being used commonly for brachytherapy implants. CT-based planning demonstrates a clear advantage over conventional, radiograph-based 2D planning, due to its ability to provide spatial dose distributions on patient anatomy and quantitative estimates regarding target volume coverage, dose to organs at risk and dose homogeneity. With the introduction of 3D image-based planning at our hospital for STS implants, a systematic study was carried out to evaluate the dosimetric outcome. The purpose of this study is to objectively compare the dosimetric outcome of different plans, generated using geometric optimization (GO) and dose point optimization (DPO) methods, with various locations of dose points, for patients treated with intra-operative, interstitial Brachytherapy for STS. The analysis is based on cumulative dose volume histograms (cDVH) and dose volume indices. Materials and Methods Fifteen consecutive STS patients (extremity and chest-wall STS), treated with intra-operative, interstitial brachytherapy, were enrolled in this dosimetric study. All patients included in this study were treated with temporary, intra-operative interstitial brachytherapy using Iridium-192. After wide local excision, the tumor bed was demarcated by the surgeon and the radiation oncologist, using radio-opaque surgical clips. Plastic after-loading catheters were introduced into the tumor bed using 16-gauge stainless-steel needles. The implanted area generally included the tumor bed with a 2-cm radial margin. The longitudinal margin depended on the intent of brachytherapy; i.e. when brachytherapy was intended to be used as a boost along with external beam radiotherapy, the margin was 2 cm beyond the tumor bed, while the margin was increased to 3-4 cm at radical brachytherapy alone. [1] All the patients evaluated in this study were treated with intent of radical brachytherapy. The catheters were placed parallel to each other with an inter-catheter separation of 1.0-1.2 cm. No effort was made to include the drain sites within the implanted volume. A single-plane arrangement was used for all patients. Catheters were inserted to a depth of approximately 5 mm into the tumor bed to avoid under dosage of the tumor bed. In situations where the catheters could not be anchored to the tumor bed, resorbable sutures were used to secure the catheters onto the tumor bed. Image acquisition for treatment planning was done on the 4-5 th day after surgery. For each patient, axial CT scan of 3 mm slice thickness was taken on Somatom Emotion CT scanner (Siemens Medical Systems, Germany) with 0.2 mm copper wires in the nylon catheters. The images were transferred to Plato Sunrise v14.3 (Nucletron, Veneendal, Netherlands) treatment planning system (TPS) via local area network. The dose computation algorithm is based on TG 43 as recommended by the American Association of Physicists in Medicine (AAPM). [4] Multi-planar reconstructions were used to reconstruct the implant geometry using the CT images. This algorithm enables the planner to track the catheters in axial, coronal and sagittal planes. Target volume delineation was carried out based on the recommendations of American Brachytherapy Society. [1] The surgeon and the radiation oncologist jointly demarcated the target volume on the CT dataset using the implanted surgical clips. Pre-operative MRI findings were used as a guideline for target volume delineation. The thickness of the target volume was defined as a slab of thickness of 1cm perpendicular to the plane of the implant. The average number of catheters was 12±2. Active dwell position in each catheter was loaded with an extra margin of 10 mm across the target volume. For each patient, eight plans (P1 to P8) were generated using various locations of dose points and optimization methods. Dose points were defined (a) between the catheters at the reference plane of the implanted volume, (b) between the catheters throughout the implanted volume, (c) at a distance of 5 to 7 mm perpendicular to the implant plane and (d) on the target volume with equal spacing generated by the planning system automatically [Figure - 1]a-d. Generally, dose point optimization depends on the establishment of dose points for optimization and prescription, while geometrical optimization needs no dose points for optimization but for normalization and prescription. In geometrical optimization, the source dwell positions themselves are used as dose points during optimization. In the present study, geometrically optimized plans had their dose points defined between the catheters at the reference plane and throughout the implanted volume while dose-point optimized plans had dose points defined at a distance perpendicular to the catheters and on the target. P1 and P3 were geometrically optimized plans, with variation in dose prescription points, while P5 and P7 were dose point optimized plans. Each plan was graphically optimized to improve the target coverage which generated P2, P4, P6 and P8. In each slice the dose distribution was adjusted manually so that the target coverage was optimal. Since graphical optimization is operator dependent, to maintain uniformity among the graphically optimized plans, emphasis was given to adequately cover the target without disturbing other indices to a large extent. The details of various plans generated are summarized in [Table - 1]. Dosimetric outcome from these eight different plans were compared qualitatively and quantitatively. For quantitative analysis, cDVH was calculated for every plan with 25 mm margins around the implanted volume in all directions with 100,000 calculation points randomly placed in the volume of interest. Volumetric quantifiers proposed by Baltas [5] such as coverage index (CI), dose homogeneity index (HI), external volume Index (EI), overdose volume index (OI) and conformity index (COIN) were estimated from the cDVH of target volume and normal tissue around the target. CI is the fraction of the target receiving a dose equal to or greater than the reference dose, HI is the fraction of target receiving a dose between 100 and 150% of the reference dose, EI is the ratio of the normal tissue volume outside the target receiving a dose equal to or greater than the reference dose to target and OI is the fraction of the target receiving a dose equal or greater than two times the reference dose. COIN describes the normal tissue irradiation with respect to target coverage, COIN = c 1 × c 2 Where c 1 = PTV ref / PTV c 2 = PTV ref / V ref PTV ref refers to the part of the PTV covered by the reference dose and V ref refers to the total volume covered by the reference isodose. The fraction of the PTV, which is enclosed by the reference isodose, is described by c 1 and the fraction of the total volume covered by the reference dose that belongs to the PTV by c 2 . COIN can take values between 0 and 1 with 1 associated with full conformity. To determine the overall figure of merit of various plans, Sum Index (SI) proposed by Meertens et al, [6] was evaluated for all the plans. SI was calculated using the formula SI = CI + HI -EI - OI. In the present study, OI was included in the sum index, since high dose region was a cause of concern especially for pediatric patients. Mean central dose (MCD), minimum target doses (MTD) were also evaluated according to ICRU 58 [7] recommendations, A total dose of 36 Gy in nine fractions, two fractions daily, was delivered on MicroSelectron HDR 192 Ir remote afterloading system (Nucletron, Veneendal, Netherlands). Results The volume of target ranged from 50 - 222 cc with a mean of 136.74 cc (Standard Deviation SD = 57cc). [Figure - 2] represents dose distribution of patient no. 8, as a representative case. Quantitative evaluation of the dosimetric outcome from various plans shows that the target coverage was optimal for P2 and P4-P8 (0.91±0.02), while relatively suboptimal (0.7±0.04) for P1 and P3. Target coverage improved with increase in high dose region (volume receiving 200% of prescription dose) when non graphical optimized plans, P1, P3, P5 and P7 were graphically optimized to obtain P2, P4, P6 and P8 respectively. [Table - 2] represents the mean (SD) of dose volume indices such as CI, HI, OI, EI, COIN and SI derived from the cDVH for various plans (P1 to P8); cDVH of target from various plans of a representative patient is shown in [Figure - 3]. Target volume coverage was observed to be inferior for P1 and P3 with a mean (SD) CI of 0.67±0.05 and 0.72±0.04 respectively. CI increased to 0.88±0.04 and 0.90±0.03 for P5 and P7 while maintaining almost similar HI. Irrespective of the location of dose points, interactive graphical optimization leads to improved target coverage at the cost of HI. All the graphically optimized plans resulted in CI ≥ 0.9 (range 0.9 - 0.93). Maximum of 20% increase of CI was observed in P2 over P1 and minimum of 3.5% in P8 over P7 which led to the reduction of HI from 0.74 to 0.68 and 0.7 to 0.68 respectively. Non-graphically optimized plans were more homogeneous (0.72±0.02), while graphically optimized plans were less homogeneous (0.68±0.01) as compared to their corresponding non-graphically optimized plans [Table - 2] and [Figure - 4]b. V 150 and V 200 were less than 60cc and 29cc respectively, highest being observed in P8. Larger OI, 0.11-0.14 was observed in plans where the dose points were defined at a distance and on the target (P5- P8) as compared to 0.07-0.13 for plans where dose points were defined inside the implanted volume (P1-P4). Interactive graphical optimization further increased OI. Maximum OI was observed in P8 with a mean of 0.14±0.02, whereas maximum increase was observed for P2 0.13±0.01 as compared to 0.07±0.01 in P1. In terms of absolute volumes, a maximum of 29 cc was recorded for a target volume of 219cc for P8. Mean EI was found to be in the range of 0.06-0.19. EI was observed to increase consistently for all graphically optimized plans as compared to their corresponding non-graphical optimized plans. The mean value of COIN was found to be in the range of 0.61 - 0.82. P8 resulted in maximum COIN of 0.82±0.05 while P1 with a minimum of 0.61± 0.04. Graphically optimized plans were more conformal as compared to the non graphical optimized plans. The increase in the mean value of COIN for the graphically optimized plans (P2, P4, P6 and P8) as compared to the corresponding non graphical optimizations plans (P1, P3, P5 and P7) were 20, 13, 3 and 5% respectively. The maximum benefit of graphical optimization was found in P1 and P3 as compared to P5 and P7. [Figure - 4] shows COIN, HI and OI as a function of target volume for both graphically and non-graphically optimized plans of P3 and P4. Linear dependence was observed with respect to increase in target volume for HI and OI for both graphically and non-graphically optimized dose plans. However, favorable values of COIN [Figure - 4]a were found for small target volumes. The effect of graphical optimization was more pronounced for HI, OI [Figure - 4]b, c and volume receiving 200% prescription dose [Figure - 5]a, b. SI was found to be in the range of 1.27-1.35. The sum index was superior for P7 and inferior for P2 and P6, however, there was not much difference observed in SI for other plans. [Figure 6] shows the histogram of SI for different plans. The mean values of the parameters recommended by ICRU 58 [7] are given in [Table - 3]. Mean MTD ranged between 50 - 82%. For all graphically optimized plans mean MTD was greater than 75% (77-82%) otherwise it was between 50-70%. Discussion Irrespective of the location of dose points and optimization method, graphical optimization improves the target coverage. The results of the present study further showed that dose point optimized plans with dose points located on the target resulted in optimal outcome with respect to SI [Table - 2]. Geometrically and graphically optimized plans (P2) with dose points defined between the catheters at the reference plane resulted in inferior SI. SI seems to be a useful parameter to compare plans, with higher SI values representing better plans. However, SI alone should not be used as a parameter to evaluate the plans, since plans with higher CI could have lower values of SI (e.g. Plan 6: CI = 0.92; SI = 1.27 Vs Plan 1: CI = 0.67; SI = 1.28). Our inference supports the findings of Major et al.[8] who suggest the introduction of different weighting factors to obtain a representative SI value that could be used as a single parameter to evaluate various plans with respect to dose volume indices. In a comparative study [9] of Paris, SSDS and conformal dosimetry system (CDS) systems, for interstitial implants with ideal geometry, it has been reported that the geometric pattern of the implanted catheters has a great impact on dose volume indices. Dose volume indices are reported to be relatively inferior for single plane implants compared to double plane implants. It has also been reported that there was no difference in dose volume indices between geometrically optimized and dose point optimized plans. However, there was a significant difference found between the optimized and un-optimized plans. In a subsequent study, the same [8] authors analyzed ideal geometry implants and reported that the dose point optimization is much superior for single plane implants than geometric optimization which is similar to the findings of the present study. However, we found that there was a difference between the optimization methods depending on the location of the dose points. Among the non-graphically optimized plans, where the dose points were placed on the target and at a distance perpendicular to the catheters, coverage of target was superior (CI = 0.9 and 0.88 respectively) compared to plans with dose points located inside the target volume, at the reference plane (P3: CI = 0.72 and P1: 0.67 respectively). Though there was a significant improvement in the target coverage with the dose points located between the catheters, throughout the implanted volume, it was observed that the superior target coverage was achieved when the dose points were on target or at a distance from the catheters perpendicular to the axis of the implant. As the aim in the present study was to compare the plans with various locations of dose points and optimization methods parameters such as prescription dose, active length and dose prescription were kept constant. To achieve good target coverage the prescription isodose surface should ideally conform to the shape of the target. To obtain this, dose points have to be uniformly distributed on the surface of the target to describe the 3D shape of the target. The optimization algorithms then try to minimize the variance of the dose values at these dose points. Hence, for a single plane STS implant with 3D image based planning, dose points on the target will yield better coverage than when the dose points were defined between the catheters throughout the implanted volume. However, successful implementation of this method depends on the accurate delineation of the target, which is based on the pre surgical MRI images and intra-operative delineation of the tumor using radio-opaque clips introduced during surgery. The option of defining dose points at a distance from the catheter was also evaluated, so that this method could be used in situations where it is not feasible to delineate the target volume accurately. In intra-operative interstitial brachytherapy of STS, the catheters are inserted directly into the tumor bed during the surgery, thus ensuring that a slab of tissue of a defined thickness immediately surrounding the catheters forms the target volume. CI was significantly improved in graphically optimized plans compared to non- graphically optimized plans [Figure - 3]. However, plans with dose points located on the target and at a distance perpendicular to the catheters had similar coverage irrespective of the optimization method. A recent publication [3] reported the results of patients treated with interstitial brachytherapy for soft tissue sarcomas. All patients in this series involving various sites uniformly underwent single plane interstitial brachytherapy. The treatment plans were dose point optimized (DPO) with dose points defined at a distance from the reference plane. The benefit of graphical optimization was more for plans, where dose points located within the target volume. Low values of CI obtained in this study (CI = 0.67-0.93) compared to CI=0.95 reported in other studies with ideal geometry [8],[9],[10],[11] could be attributed to the geometric irregularity of the implant and shape of the target. Graphical optimization can be used as a tool to compensate for the geometrical irregularities of the implant and the target. While CI and COIN improve with graphical optimization, other indices such as EI, OI and HI become relatively inferior. [Figure - 5] shows the indices COIN, HI and OI, as function of target volume. The results of our study showed that with graphical optimization, CI and COIN improved while HI, EI and OI deteriorated, which again could be attributed to the geometrical irregularity of the implant. Vikram et al.[12] reported that the relationship between the hot spot and the complication rate is insignificant for high dose rate interstitial brachytherapy implants, so the hotspots need not preclude optimization to ensure adequate coverage of the target. Hence reduction of HI is acceptable during graphical optimization for adequate target coverage. In some implants, it was observed that due to large geometrical irregularities the HI becomes inferior (< 0.65). In another publication, Wazer et al.[13] reported that the size of high dose regions correlates to necrosis for breast implants, and the reduction of high dose volumes may reduce the normal tissue complication. Hence, the use of graphical optimization to obtain good target coverage in implants with large geometrical irregularities has to be done with caution, so that other indices such as HI and OI also remain optimal. With respect to homogeneity, plans with dose points between the catheters offer superior plans compared to plans with dose points on the target and at a distance from the catheters. Similarly, OI and EI were better with plans when dose points were within the target. With the use of graphical optimization, homogeneity becomes inferior [Figure - 4]b, in addition to an increase in normal tissue irradiation and over dose volume. Major et al.[8] have reported that among the optimized systems, conformality differ significantly, while no significant difference was found for homogeneity. The results of the present study are similar to the above findings. Tanderup et al.[11] have compared non-optimized, optimized and graphically optimized implants for both theoretical and clinical implants of cervical cancer. It was reported that homogeneity and overdose indices were dependent on the size of the target. [Figure - 5]a and b show OI and HI as a function of volume of 200% of prescription isodose (V 200% ). Favourable values of HI and OI were found for large volumes of V 200% . Since OI and HI are used to correlate with complications, they should not be considered to evaluate implants of different patients; rather it should be used as a tool to evaluate different plans of the same patient to obtain the best plan. These findings are similar to that reported by Tanderup et al. [11] Graphically optimized plans have higher COIN values (0.82) compared to non-graphically optimized plans with dose points defined midway between the catheters. However, when dose points were defined on the target and at a distance from the catheter even the non-graphically optimized plans resulted with better COIN values (0.78). For an irregular shape of the target, graphical optimization was helpful in obtaining good COIN. Graphical optimization is a powerful tool that allows the user to shape the isodose lines wherever required. Such modifications made in a single cross section image may result in variation of isodose distributions in other cross sections. Hence attempts at graphical optimization should be undertaken keeping in mind the possible variations of isodose distributions in the remaining target volume. Conclusion The results of the present study indicate that the optimal plan, with respect to dose volume indices, could be obtained when dose points were defined on the target, and at a distance perpendicular to the implant axis, for single plane intra-operative high dose rate implant for soft tissue sarcoma. Dose point optimized plans in combination with graphical optimization produces superior target coverage. However, for geometrically optimized plans, with dose points defined between the catheters, the coverage was suboptimal, which could be corrected using graphical optimization. Graphical optimization can compensate for small geometrical irregularities of the implants. Graphical optimization improves target coverage at the expense of dose homogeneity; it should be used with caution to avoid creating zones of potentially toxic hyper dose. CI, HI and OI were dependent on the target volume, and hence these parameters cannot be used to compare plans of different patients. More clinical work is necessary to correlate OI/HI with complications, so that a balance between OI/HI and CI can be achieved that optimizes clinical outcome. 3D image based planning improves our ability to quantitatively evaluate the target coverage for intra-operative high dose rate interstitial brachytherapy implants for soft tissue sarcoma. References
Copyright 2009 - Journal of Cancer Research and Therapeutics The following images related to this document are available:Photo images[cr09060f5.jpg] [cr09060f4.jpg] [cr09060t1.jpg] [cr09060f2.jpg] [cr09060f1.jpg] [cr09060t3.jpg] [cr09060f3.jpg] [cr09060t2.jpg] |
| |||||||||

![[Table - 1]](/showimage?cr/photo/cr09060t1.jpg)
![[Table - 2]](/showimage?cr/photo/cr09060t2.jpg)
![[Figure - 5]](/showimage?cr/photo/cr09060f5.jpg)
![[Table - 3]](/showimage?cr/photo/cr09060t3.jpg)