 |
| About Bioline | All Journals | Testimonials | Membership | News |
|
||||||
|
||||||
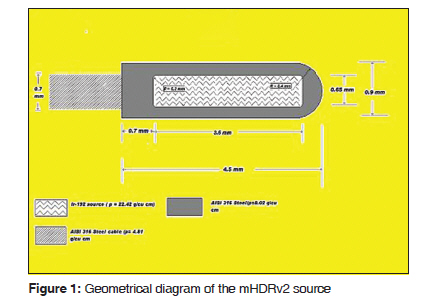
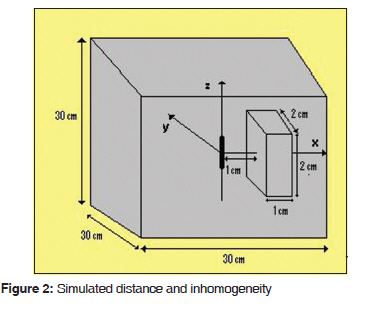
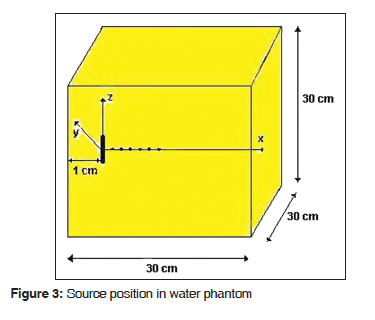
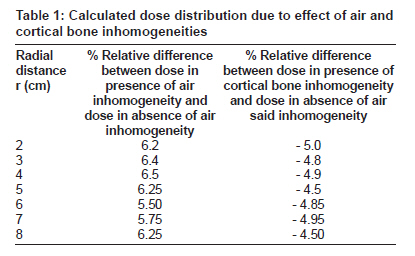
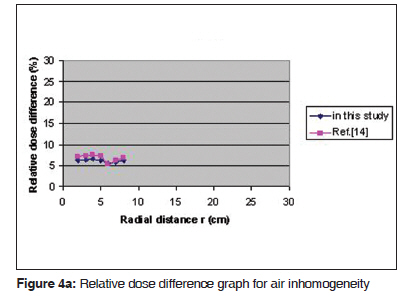
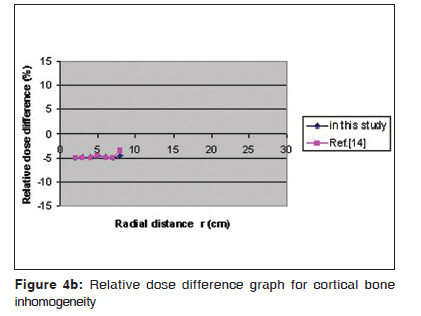
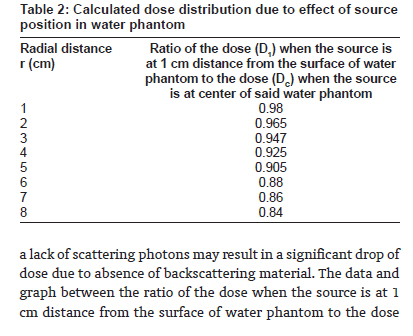
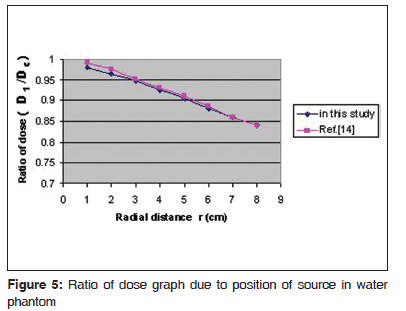
Journal of Cancer Research and Therapeutics, Vol. 6, No. 1, January-March, 2010, pp. 54-57 Original Article Effect of inhomogeneities and source position on dose distribution of nucletron high dose rate Ir-192 brachytherapy source by Monte Carlo simulation R. M. Chandola, S. Tiwari 1 , M. K. Kowar2 , V. Choudhary Department of Radiotherapy, Pt. J. N. M. Medical College & Dr. B.R.A.M. Hospital, Raipur, Code Number: cr10012 DOI: 10.4103/0973-1482.63567 Abstract Background: The presence of least dense dry air and highly dense cortical bone in the path of radiation and the position of source, near or far from the surface of patient, affects the exact dose delivery like in breast brachytherapy. Aim: This study aims to find out the dose difference in the presence of inhomogenieties like cortical bone and dry air as well as to find out difference of dose due to position of source in water phantom of high dose rate (HDR) 192 Ir nucletron microselectron v2 (mHDRv2) brachytherapy source using Monte Carlo (MC) simulation EGSnrc code, so that the results could be used in Treatment Planning System (TPS) for more precise brachytherapy treatment. Settings and Design: The settings and design are done using different software of the computer. Methods and Materials: For this study, the said source, water phantom of volume 30 x 30 x 30 cm 3 , inhomogeneities each of volume 1 x 2 x 2 cm 3 with their position, water of water phantom and position of source are modeled using three-dimensional MC EGSnrc code. Statistical Analysis Used: Mean and probability are used for results and discussion. Results : The % relative dose difference is calculated here as 5.5 to 6.5% higher and 4.5 to 5% lower in the presence of air and cortical bone respectively at transverse axis of the source, which may be due to difference of linear attenuation coefficients of the inhomogeneities. However, when the source was positioned at 1 cm distance from the surface of water phantom, the near points between 1 to 2 cm and 3 to 8 cm. from the source, at its transverse axis, were 2 to 3.5% and 4 to 16% underdose to the dose when the source was positioned at mid-point of water phantom. This may be due to lack of back scatter material when the source was positioned very near to the surface of said water phantom and overlap of the additional cause of missing scatter component with the primary dose for near points from the source. These results were found in good agreement with literature data. Conclusion: The results can be used in TPS.Keywords: Brachytherapy, inhomogeneity, Monte Carlo, radiation-tissue interaction Introduction The main aim of radiotherapy is delivery of lethal dose to target with minimum dose to the surrounding healthy tissues when the ionizing radiation is employed for treatment. Today, the role of brachytherapy treatment has increased a lot in clinical radiotherapy. The main advantage of brachytherapy technique is the high conformal energy delivery to the malignant tissues volume and sparing of the healthy tissues at risk due to the law of Inverse Square on the dose distribution around the source. Monte Carlo (MC) has become an accepted dose calculation methodology in brachytherapy treatment planning. [1],[2],[3] It is advocated in TG43U1 [4],[5] that for exact dose delivery to the patient by brachytherapy, the dose distribution data should be obtained either by experiment or by MC simulation using appropriate code, which then to be used as input data in high dose rate (HDR) brachytherapy Treatment Planning System (TPS) planning. Apart from radiation-tissue interaction study, the MC simulation is used to solve various other physical problems. Although there is no unique and universal definition of the MC method, we would like to take the definition by Lux et al. [6] "In all applications of the MC method, a stochastic model is constructed in which the expected value of a certain random variable (or a combination of several variables) is equivalent to the value of a physical quantity is determined. This expected value is to be estimated by the average of multiple independent samples representing the random variable introduced above". Materials and Methods The geometric dimensions of the said source are derived from [7] and illustrated in [Figure - 1]. It has an active core made of 192 Ir of effective density of 22.42 g/cm 3 and active length of 3.6 mm. with active diameter of 0.65 mm. The active core is surrounded by the stainless steel AISI 316 L encapsulation of density 8.02 g/cm 3 with composition by weight (Iron) Fe 68%, Chromium (Cr) 17%, Nickel (Ni) 12%, Manganese (Mn) 2% and Silicon (Si) 1%. With this encapsulation the total length of the source becomes 4.5 mm. with total diameter of 0.9 mm. This distal capsule tip has rounded borders with radius of curvature of 0.4 mm. The source is welded on a flexible woven stainless steel cable with a diameter of 0.7 mm. As the portion of the cable near the source is in a straight line, the dose around the cable in this length is, in general, not critical; therefore, the length of simulation is not taken to be more than 5 mm.Water phantom modeled had a dimension 30 x 30 x 30 cm 3 which acts as unbounded phantom up to 20 cm. of distance. [8] The density of water used in the simulation was 0.997 g / cm 3 at 22 0 C, as is recommended in TG43U1. [4],[5] The applicator modeled was of stainless steel 1.4401 (equivalent to AISI/SAE 316) of density 8.0 g / cm 3 and with wall thickness of 0.15 mm. The inner and outer diameters of the applicator were 1.35 ± 0.02 mm and 1.65 ± 0.02 mm respectively and the value of effective attenuation co-efficient was taken as 0.030 ± 0.002 (ANSI 303/304). [9] The gamma spectrum of the Ir HDR brachytherapy source used in this study has been obtained from NuDat database. [10] The gamma rays have been simulated considering that 192 Ir is uniformly distributed in the source core. The beta spectrum of the Ir source has not been considered in simulation since its contribution to the dose rate distribution for distances greater than 1 mm from the source is negligible due to the encapsulation of the source and the catheter in which the source is introduced. [11] However, the models for the processes of Compton scattering, Photoelectric effect and Rayleigh scattering have been used from the low energy package of EGSnrc. The cross-section tabulation was taken from the EPDL 97. [10] Dry air inhomogeneity modeled was with composition and density as recommended inTG43U1 [4] with relative humidity of 40% of volume 1 x 2 x 2 cm 3 and cortical bone inhomogeneity modeled was with composition and density as recommended in International Commission on Radiological Protection (ICRP) of volume 1 x 2 x 2 cm 3 . For MC calculated inhomogeneities effect study, first the source was modeled fixed in the center of the said water phantom along Z axis as shown in [Figure - 2] with the tip of the source towards +Z axis. The center of the active source acts as the center of the co-ordinate axes. The dose was calculated without any inhomogeneity at different points from the source at its transverse axis. Then, the said inhomogeniety air or cortical bone of volume 1 x 2 x 2 cm 3 was positioned at transverse axis at 1 cm. distance from the center of source as shown in [Figure - 2] and the dose was calculated at different points from the source at it's transverse axis. However, for MC calculation study of the effect of source position in water phantom, first the source was positioned fixed in the center of the said water phantom along Z axis with the tip of source along +Z axis. The dose was calculated at different points from the center of source at transverse axis. Then the said source was modeled fixed at 1 cm. distance from the surface of water phantom and the dose was calculated at different points from the center of source. The said inhomogeneity (ies) of volume 1 x 2 x 2 cm 3 was simulated at 1 cm distance from center of active center of source and the source was simulated at center of water phantom, as illustrated in [Figure - 2] For the study of effect of source position in the said water phantom, the source was modeled at 1 cm distance from the surface of the water phantom, as illustrated in [Figure - 3]. The air kerma strength needed to calculate dose or energy deposited was determined in a separate simulation of 10 8 histories. For this, the said source position was modeled at the center of an air volume 4 x 4 x 4 m 3 with composition and density of air recommended in TG43U1 [4] with 40% relative humidity. It was calculated at 0 cm to 150 cm using cylindrical voxels/cells of 1 cm thick and 1 cm high. These scoring voxels/cells assure volume averaging artifacts < 0.1% for distances greater than 5 mm from the source. [12] Result and Discussion For the validation of source geometry, the deposited energy was determined using 10 9 histories in EGSnrc simulation, yielding a statistical uncertainty of dose distribution of 0.2% near the source and 0.5% for distances greater than 4 cm, as the modeled source core is not a line, but a cylinder. The line source approximation of the geometry function G L (r,q) cannot correctly reproduce pure geometrical variations of the relative dose distribution close to the source. Gamma analysis was performed for the resulting dose distribution by using EGSnrc divided with G L (r,q) to remove the strong influence of the geometry function. To estimate the uncertainty due to variation of the geometry from one source to another in the manufacturing process, the worst possible situation of first thinner core and thickest rest of capsule and second thickest core and thinner rest of capsule are MC simulated, which shows that 0.5% variation is to be considered compared to the case of normal dimension. The cross section uncertainty of the EPDL 97 library here is considered to be 0.5%. [10] 10 8 histories are traced here to perform the simulation for evaluation of the effects of inhomogeneities and position of source in water phantom on dose distribution. The energy scored was taken to be in cuboidal 2 x 2 x 2 cm 3 scoring voxels, as very small voxels increase the uncertainty; the rotational symmetry around the source axis is discontinued by inclusion of dry air and cortical bone inhomogeneities and by placing the source very near to the surface of water phantom. In [Table - 1] and [Figure - 4a and 4b], the data and graph of percentage relative difference between dose in presence of inhomogeneity and dose in absence of inhomogeneity vs. distance from the source at its transverse axis of air and bone respectively are presented. Decreased attenuation by air due to its less density increases the dose by 5.5 to 6.5% behind air inhomogeneity. However, increased attenuation by cortical bone due to its high density decreases the dose by 4.5 to 5% behind cortical bone inhomogeneity. These results were found in good agreement with literature data. [13] Although the air and bone have more or less same number of electrons per gram but density and atomic number of the air is very lower than bone, therefore the degree of decreased attenuation by air may be higher than degree of increased attenuation by bone. By placing the source close to the surface of water phantom, a lack of scattering photons may result in a significant drop of dose due to absence of backscattering material. The data and graph between the ratio of the dose when the source is at 1 cm distance from the surface of water phantom to the dose when the source is at centre of said water phantom vs. distance from the source at its transverse axis are illustrated in [Table - 2] and [Figure - 5] respectively. As the primary dose may overlap missing scatter function for near points from the source, therefore the near points between 1 to 2 cm. from the source undergoes 2 to 3.5% underdose than the far points between 3 to more distant points, which may underdose between 4 to 16%. These results were found in good agreement with literature data. [13] References
Copyright 2010 - Journal of Cancer Research and Therapeutics The following images related to this document are available:Photo images[cr10012f1.jpg] [cr10012f5.jpg] [cr10012f2.jpg] [cr10012f4b.jpg] [cr10012t2.jpg] [cr10012f3.jpg] [cr10012f4a.jpg] [cr10012t1.jpg] |
| |||||||||
