 |
| About Bioline | All Journals | Testimonials | Membership | News |
|
||||||
|
||||||
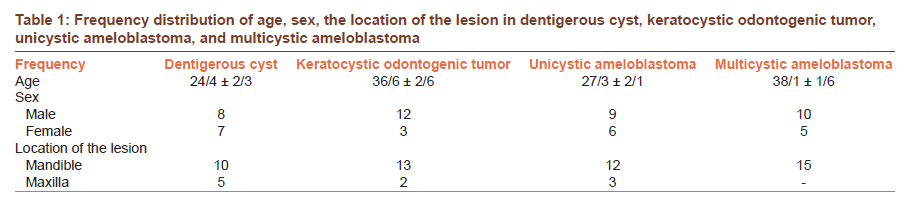
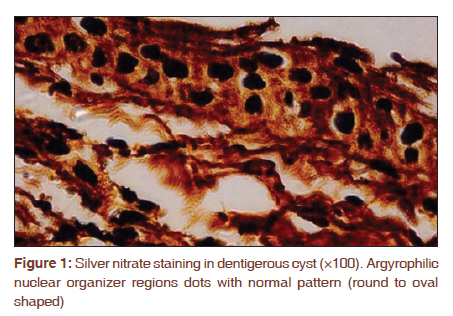
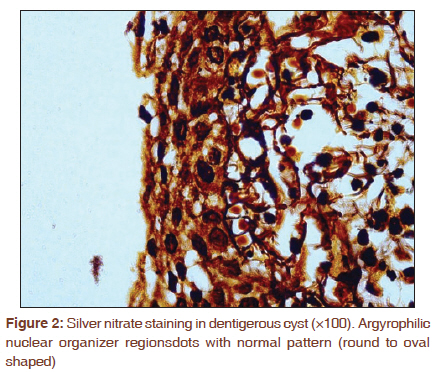
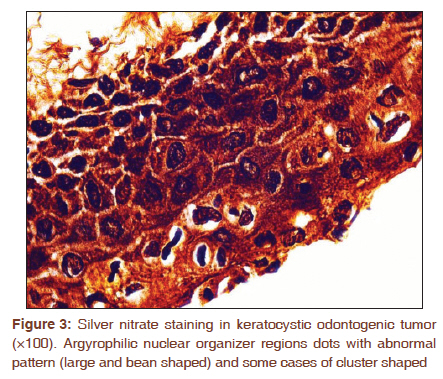
Journal of Cancer Research and Therapeutics, Vol. 7, No. 3, July-September, 2011, pp. 280-285 Original Article Quantitative and qualitative analysis of argyrophilic nuclear organizer regions in follicular cyst, keratocystic odontogenic tumor and ameloblastoma Safora Seifi1, Ensieh Shafigh2, Ayoub Allaie3 1 Department of Oral and Maxillofacial Pathology, School of Dentistry, Babol University of Medical Sciences, Babol, Iran PMID: 22044808 DOI: 10.4103/0973-1482.87017 Aim: The purpose of the study was to evaluate the proliferation index nuclear organizer regions (NORs) and their distribution among the four odontogenic lesions with known different clinical invasive behavior. Study and Design: In a descriptive-analytical cross-sectional study, 60 paraffin blocks of odontogenic lesions were prepared for silver nitrate staining. Materials and Methods: For the quantitative analysis, 100 cells were counted at ×100 and the mean value was calculated. The morphometric analysis of NORs showed that they can be distributed into normal (round to oval-shaped) and abnormal (large, bean-shaped and cluster-shaped) groups. One-way analysis of variance (ANOVA) and multiple comparison with Tukey test were used for the statistical analysis of the results. Results: The argyrophilic NOR (AgNOR) numbers in multicystic ameloblastoma, unicystic ameloblastoma, KCOT, and follicular cyst were 7.4 ± 2.7, 6.1 ± 2.56, 4.7 ± 1.84, and 2.82 ± 1.052, respectively. The difference between ameloblastoma (unicystic and multicystic types) and either_KCOT, or follicular cyst was statistically significant (P<0.001) and, (P=0.001), respectively. In follicular cysts, normal AgNOR dots were not detected outside the nuclei. NOR histological patterns of KCOT were large, bean shaped and rarely cluster shaped and it was cluster-shaped in multicystic and unicystic ameloblastoma. Conclusion: The current study suggests that determination of clinical behavior of ameloblastoma in comparison with KCOT and follicular cyst in silver nitrate staining is related to higher proliferation activity and different NORs' distribution pattern. However, further clinical follow-up studies must be performed to prove this. Keywords: Ameloblastoma, argyrophilic nuclear organizer region, follicular cyst, keratocystic odontogenic tumor
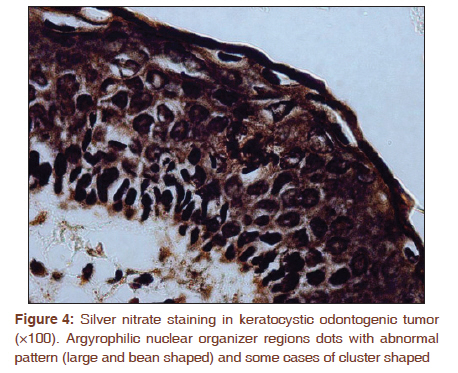
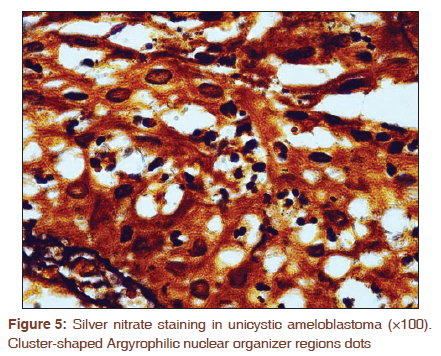
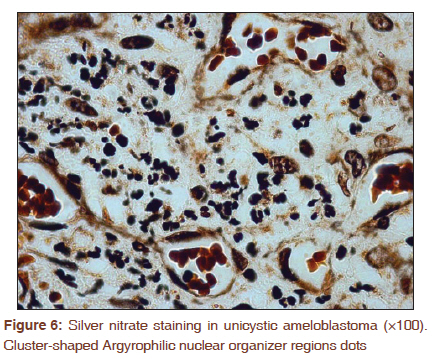
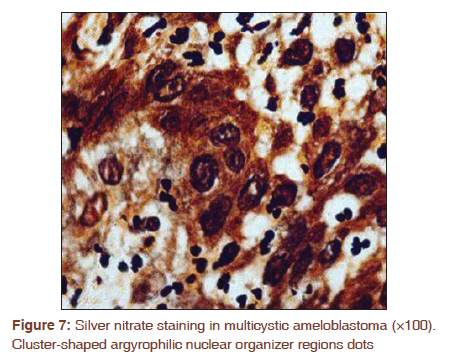
Introduction Multicystic ameloblastoma is a locally benign invasive odontogenic tumor that has a more aggressive behavior than unicystic ameloblastoma, keratocystic odontogenic tumor (KCOT) and follicular cyst. [1] Silver nitrate staining is a simple, inexpensive, repeatable, one-step technique used in the diagnosis of oral lesions. [2],[3] Some studies have confirmed the usefulness of silver nitrate in reflecting the aggressive behavior of odontogenic lesions. [4],[5],[6] while some others did not confirm the same results. [7] Based on the conflicting results and variations in aggressive behavior of the four mentioned odontogenic lesions, the current study aimed at evaluation of cellular proliferation rate and nuclear organizer regions′ (NORs′) distribution pattern in the above mentioned odontogenic lesions. Materials and Methods The study was approved by our local ethics committee. In this descriptive analytical cross-sectional study, first the medical records of patients that existed in the laboratory of oral and maxillofacial pathology in the School of Dentistry were reviewed. Sample volume was selected from archive files of School of Dentistry. The samples diagnosed with follicular cyst, KCOT, unicystic ameloblastoma, and multicystic ameloblastoma were considered. Clinical information including age, sex, and the location of the lesion was extracted from them patients′ records. To confirm the diagnosis, firstly 4 mm sections were prepared and were stained using hematoxylin eosin staining protocol, which were then confirmed by an oral pathologist. This was followed by preparation of 4-5 mm sections each paraffin block and these were stained using silver nitrate staining. The sections were deparaffinized in xylene and dehydrated in graded alcohol series followed by silver nitrate staining method in accordance with the Ploton protocol. [8] The final samples were produced by mixing 2 g of gelatin in 100 ml of 1% formic acid with two parts of 50% silver nitrate solution in distilled water. The slides were first placed in a Petri dish. Using a pipette, three to four drops of solution were poured on the surface and the Petri dish was then covered by a glass cap. These samples were incubated at 45°C for 30 minutes in the dark. The glass cap was then gently removed and the slides were washed in distilled water. The slides were then dehydrated by xylene, cleared and mounted in synthetic medium. Five cases of OSCC were considered as a control group. Qualitative [9] and quantitative evaluations were performed in a standard manner as described by Crocker. [10] In the quantitative method, counting of each block was performed using conventional light microscopy with oil immersion, at ×100 magnification, assessing the nuclei of 100 cells. In all the slides, cells with one or more AgNOR dots were counted. Those that were joined together were counted as a single dot. The mean of AgNOR dots in 100 cells per slide in five microscopic fields was calculated. The results were presented as mean and standard deviation (Mean ± SD). From a qualitative viewpoint, the AgNOR dots were divided into normal (round to oval-shaped) and abnormal (large, bean-shaped and cluster-shaped) groups. One-way analysis of variance (ANOVA) and multiple comparisons with Tukey′s test were used for the statistical analysis of the results. The statistical significance level set at 0.05. Results Demographic results have been summarized in [Table - 1]. AgNOR dots in quantitative analysis of follicular cyst, KCOT, ameloblastoma, and multicystic ameloblastoma were 2.82 ± 1.05, 4.7 ± 1.84, 6.1 ± 2.56, and 7.4 ± 2.72, respectively [Figure - 1], [Figure - 2], [Figure - 3] and [Figure - 4]. Significant statistical difference in the expression of NORs was seen between multicystic ameloblastoma and unicystic ameloblastoma (P=0.001).The difference between multicystic ameloblastoma and either follicular cyst or KCOT was statistically significant (P<0.001), and (P=0.001), respectively. The difference in the expression of NORs between unicystic ameloblastoma and either KCOT or follicular cyst was significant (P=0.001), and (P<0.001), respectively. The number of NOR dots in KCOT was more than those in follicular cyst (P=0.003). The total number of NOR dots in the basal layer of follicular cyst and in parabasal layer were 1.6 ± 0.33 and, 1.2 ± 0.72, respectively. The expression of NOR dots in basal and parabasal layers was significantly different (P<0.05). The number of NOR dots in basal and parabasal layers of KCOT were 1.1 ± 0.68 and 2.6 ± 1.16, respectively. AgNORs revealed significantly higher mean counts in parabasal layer when compared with those of basal layer (P<0.05). Qualitative assessment of silver nitrate staining in the above mentioned odontogenic lesions showed round to oval-shaped AgNOR dots mostly within the nucleus of follicular cysts. AgNOR dots in KCOT had abnormal shapes (large, bean shaped and cluster shaped). Large shapes were mostly observed within basal and parabasal layers. Bean and cluster-shaped ones, however, were mostly observed in parabasal layer. AgNOR dots outside the nucleus were observed within parabasal layer. KCOTs rarely had cluster-shaped pattern. In unicystic ameloblastoma and multicystic ameloblastoma, AgNOR small-sized dots were observed inside and outside of the nucleus (mostly outside), with an irregular cluster-shaped distribution. The NORs′ pattern in follicular cyst was different from that in KCOT and ameloblastoma (unicystic and multicystic variant) [Figure - 5], [Figure - 6] and [Figure - 7]. Discussion The results indicated the differences in the number and distribution of NOR dots between follicular cyst, KCOT and ameloblastoma. Cell cycle includes the four stages of G1, S, G2, and M. The cell is under the control of promoters in each phase of transition. The more active is the cell proliferation, the faster the cell cycle becomes which in turn leads to an increase in the probability of mistakes during cell division. At the same time, an increase in the amount of cellular metabolic activity happens. [11] When the speed of the cell cycle increases, NOR dots are mostly observed in large numbers outside the nucleus. In this study, the number of AgNOR dots in follicular cyst was less than in KCOT. The AgNOR dots in follicular cyst were round to oval shaped and rarely could be seen outside the nuclear area. Also, their number in basal layer was more than in the parabasal layer. Eslami et al., reported the number of NOR dots in dentigerous cyst and odontogenic keratocyst as 1.49 ± 0.51 and 1.68 ± 0.47, respectively. However, they did not report any significant difference in the number of AgNOR dots between the two cysts. [12] On the other hand, Coleman et al., reported a higher number of AgNOR dots in dentigerous cyst in comparison to radicular cyst. [13] Higher number of AgNOR dots in basal layer of follicular cyst is an expression of a normal cell cycle, while in KCOT with higher recurrence and aggressive behavior, the number of AgNOR dots was higher in the parabasal layer. Our results are in agreement with the immunohistochemical studies on cell proliferation markers such as Ki67 and PCNA in odontogenic keratocyst. [8] The results also show that keratocyst does not follow a normal cell cycle, but Eslami et al., reported a higher number of AgNOR dots in the basal layer than the in the parabasal layer. [12] In KCOT, abnormal forms of AgNOR dots like large ones, bean-shaped ones and sometimes cluster-shaped ones were observed. Most AgNOR dots in the basal layer were round, while in the parabasal layer they were mostly bean-shaped or sometimes cluster shaped. Due to simplicity and repeatable characteristics, most studies on silver nitrate staining were quantitative. [13],[14],[15],[16] However, we also performed a qualitative study on odontogenic lesions stained by silver nitrate. Increased number of AgNOR dots and changes in the pattern of their distribution in KCOT in comparison to follicular cyst indicate that not only the number of the AgNOR dots but also their distribution pattern is correlated to the aggressive behavior of KCOT. Previous studies mostly used silver nitrate staining in the diagnosis of malignant lesions. [17],[18] Although there is still some controversy over the subject, it seems that the number of AgNOR dots does not merely represent malignancy or proliferation rate of the cell. Eslami et al., mentioned about the counting of AgNOR dots to identify odontogenic lesions such as ameloblastoma, unicystic ameloblastoma, keratocyst and dentigerous cyst. [12] Some other studies did not prove the usefulness of silver nitrate stain in the diagnosis of odontogenic lesions. [19],[20] It seems that there are limitations of counting of NOR in the diagnosis of odontogenic lesions because most of them can be diagnosed with hematoxylin-eosin stain. If the sample case is hard to be diagnosed, the pathologist will prepare several sections to diagnose the lesion type. In the present study, the number of AgNOR dots in multicystic ameloblastoma was found to be higher than those in unicystic ameloblastoma, but NORs pattern was similar in the two odontogenic tumors. Therefore, multicystic ameloblastomas have more aggressive behavior than unicystic ameloblastomas. Santos et al., reported a significant difference in the number of AgNOR dots counted between ameloblastoma and unicystic ameloblastoma in their study on mural samples. They, however, did not report a significant difference in luminal and intraluminal samples. [19] While comparing multicystic ameloblastoma with follicular cyst and KCOT, the speed of the cell cycle, proliferation activity, and metabolic activity of the cell were found to be higher in multicystic ameloblastoma. The difference in the number of the NOR dots as well as their arrangement in odontogenic lesions observed in this study reflects the differences in their biological behavior. In unicystic ameloblastoma and multicystic ameloblastoma, the AgNOR dots distribution was abnormal, and they were cluster shaped, irregular, and relatively small and round. Most previous studies used the silver nitrate staining in differentiating malignant tumors from benign ones for breast, [21] salivary glands, [22] squamous cell carcinoma, and also to diagnose the pre-malignant pseudoepitheliomatous hyperplasia, [4] benign and malignant tumors of the central nervous system, [23] and lymphoma. [24] Some other studies did not prove the diagnostic value of silver nitrate staining for determination of malignancy in stromal tumors of the stomach and small intestine, [25] and some researchers reported that the staining lacked a diagnostic value for adenocarcinoma of the uterine cervix. [26] Silver nitrate staining was used by some researchers in the differentiation of the grade of the lesions, recurrence probability and even for predicting the aggressive behavior. [6] It should also be mentioned that most oral pathological studies have been done on squamous cell carcinoma [4] and tumors of the salivary glands [22] and there are a few studies done on odontogenic lesions. Do carmo et al., reported that the application of silver nitrate staining was not correlated with distinct aggressive behavior of ameloblastoma in comparison to adenomatoid odontogenic tumors. [7] In their study on odontogenic myxoma and ameloblastic fibroma cases subjected to comparative analysis by the AgNOR technique, Martins et al., reported a higher proliferative index for ameloblastic fibroma. [13] In a study conducted in 2010 by Carnelio et al., the number of NOR dots in ameloblastoma and ameloblastic fibroma in relation to aggressive behavior was examined. They concluded that the higher number of AgNOR dots in ameloblastoma compared with ameloblastic fibroma revealed that ameloblastomas are more aggressive when compared with ameloblastic fibromas. [14] In 2009, Santos et al., also reported that the number of AgNOR dots in ameloblastoma, mural unicystic ameloblastoma, and dentigerous cyst corroborated the pattern of higher aggressive clinical behavior of these tumor variants. [19] Differences in methodology, incubation time of the paraffin blocks, initial fixation time of the blocks, lack of standard criteria for evaluation of silver nitrate staining, eye-piece graticule or not equipped light microscopes used for interpretation of the results, sample size, the duration of silver nitrate staining, the counting methods (some studies counted several attached points as one), and the NORs′ analysis of odontogenic lesions (some merely studied the basal layer and some others studied all the epithelial layers) are among the factors affecting the reported results by the articles in English language. Silver nitrate staining results in most studies were interpreted quantitatively. [12],[14] Some performed a quantitative study [10] and some others performed both. [27] All the studies on odontogenic lesions performed a quantitative study of AgNORs′ staining. The quantitative results of this study along with its quantitative analysis confirmed the usefulness of AgNORs′ staining in reflecting the aggressive behavior of ameloblastoma in comparison to unicystic ameloblastoma. In studies with the application of special stains in immunohistochemical and silver nitrate staining, less attention has been paid to cell and nucleoli distribution, and perhaps, it was assumed to be random. However, it seems that cell and nucleoli distribution pattern and their quantity change during the neoplastic process. Also, when the epithelial cells become neoplastic, their proliferation and protein synthesis speed increases and they divide to form a special pattern together. [6] Although based on the controversies over the application of silver nitrate staining it is still not used as a comprehensive unique method, it can be a useful method for aiding the quantitative and qualitative diagnosis of the results along with hematoxylineosin staining. It seems that the different observed patterns of NORs in odontogenic lesions depend on the stage of the cell cycle, and even if the cells are in the same stage, let ′us say metaphase, they may still be different in the ribosomal genes they carry. [28] It is possible that the increase in the synthesis of new AgNORs proteins, unbalanced synthesis, new AgNORs proteins, and unbalanced synthesis of AgNORs proteins in odontogenic tumors affect the NORs′ pattern. [29] The current study results suggest that not only an increase in the number of AgNOR dots happens, but also there are some changes in their distribution pattern in ameloblastoma in comparison to KCOT and dentigerous cyst, which reflects a higher proliferation rate and a more aggressive behavior. In summary, quantitative and qualitative evaluation of silver nitrate staining in ameloblastoma reflects its more aggressive behavior in comparison to KCOT and follicular cyst, respectively. However, further clinical studies must be performed to prove the AgNORs value in confirming the invasive behavior of the above mentioned odontogenic lesions. References
Copyright 2011 - Journal of Cancer Research and Therapeutics The following images related to this document are available:Photo images[cr11072f3.jpg] [cr11072f1.jpg] [cr11072f2.jpg] [cr11072f7.jpg] [cr11072t1.jpg] [cr11072f4.jpg] [cr11072f5.jpg] [cr11072f6.jpg] |
| |||||||||

