 |
| About Bioline | All Journals | Testimonials | Membership | News |
|
||||||
|
||||||
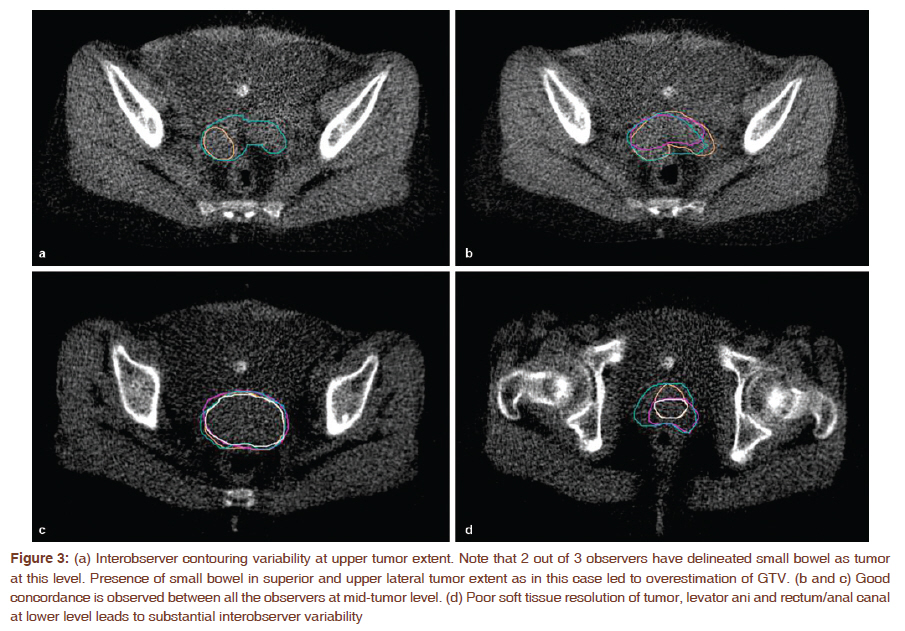
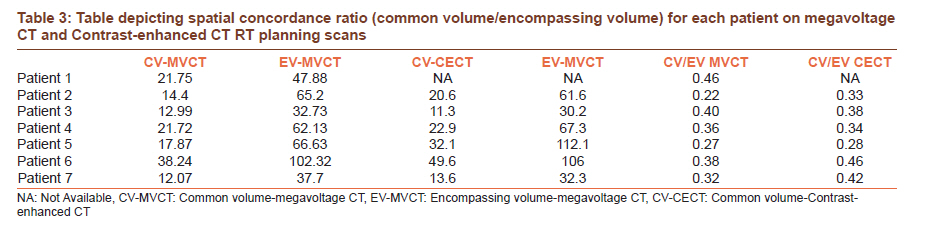
Journal of Cancer Research and Therapeutics, Vol. 7, No. 3, July-September, 2011, pp. 292-297 Original Article Inter and intraobserver variation in gross tumor delineation on megavoltage CT images in patients undergoing tomotherapy-based image-guided radiotherapy for postoperative vault recurrences Mahesh Upasani1, Supriya Chopra2, Reena Engineer1, Seema Medhi3, Zubin Master2, Umesh Mahantshetty1, Shyam Kishore Shrivastava1 1 Department of Radiation Oncology and Medical Physics, Tata Memorial Hospital, Mumbai, India PMID: 22044810 DOI: 10.4103/0973-1482.87022 Materials and Methods: Three observers delineated GTV on MVCT and CECT and two observers recontoured on MVCT images. Tumor volumes were calculated and correlated using Spearman correlation. The standard deviation of centre of mass was averaged on per patient basis. The ratio of common volume and encompassing volume was used to determine intra and interobserver spatial concordance. Lack of difference in spatial concordance ratio between MVCT and CECT images was used as an index of usability of MVCT images. Results: Thirty six datasets were available for seven patients. High intraobserver GTV correlation was recorded for observer 1 and 2 (r = 0.93 and r = 0.98; P=0.03 and 0.0001). The average intraobserver spatial concordance ratio was 0.57 and 0.62 respectively. The mean GTV of observers 1, 2 and 3 were 31.6 (18.7-52.2); 28.2 (16.7-51.8) and 46.3 cc (29.1-90.5) respectively. Average standard deviation of centre of mass of all observers was less than 5 mm in either direction. Largest interobserver discordance was observed in anterior, inferior and lateral direction. The interobserver spatial concordance of GTV on MVCT and CECT images was 0.34 and 0.36 (P=0.24) respectively. Conclusion: Moderate to good inter and intraobserver GTV correlation was observed on MVCT images, however, was associated with low interobserver spatial concordance on both MVCT and CECT images. Strategies to improve contouring reproducibility on MVCT and KVCT images are desirable. Keywords: Cervix, gross tumor volume, interobserver, intraobserver, megavoltage CT, tomotherapy
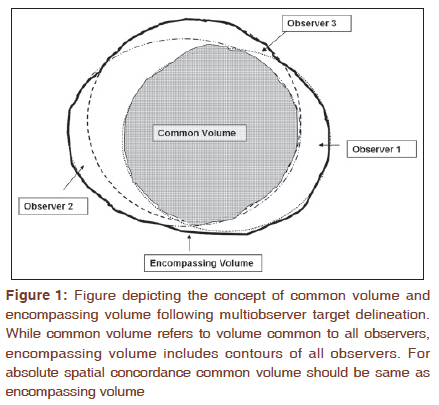
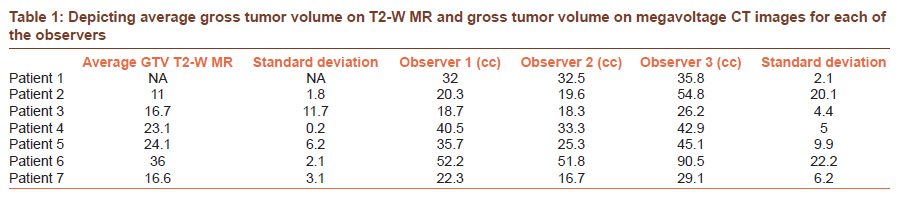
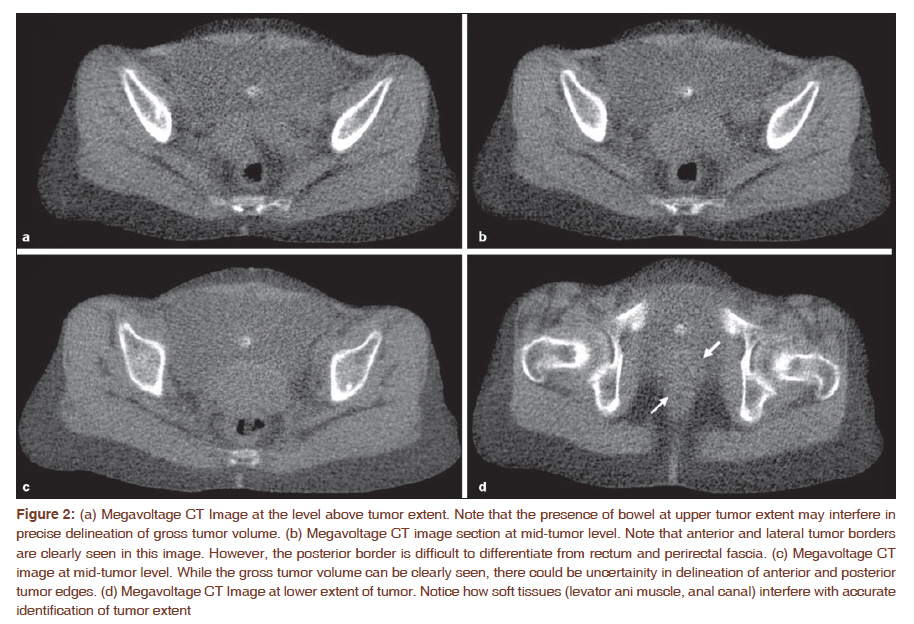
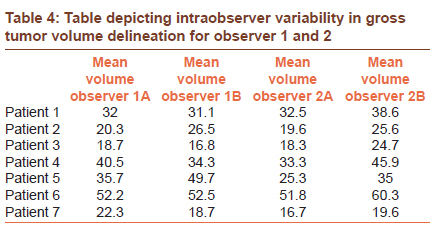
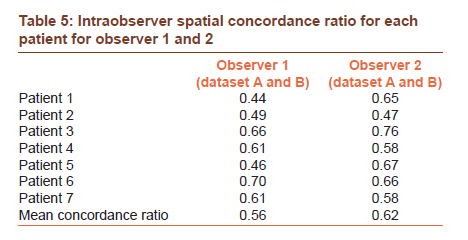
Introduction Prospective studies have demonstrated reduction in acute toxicity with integration of intensity-modulated radiotherapy (IMRT) for gynecological cancers. [1],[2],[3] However, the success of IMRT in gynecological cancers hinges on precise visual identification of gross tumor volume (GTV) and various organs at risk (OAR). Tomotherapy-based image-guided radiotherapy (IGRT) facilitates pretreatment volumetric image guidance, [4] high precision treatment delivery and adaptive remodeling of target volumes. However, low soft tissue contrast of megavoltage CT (MVCT) images, edge blurring at bladder, rectal and parametrial interface, [5],[6] adherent bowel loops (in postoperative patients) introduce uncertainties in GTV identification and edge delineation. While various studies focus on motion evaluation and adaptive remodeling of planned target volumes (PTV) for gynecological cancers [7],[8] it′s imperative to characterize the accuracy and reproducibility of GTV identification on MVCT images. The present study was designed to evaluate inter and intraobserver variation in GTV delineation on MVCT images in cohort of patients undergoing IGRT for postoperative recurrent vault cancers. Materials and Methods From November 2009 to August 2010, patients undergoing IGRT for postoperative vault recurrences (www.clinicaltrials.gov NCT01117402) [9] were included. All underwent CT and MR simulation. Patients were instructed to empty bowel and bladder and then consume 500 ml of water. Imaging for treatment planning was performed after 30 minutes of water consumption. Subsequently patients were positioned supine with knee rest and arms above the head. Contrast-enhanced CT (CECT) and T2-W MR images were obtained at an interslice interval of 3 mm and transferred to Focalsim workstation (Version 4.3.3) for contouring. No oral contrast was used. Treatment planning was done on tomotherapy Hi-ART treatment planning system (Tomotherapy Inc., Madison, WI). All patients were scheduled to receive 50 Gy/25 fractions to the PTV over 5 weeks along with concomitant weekly cisplatin (40 mg/m 2 ) and pelvic interstitial brachytherapy to a total dose of 20 Gy/5 fractions/3 days. Patients were instructed to follow an empty bowel and full bladder regimen as at the time of the planning scan. A daily pretreatment MVCT was performed to correct for setup errors and organ motion. The imaged volume extended from L4 to the lower extent of the pelvis such that the entire PTV was scanned, with some additional margins. The ′normal′ setting (4-mm slice thickness) was used for MVCT scanning. Automated registration of the planning KVCT and daily MVCT images was performed using bony match. When required, the registration was further manually adjusted by the treating radiation oncologist to ensure that the visible residual tumor was adequately covered by the PTV. All translations and rotations were recorded but only translational shifts and roll were applied to the patient′s treatment position prior to treatment execution. The pitch and yaw rotations in patient setup were recorded but not applied. The treatment was delivered and a post-treatment MVCT scan was also performed. Post-treatment-registered MVCT images from fraction 1 to 7 were transferred to the Focalsim workstation. Three radiation oncologists (MU, SC and RE) contoured GTV on MVCT image sets. All observers were instructed to select the most appropriate window and level setting prior to contouring and were blinded to each other′s contours. The GTV′s thus obtained were used for evaluating interobserver contouring variability. In addition GTV was also delineated on radiotherapy planning CECT′s and T2-W MR images by three different observers. Two observers (MU, SC) also recontoured MVCT image datasets while blinded to their own and each other′s contours. This provided datasets for evaluation intraobserver variability. The volumes of GTV were recorded for each of the observer on MVCT, CECT and T2-W MR RT planning scan. The correlation of MVCT-GTV of each of the observers was calculated by Spearman rank correlation. Correlation coefficient of more than 0.70 was considered to signify good concordance and that between 0.50 and 0.70 as moderate concordance. In addition common and encompassing volumes were recorded for MVCT and CECT datasets. The common volume (CV) was defined as the "common volume contoured by all observers" and encompassing volume (EV) was the "combined volume by all observers". [10],[11] The concept of CV and EV is depicted in [Figure - 1]. Spatial concordance of GTV among multiple observers was calculated as ratio of CV: EV. This ratio is indicative of the spatial uncertainty in delineating the target in a given image set and may provide a more reliable and objective way of comparing spatial characteristics of contoured GTV. In ideal conditions CV should approximate EV such that the resultant ratio is 1. In the present study, lack of statistical difference in CV/EV ratio between MVCT and CECT images was deemed necessary to determine usability of MVCT images for soft tissue matching. The quantitative difference in delineating each of the tumor edges was described by mean of maximum difference in the contoured edges between all observers. While anterior, posterior and mediolateral variation was measured using inbuilt scale, the superoinferior differences were inferred by calculating difference in number of slices with GTV. Using this methodology while anteroposterior and mediolateral discrepancies could be described within sub-millimeter accuracy, the lower limit of detecting superoinferior variation was equivalent to slice thickness (i.e., 4 mm). All measurements were done on each of the MVCT image sets; however, the data was summarized on per patient basis. For evaluation of intraobserver contouring reproducibility, two observers delineated GTV on MVCT data sets 3 months after primary contouring. Each observer was blinded to their own contours and to that of the other observer. Average GTV was calculated on per patient basis. Intraobserver correlation of GTV was determined using spearman rank correlation. Intraobserver spatial concordance was calculated as CV: EV ratio. Results A total of 108 contour datasets were available (36 images from seven patients, each with GTV contours by three observers). None of the images had artifacts that limited structure visibility and MVCT image quality of these datasets was considered acceptable by all three observers. All observers used window and level between 600/40 and 140 for purpose of contouring. The GTV on T2-W MR and MVCT is depicted in [Table - 1]. The interobserver correlation statistic for GTV on MVCT images were as follows: Obs. 1 vs obs. 2 r = 0.87, P=0.01; obs. 1 vs obs. 3: r = 0.60, P=0.14; obs. 2 vs obs. 3: 0.64, P=0.11. This signified good concordance (r > 0.70) in volumes between observer 1 and 2; however, only modest concordance was noted with observer 3 (r < 0.70). Overall we observed large interobserver discordance in contoured GTV along anterior, inferior and lateral tumor edges. High lateral variability was often observed at the cranial end due to misinterpretation of bowel loops as GTV and at caudal end due to indistinct soft tissue boundaries with levator ani [Figure - 2] and [Figure - 3]. Superolateral and inferior discrepancies were observed to be higher in GTV delineated by observer 3. Centre of mass of GTV was averaged on per patient basis for all observers. The standard deviation of center of mass along anteroposterior, mediolateral and superoinferior direction and spatial concordance ratio is depicted in [Table - 2] and [Table - 3] respectively. Although we observed low spatial concordance for both MVCT and CECT, the ratio was no different between MVCT and CECT (Wilcoxon′s test P=0.24). This confirms the usability of MVCT images for soft tissue identification with reliability that is no different than CECT images. We also observed high intraobserver correlation for GTV delineation. The Spearman coefficient was 0.93 (P=0.03) and 0.98 (P=0.0001) for observer 1 and 2, respectively [Table - 4]. The spatial concordance was also observed to be higher (0.56 and 0.62 for observer 1 and 2, respectively) [Table - 5]. Discussion MVCT-based IGRT provides inferior soft tissue contrast than kilovoltage CECT images [12] and could possibly impact accurate identification of GTV, hence precluding precise implementation of adaptive radiotherapy strategies. [5] Before embarking on adaptive image guidance strategies for patients with postoperative recurrences we sought to evaluate reproducibility of GTV identification in tomotherapy-acquired MVCT images. The study design assumed that no or minimal change would occur in volume of GTV during the first few fractions of radiotherapy, hence images from the first seven fractions were used for the purpose of the study. Changes in tumor volume, if any, were presumed to equally impact the contoured volume of each of the observers. While we observed statistically significant correlation between delineated GTV of observer 1 and 2 [Table - 1], only moderate correlation was observed with observer 3. The lack of correlation of observer 1 and 2 with observer 3 could be attributed to overcontouring in supero-inferior direction by observer 3 wherein bowel loops and levator ani muscle were contoured as GTV. Pictorial example of this is shown for patient no: 6 in [Figure - 3]a. In the present study standard deviation of centre of mass among different observers varied between 2.1 and 4.7 mm [Table - 3]. This is higher than that observed for multiple observers contouring on CBCT images in patients with intact uterus (1.5-3.4 mm) [4] or those undergoing IGRT for prostate cancer. [13] Highest standard deviation was observed in defining anterior and lateral border of GTV. This is concordant with observations in patients with intact uterus. [4] We also observed that intraobserver agreement was higher than interobserver agreement. Similar trend has been observed in other studies comparing intraobserver and interobserver performance. [4] Although we observed high correlation of absolute volumes on interobserver comparison, this did not translate into high spatial concordance for contoured volumes. While utilizing CV:EV ratio as an objective metric we observed low interobserver spatial concordance on both MVCT images (0.34) and CECT scans (0.36). Moderate spatial concordance of 0.42-0.45 has been observed for prostate contouring on CBCT images. [11] However, this increased to 0.60-0.67 on diagnostic quality images. [10] Spatial concordance of 0.78 and 0.85 has been observed for inter and intraobserver contouring in women with intact uterus. [4] Low spatial concordance observed in both CECT and MVCT images within our study demonstrates the need for strategies to improve visualization of GTV on both CECT and MVCT images. As seen in [Figure - 3]a-d highest interobserver discordance stems from inaccurate categorization of low lying small bowel loops as GTV and in identifying inferior tumor extent. Dietary measures have been proposed to improve image quality and reduce contouring interference due to small bowel on CBCT images. [14] In our study though patients were instructed to empty bowel prior to treatment, no specific dietary measures were followed. Other strategies involve using diluted small bowel oral contrast prior to each treatment. Preclinical studies evaluating liposomal contrast agents demonstrate higher intratumoral half life. [15] Clinical use of these contrast agents may allow improved spatial consistency in GTV visualization on CBCT and MVCT images in future. As shown in [Figure - 3]d delineation of inferior tumor extent is associated with significant variations. Use of intratumoral markers at all tumor edges may improve GTV identification at this level. The results of our study also have implications for IGRT execution in patients with postoperative vault recurrences. We observed higher spatial concordance for intraobserver rather than interobserver contouring. We recommend that IGRT should be executed by the same dedicated technologist for all fractions. Conclusions Moderate to good inter and intraobserver volume correlation was observed on MVCT images. However, low interobserver spatial concordance was observed on both MVCT and CECT images. Lack of spatial concordance necessitates strategies to improve interobserver contouring reproducibility on both MVCT and CECT images. Our data cautions against use of adaptive radiotherapy on the basis of multiobserver structure identification. Higher intraobserver spatial and volumetric concordance as observed in our study suggests a role for dedicated therapist for IGRT implementation for gynecological cancers. References
Copyright 2011 - Journal of Cancer Research and Therapeutics The following images related to this document are available:Photo images[cr11074f1.jpg] [cr11074t3.jpg] [cr11074t2.jpg] [cr11074f3.jpg] [cr11074f2.jpg] [cr11074t4.jpg] [cr11074t1.jpg] [cr11074t5.jpg] |
| |||||||||
