 |
| About Bioline | All Journals | Testimonials | Membership | News |
|
||||||
|
||||||
Journal of Cancer Research and Therapeutics, Vol. 7, No. 3, July-September, 2011, pp. 308-313 Original Article Estimation of inhomogenity correction factors for a Co-60 beam using Monte Carlo simulation RD Praveenkumar1, KP Santhosh2, A Augustine2 1 Department of Radiotherapy, Government Medical College, Calicut; School of Pure and Applied Physics, Kannur University, Payyanur Campus, Payyanur, Kerala, India PMID: 22044813 DOI: 10.4103/0973-1482.87030 Materials and Methods: The Monte Carlo simulation code of EGSnrc is used for the depth dose calculations. Two clinical like situations were simulated-dose calculation point beyond the lung tissue volume and dose calculation point within the lung tissue volume. The variation of ICF with lung thicknesses and positions was studied. ICF values were obtained for the similar situations from a commercially available treatment planning system, Theraplan Plus. Results: Percentage depth dose data obtained from Monte Carlo simulation is well matching with the published measurement data. ICFs for lung tissue inhomogenity calculated using the Monte Carlo code are in good agreement with Theraplan Plus TPS values for small inhomogenity thicknesses. Conclusion: These results can be used for the verification of TPS calculation or manual treatment time calculation. Keywords: EGSnrc code, inhomogenity correction factor, Monte Carlo simulation, Theraplan Plus TPS
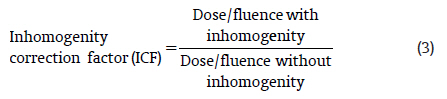
Introduction Dosimetric accuracy is a critical factor in radiation treatment of cancer patients. Generally, the dosimetric parameters required for radiation therapy are measured in a homogeneous water phantom where the density is similar to that of muscle (density of 1 g/cc). However, when treating a patient, the radiation beam traverses through tissues of different densities such as lung and bone. Due to their densities different from those of muscle, the dose computation is altered. The degree of alteration is dependent on the tissue type, position of the tissue in the path of the radiation beam, and on the energy of the radiation. There are several conventional methods to apply inhomogenity corrections for treatment calculations such as isodose shift method, [1] equivalent tissue air ratio (ETAR) method, [2] Batho-Young power law method, [3] etc. None of these methods predict accurate correction factors in all clinical situations. Some of the studies in this area show how to improve the existing inhomogenity correction methods. Wong and Purdy [4] suggested some modifications in the Batho power law method in an additive form to improve its application. El-Khatib and Battista [5] have shown that replacing TAR values by tissue maximum ratio (TMR) values in the Batho power law method for cobalt-60 will make improvement by nearly 5% in the accuracy of dose calculation within the lung tissue. Woo et al. [6] suggested a new method of primary scatter separation that will improve the dose calculations while using the ETAR method. Stathakis et al. [7] suggested a new inhomogenity correction algorithm for irregular fields of high-energy photon beams based on the Clarkson integration and the 3D beam subtraction method. Most of the previous works includes measurement using equipments such as TLD or semiconductor detectors. There are uncertainties while using such equipments for inhomogenity studies especially in boundaries of two density different media. The Monte Carlo simulation study is found more accurate in such situations. Our study includes the evaluation of inhomogenity correction factor (ICF) values not only for different inhomogenity thicknesses but also for different positions, which was not included in previous studies. Monte Carlo simulation is proved to be an accurate method to evaluate dosimetric parameters in radiotherapy. [8] It can be effectively utilized to simulate the inhomogenity conditions in radiation treatment. The aim of the present study is to estimate the ICFs for lung tissue (density 0.26 g/cc) for telecobalt machines along the central axis of the beam using Monte Carlo simulation. EGSnrc [9] is a general purpose Monte Carlo code used in radiotherapy. Its efficiency to calculate the dosimetric parameter is well tested. [10] Instead of actual measurements with dosimetric equipments in a phantom, a virtual phantom with inhomogenity can be simulated and virtual experiments can be performed using Monte Carlo simulation codes. In the present study, the following two arbitrary situations were simulated:
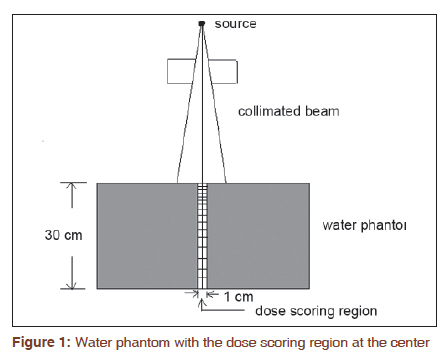
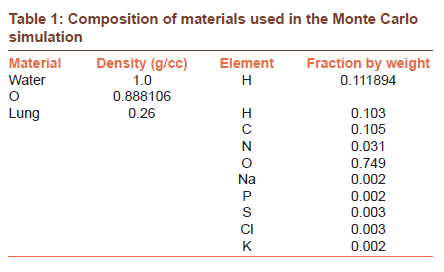
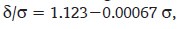
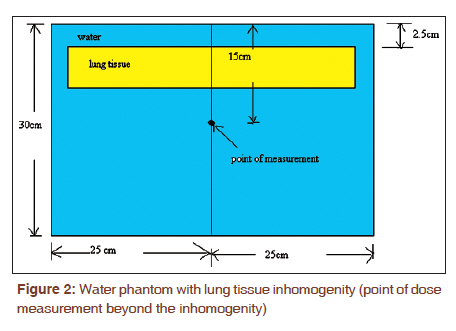
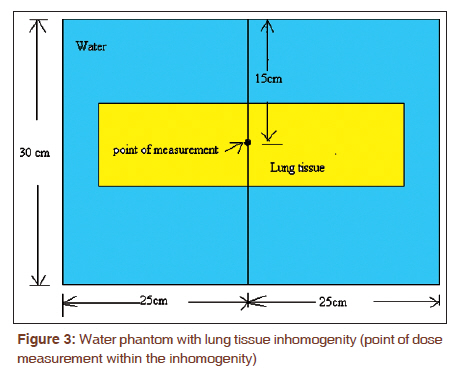
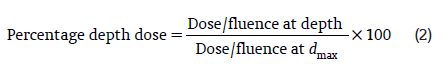
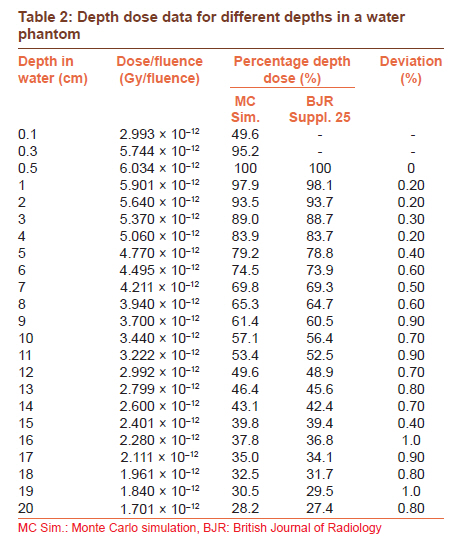
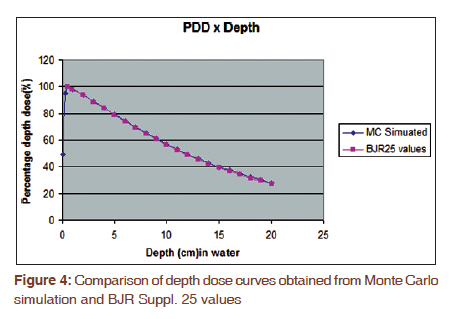
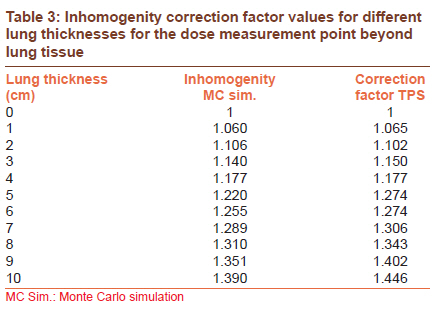
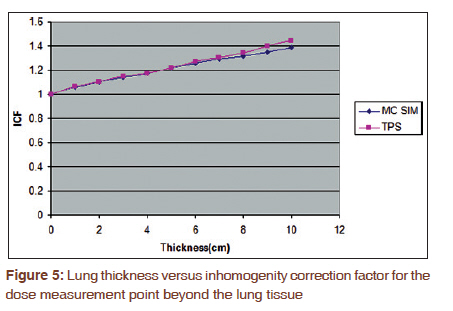
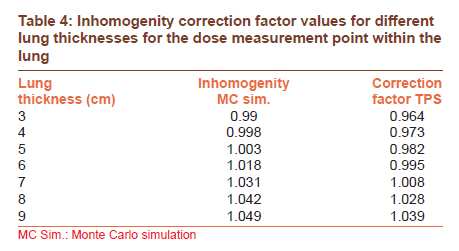
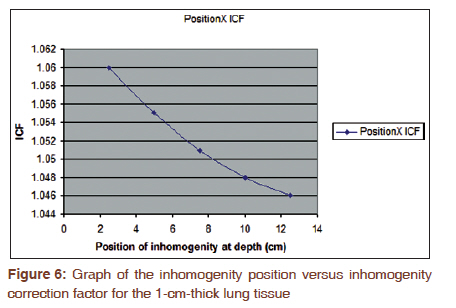
Lung correction factors for each situation were estimated and compared with the values obtained from a commercially available treatment planning system, Theraplan Plus. This treatment planning system is based on the pencil beam algorithm. Materials and Methods In this study, the user code DOSRZnrc [11] of EGSnrc is used for the depth dose calculations. DOSRZnrc is a user code which scores dose in a generalized cylindrical geometry. The DOSRZ code is comparatively simpler and sufficient for the present study. The DOSRZ code supports only a cylindrical/circular geometry; hence, the equivalent circular field for the square field is selected. This approach is used in several Monte Carlo studies. [11] The simulation study has been done in two parts. In the first part, a homogeneous water phantom is used to get the central axis depth doses. In the second part, an inhomogeneous medium (lung tissue) is introduced in the path of the beam to simulate different clinical like situations. The geometry used here to produce the central axis depth dose curves was similar to that suggested by Love et al., [12] consisted of a conical photon beam impinging on a cylindrical water phantom [Figure - 1]. The cylindrical water phantom has a radius R = 28.1 cm, giving an equivalent rectangular cross-sectional area of 50 × 50 cm equivalent to that used in measurements tabulated in the British Journal of Radiology Supplement 25. [13] A smaller concentric cylinder with a radius, r, of 1 cm defines the dose scoring regions. The dose scoring region is composed of water and the material composition is included in [Table - 1]. Dose scoring regions are the regions of interest input by the user in which the Monte Carlo simulation code will calculate the dose from the radiation fluence. The concentric cylinders were divided into 30 slabs to score depth dose data. The first five slabs were 0.2 cm thick to show the detail in the build-up region. These were followed by a 0.5 cm region which enabled the remaining 23 regions of 1.0 cm thickness to be centered at each centimeter along the depth axis. An additional 5.5 cm region provided the backscatter material and gave the water phantom a total depth of 30 cm. The front surface of the water phantom was kept at a distance of 80 cm away from the cobalt source for Co-60 beam calculations. [Figure - 1] shows the simulation geometry of the water phantom with dose scoring regions used for depth dose studies. Equivalent circular field sizes for rectangular fields were calculated using the following formula: [14] where δ is the equivalent diameter for the square of side σ. Simulations were carried out for a field size of 10 × 10 cm to get the central axis depth dose data. In the second part of the simulation, the lung tissue was introduced in the path of the beam along the central axis at different positions to simulate different arbitrary situations. The cross-section data for the materials used were available in a preprocessed PEGS4 cross-section data file [9] of the EGSnrc code system. The density and composition of the materials used in the simulation are shown in [Table - 1]. During the radiation treatment of the esophagus with posterior oblique fields, the lung tissue comes in the path of the beam; hence, the dose to the tumor is altered. In a clinical situation like this, we have to use ICFs for treatment time calculations to deliver an accurate dose to tumor. An arbitrary condition similar to this clinical situation was created as follows. A slab of lung tissue having a 20-cm width and 20-cm length was introduced in the water phantom at a depth of 2.5 cm below the surface and Monte Carlo simulations were carried out with different lung thicknesses of l-10 cm along the beam direction. Simulations were carried out for a field size of 10 × 10 cm at an 80-cm source to surface distance (SSD). The point of dose measurement was selected at a depth of 15 cm from the phantom surface. Point of measurement is the point at which the ICF values are calculated. The simulation phantom set up with lung tissue inhomogenity is shown in [Figure - 2]. For the radiation treatment of a lung cancer patient, the tumor is within the lung, i.e., the dose measurement point is within the inhomogenity [Figure - 3]. To study a similar clinical situation, the following arbitrary conditions were created. A slab of lung tissue of 20 cm length and 20 cm width was constructed at the middle of the water phantom with different thickness values of 3-9 cm. Monte Carlo simulations were done and the dose was measured at the middle point within the lung volume at the central axis for each thickness. The following transport parameters were used for Monte Carlo simulation in all of the above cases: Photon transport cutoff (PCUT) = AP = 0.01 MeV Pair angular sampling = Simple Electron transport cutoff (ECUT) = AE = 0.521 MeV Bremsstrahlung cross sections = BH Bremsstrahlung angular sampling = KM Spin effects = ON Electron Impact Ionization = OFF Maximum fractional energy loss/step = 0.25 Boundary crossing algorithm = EXACT Skin depth for boundary crossing = 3 Electrons-step algorithm = PRESTA-II Max number of histories to run = 50,000,000 Max number of histories to analyze = 50,000,000 Incident charge = 0 Spectrum file and title: C: \HEN_HOUSE\spectra\co60.spectrum. The total number of histories to run was selected in such a way that the statistical uncertainty of results was within 1%. Theraplan Plus is a commercially available TPS which is based on the pencil beam algorithm and for inhomogenity correction it uses the ETAR method. Theraplan Plus, version 3.7, is used in the present study. To obtain the lung correction factors from Theraplan Plus, a phantom similar to that used in Monte Carlo simulation was created in TPS. The phantom input was done through the key board of the TPS. X, Y, Z co-ordinates for 11 rectangualr slices (slices at 5 cm separation) were given to TPS and a phantom of size 50 × 50 × 30 cm was reconstructed. There is a provision in Theraplan TPS to define the density of a typical tissue. Using this provision lung tissue with density 0.26 g/cc was input to the TPS. Results In the first part of the simulation, we have obtained the dose/fluence for different depths in a homogeneous water phantom. From these values, the percentage depth dose (PDD) was calculated for different depths using the following formula: The calculated PDDs are shown in [Table - 2] and compared with the BJR Supplement 25 values. [Figure - 4] shows the variations in PDDs with the depth for Monte Carlo-simulated and BJR Supplement 25 values. A comparative plot shows that the Monte Carlo calculated depth dose data are in well agreement with the measurement values (BJR Suppl. 25). Pearson′s correlation coefficient was calculated for Monte Carlo-simulated and measured depth dose data. We have obtained the Pearson′s correlation coefficient as 1 with a P-value <0.00001. This shows that the Monte Carlo simulation input parameters and geometrical setups used in the simulations are adequate for the present study to get a statistically significant result. ICFs were calculated from the simulation values using the formula given below and results are shown in [Table - 3]: A graph is plotted with inhomogenity thickness on the X-axis and ICF on the Y-axis [Figure - 5] for Monte Carlo-simulated and TPS-calculated values. [Table - 4] shows the ICF values calculated for the dose calculation point within the lung equivalent tissue volume for different lung equivalent tissue thicknesses. The uncertainty obtained in the Monte Carlo simulations at different dose scoring regions and slab thicknesses is between 0.45% and 0.75%. Discussion In the case of the dose calculation point beyond the lung inhomogenity, the dose and hence the ICF increase with the increase in the inhomogenity thickness. The correction factors obtained from TPS is matching with Monte Carlo simulation results for small lung tissue thicknesses but deviates sharply for large thicknesses. To check whether the observed deviation is statistically significant, we have done one sample t-test for deviations with a test value 0. The deviations were found to be significant with a P-value 0.033. Theraplan Plus TPS is based on the pencil beam algorithm for dose calculations and it has already proven the inefficiency of the pencil beam algorithm while calculating ICF values for inhomogenity such as long air cavities or lung. [15],[16],[17] Animesh [15] made the following statement regarding the limitations of the pencil beam model: "Most treatment-planning systems employ pencil-beam algorithms. Dose distributions of photon beams with finite field sizes are calculated by a 2-dimensional convolution of these kernels. It is difficult to modify pencil beams for patient shape and heterogeneity. For expedience, empirical scaling methods are employed. Because the energy transport of secondary electrons, which may travel up to a few centimeters in water, is not taken into account by scaling methods, dose calculations with pencil-beam algorithms lead to errors near surfaces and inhomogenity. In addition, Z-variations of different kinds of tissues or materials are not taken into account." [Figure - 6] is a graph between the position of the inhomogenity thickness at depths along the central axis of the beam and the corresponding ICF obtained for a 1-cm lung thickness from Monte Carlo simulations. There is a gradual reduction in the ICF when the position of inhomgenity comes closer to the point of dose measurement. Our study shows that the ICF depends not only on the thickness but also on the position of inhomogenity. The radiation beam reaching at the dose calculation point contains primary and scattered radiation. The amount of scattered radiation from the inhomogenity medium which reaches the measurement point will vary with the position of inhomogenity. This may be the reason for the dependency of ICF on the position of inhomogenity. In the case of the dose calculation point within the lung tissue, ICF values obtained are less than unity for small lung tissue thicknesses and increase above unity for higher thicknesses. This may be due to the fact that for small lung thicknesses, the dose variation is mainly controlled by the secondary electron fluence and to a lesser extent by the changes in primary beam attenuation. But for large lung thicknesses, the primary beam attenuation significantly reduces within the lung tissue, and hence the dose at the measurement point increases. Conclusion In the present study, it is clear that the involvement of low-density materials such as lung tissue in the path of the radiation beam will alter the dose distribution in the tumor. For the accurate delivery of the radiation dose to the tumor, inhomogenity correction has to be applied. Monte Carlo simulation is found to be an accurate method to evaluate the inhomogenity correction factors. Our study shows that the lung correction factor depends not only on the thickness of the lung tissue along the beam direction but also on the position of the lung tissue with respect to the tumor position. The results showed that the Monte Carlo method for determining ICF is accurate forCo-60 units only. In the present study, we have estimated the lung correction factors along the central axis of the beam; a future study may include the off-axis profiles also. References
Copyright 2011 - Journal of Cancer Research and Therapeutics The following images related to this document are available:Photo images[cr11077t4.jpg] [cr11077f6.jpg] [cr11077f2.jpg] [cr11077e3.jpg] [cr11077t1.jpg] [cr11077f4.jpg] [cr11077f1.jpg] [cr11077t2.jpg] [cr11077t21.jpg] [cr11077f3.jpg] [cr11077f5.jpg] [cr11077e1.jpg] [cr11077e2.jpg] [cr11077t3.jpg] |
| |||||||||
