 |
| About Bioline | All Journals | Testimonials | Membership | News |
|
||||||
|
||||||
African Crop Science Journal, Vol. 8. No. 1, pp. 35-47, 2000 INFLUENCE OF VARIETY AND MANAGEMENT LEVEL ON PEARL MILLET PRODUCTION IN NIGER: II . N AND P CONCENTRATION AND ACCUMULATIONN. Maman, S.C. Mason1* and S. Sirifi Institut National de Recherches Agronomiques du Niger, B.P. 429, Niamey, Niger (Received 13 November, 1998; accepted 15 November, 1999) Code Number: CS00004 ABSTRACT Pearl millet [Pennisetum glaucum (L.)R. Br.] is generally grown on nutrient-poor soils and low rainfall conditions in Niger. Nitrogen and P accumulation and utilisation are very important factors in pearl millet growth, and are affected by environment and management. An understanding of seasonal N and P accumulation is necessary to improve pearl millet production. A two-year field study was conducted in 1995 and 1996 at Kollo, Niger with the objective to determine N and P concentration and accumulation by pearl millet as affected by variety and management level. Treatments were factorial combinations of three pearl millet varieties: ‘Heini Kirei’, a landrace tall variety; ‘Zatib’, an improved tall variety; and ‘3/4HK’, a short improved variety, with low management (10,000 hills ha-1 with no fertiliser) and high management (20,000 hills ha-1 with manure and N and P fertiliser application). Management level had no influence on N and P concentration even though N and P fertiliser, and manure were applied. Variety influence was small and inconsistent. More N and P were translocated from the stem and leaves to the panicle in the higher rainfall year when grain yield was greater. The shorter variety 3/4HK had less N and P accumulation than the tall varieties likely due to less dry matter production. The average maximum total plant N accumulation for low management was 1.42 g N m-2 in 1995 and 0.62 g N m-2 in 1996, while for high management it was 4.58 g N m-2 in 1995 and 2.45 g N m-2 in 1996. Biomass N use efficiency was not influenced by management in either year, while grain nitrogen use efficiency was 17 g grain g-1 N higher with high management than with low management in 1995. In 1996, grain N use efficiency was 11 g grain g-1 N higher with low management than with high management. The short, early maturing variety ‘3/4HK ‘tended to have lower N use efficiencies than the other varieties. Nitrogen and P accumulation, and grain N use efficiency was influenced more by management than variety. Key Words: Nitrogen accumulation, nitrogen use efficiency, Pennisetum glaucum, phosphorus accumulation RÉSUMÉ Le petit mil [Pennisetum glaucum (L.) R. Br.] est généralement cultivé sur des sols pauvres dans des conditions de faibles pluviométries au Niger. L’accumulation et l’utilisation de N et P sont des facteurs importants dans la croissance du petit mil et sont influencées par le niveau de gestion et l’environnement. Une meilleure connaissance de l’accumulation saisonnière de N et P est nécessaire dans le but d’améliorer la production du mil. Une expérimentation en champ a été conduite pendant deux ans au Niger pour déterminer la concentration et l’accumulation de N et P par le petit mil influencées par la variété et le niveau de gestion. Les traitements étaient constitués par des combinaisons factorielles de trois variétés de petit mil: ‘Heini Kirei’, une variété locale de haute taille; ‘Zatib’, une variété améliorée de haute taille; et ‘3/4 HK’, une variété améliorée de courte taille avec un bas niveau de gestion (10.000 poquets ha-1 sans fertilisation) et un haut niveau de gestion (20.000 poquets ha-1 avec application du fumier et d’engrais minéraux N et P). Le niveau de gestion n’a eu aucune influence sur la concentration de N et P. L’effet de la variété était inconsistante et négligeable. Plus de N et P étaient mobilisés dans les feuilles et l’épi à partir de la tige dans l’ année de forte pluviométrie avec des rendements plus élevés. La variété de courte taille 3/4HK a accumulé un peu moins de N et P que les variétés de haute taille probablement lié à sa faible production de biomasse. L’accumulation moyenne de l’azote totale de la plante pour le bas niveau de gestion était de 1,42 g N m-2 en 1995 et 0,62g N m-2 en 1996, tandis que pour le haut niveau de gestion, elle était de 4,58 g N m-2 en 1995 et 2,45 g N m-2 en 1996. L’efficacité d’utilisation de l’azote de la biomasse n’était pas influencée par le niveau de gestion dans aucune des années, tandis que l’efficacité d’utilisation de l’azote du grain était de 16 g grain g-1 N plus grand avec le haut niveau de gestion que le bas niveau de gestion en 1995. En 1996, l’efficacité d’utilisation de l’azote du grain était de 11 g grain g-1 N plus grand avec le bas niveau de gestion que le haut niveau de gestion. La variété de courte taille et précoce ‘3/4HK’ avait tendence a avoir une efficacité d’utilisation de la zote plus faible que les autres variétés due en grande partie à sa faible production de grain et de matière sèche. L’accumulation de N et P était influencée plus par le niveau de gestion que par la variété, tandisque l’efficacité d’utilisation de l’azote était influencée à la fois par le niveau de gestion et la variété. Mots Clés: Accumulation de l’azote, efficacité d’utilisation de l’azote, Pennisetum glaucum, accumulation du INTRODUCTION Nitrogen and P uptake and utilisation are important factors in crop growth and productivity, and are affected by environment and management. The amount of N and P accumulated during plant growth depends on availability and the physiological processes that govern uptake. Pearl millet [Pennisetum glaucum (L.) R. Br] is generally grown on nutrient-poor soils and low rainfall conditions in Africa and India. In Niger, and in most African countries where pearl millet is grown, soils are continuously deteriorating as organic matter content is decreasing since nutrient removal in grain and stover are generally greater than additions (Bagayoko et al., 1996). Nitrogen and P accumulation by the crop is often considered as a general guideline of plant needs. In addition, N and P concentrations in grain and stover are important as pearl millet grain is used as human food, and stover is used for livestock feed. Efficient production of pearl millet is characterised by having high N and P accumulation by the plant, high dry matter per unit of nutrient assimilated, and rapid translocation of nutrients from vegetative parts to the grain during grain fill (Wani et al., 1990). However, Alagarswamy and Bidinger (1987) found that differences in the ability of genotypes to utilise N were not related to N accumulation. Rather, an increase in N fertiliser rates decreased N use efficiency since the percentage increase in biomass was smaller than the percentage increase in N accumulation. van Duivenbooden and Cissé (1993) found no difference at maturity in N, P, and K concentrations in stover and grain of the cultivar Souna III between the control and treatments with manure and/or chemical fertiliser application. Gregory and Squire (1979) and Gregory (1979) studied dry matter production and N, P, K uptake by irrigated and unirrigated pearl millet and found that N, P, and K concentration decreased in water stressed pearl millet. Payne et al. (1995) examined pearl millet growth and nutrient accumulation under varying levels of soil water and P availability. They found that N and P concentration in stems, live and dead leaves increased with water stress. When P level was increased from 0 to 56 g m -2 , the P concentration increased and the N concentration decreased. Studies conducted in Africa (Bationo et al., 1990) and India (Alagarswamy and Bidinger, 1987; Wani et al., 1990) showed differential grain yield response of pearl millet genotypes to applied N fertiliser, suggesting that differences among genotypes exist in N accumulation and trans-location from leaves and stem to grain. The objective of this study, therefore, was to determine N and P concentration and accumulation by pearl millet in Niger as affected by variety and management level, and provide baseline N and P concentration data of pearl millet plant parts. MATERIALS AND METHODS A two-year field study was conducted in 1995 and 1996 at Kollo, Niger (West Africa) on a Psammentic Paleustalf with sandy texture, approximately 0.2 % organic matter, and pH of 5.4. The experiment consisted of a factorial combination of three pearl millet varieties and two management levels with three replications. The three varieties used were: ‘Heini Kirei’, a local landrace tall variety; ‘Zatib’, an improved tall variety; and ‘3/4HK’, a dwarf variety. The management levels were low management with 10,000 hills ha-1 (30,000 plants ha-1) and no fertiliser, and high management with 20,000 hills ha-1 (60,000 plants ha-1), and 5 t ha-1 of manure, 18 kg P ha-1 and 23 kg N ha-1. General experimental conditions and production practices were previously described (Maman et al., 2000). Two plants per plot were randomly harvested bi-weekly and separated into leaf, stem, and panicle, and dried at 65 °C for 48 hours. After weighing, the plant parts were ground to pass through a 1-mm sieve, thoroughly mixed, and analysed by Ward Laboratory, Inc. (Kearney, Nebraska, USA) for nutrient concentrations. The combustion method 990.03, and the atomic absorption spectrophotometric method 965.17 (AOAC,1990) were used to determine N and P concentrations in leaf, stem, and panicle. Nitrogen and P accumulation were determined by multiplying dry weight of plant parts by the nutrient concentration then summing over plant parts for total plant accumulation. Nitrogen use efficiencies as defined by Maranville et al. (1980) were calculated from the ratio of total dry matter or grain dry matter per unit total N accumulation [NUE1 (g dry matter g -1 N) and NUE2 (g grain g -1 N)] at physiological maturity. The data were subjected to statistical analysis of variance (ANOVA) and single degree of freedom orthogonal contrasts, using the general linear model (GLM) procedure (SAS, 1988). Data for each year were analysed separately. Polynomial curves were fitted against days after planting (DAP) for N and P accumulation. RESULTS AND DISCUSSION N and P concentration. In 1995, varietal differences in N concentration of pearl millet plant parts occurred only for the stem at 80 DAP (Tables 1, 3 and 5). In 1996, the local landrace ‘Heini Kirei’ had 4 to 9 g kg-1 lower leaf N concentrations than the improved varieties at 27, 42 and 91 DAP (Tables 2, 3 and 5). Heini Kirei had 2 to10 g kg-1 lower stem N concentration than the improved varieties at 42 and 91 DAP. Zatib had 8 g kg-1 lower leaf and stem N than 3/4 HK at 42 DAP. In spite of 23 kg ha-1 N and 5 t ha-1 manure application, high management had no effect on leaf, stem and panicle N concentration in 1995 (Tables 1, 3 and 5). In 1996, however, high management increased leaf N concentrations by 15 g kg-1 at 27 DAP and by 5 g kg-1 at 42 DAP, and stem N concentration by 4 g kg-1 at 27 DAP and 1 g kg-1 at 42 DAP. Similar results were reported by Duivenbooden and Cissé (1993). Leaf, stem and panicle P concentrations were not influenced by either variety or management level (Tables 1, 2, 4 and 6), even though high management had application of 18 kg ha-1 P and 5 t ha-1 manure. Similar results were previously reported by Duivenbooden and Cissé (1993) and Payne et al. (1995). In contrast, Buerkert (1995) found that P application increased stover concentration by 50% and grain P concentration by 27%. Nitrogen concentrations in plant parts were slightly higher in 1996, which was drier, than in 1995 (Tables 1, 2, 3 and 5). In contrast, P concentrations were much lower at physiological maturity in 1996 than in 1995 (Tables 1,2, 4, and 6). Payne et al. (1995) reported increased N and P concentration in stems, live leaves, and dead leaves with water stressed pearl millet. On the other hand, Gregory (1979) found that N, P and K concentration decreased in water stressed pearl millet since most of the nutrients were present in a dry upper soil layer but water was being extracted from the lower nutrient-poor depths. Viets (1972) also reported similar observations. Nitrogen and P concentrations in leaf and stem decreased with plant age in both years except for stem P in 1995 (Tables 1 through 4). However, N and P concentrations of panicles remained relatively constant from anthesis to physiological maturity (Tables 5 and 6). This suggests that translocation of N and P from leaf and stem to panicles was proportionately similar to dry matter translocation from leaf and stem to the panicle in this study. Nutrient concentrations for maximum growth have not generally been reported for pearl millet. Coaldrake and Pearson (1985) found 15.6 g kg -1 N on whole plant basis before panicle initiation and 13 g kg -1 N concentration during later development. In this study, average leaf and stem N concentrations with low and high management during the vegetative growth were 32 and 33 g kg-1 in 1995 and 24.5 and 29 g kg-1 in 1996 (Tables 1 and 3). This suggests that N concentrations were adequate for maximum growth during vegetative growth or at least were not the most limiting factor. At 66 DAP in 1995 and 62 DAP in 1996, average leaf, stem and panicle N concentrations with low and high management were 11.3 and 10.3 g kg-1 in 1995, and 11.3 and 12.7 g kg-1 in 1996 (Tables 2 and 3). These values were slightly lower than needed for maximum growth (Coaldrake and Pearson, 1985) and this was one possible reason for the low grain yields observed. Sufficiency levels for P have not been reported for pearl millet, but Lockman (1972) reported nutrient sufficiency levels for grain sorghum [Sorghum bicolor (L.) Moench] which are likely similar to those for pearl millet. Average leaf and stem P concentrations in this study of 3.1 to 3.4 g kg -1 (Tables 1, 2 and 4) were within the adequate range for grain sorghum during vegetative growth, and 1.5 to 2.5 g kg -1 were within the adequate range after panicle initiation. N and P accumulation. Variety and management level interaction effects were not detected in either year for leaf, stem, panicle or whole plant N and P accumulation. This suggests that the land race variety and improved varieties responded similarly to crop management. Variety differences were present only for panicle N and P accumulation at 76 and 91 DAP in 1996. The difference at 76 DAP was likely due to difference in time to panicle emergence as the improved varieties ‘Zatib’ and ‘3/4HK’ reached anthesis 10-12 days before the local variety. Nitrogen and P accumulation was highly influenced by management and this was related to higher dry matter production with high management (Maman et al., 2000) since N and P concentrations were not affected by management (Tables 1 through 6). Table 1. Leaf nitrogen and phosphorus concentration of pearl millet at two management levels at Kollo, Niger in 1995
Table 2. Leaf nitrogen and phosphorus concentration (g kg-1) of pearl millet under two management levels at Kollo, Niger in 1996
Table 3. Stem nitrogen concentration (g kg-1) of pearl millet under two management levels at Kollo, Niger in 1995 and 1996
Table 4. Stem phosphorus concentration(g kg-1) of pearl millet under two management levels at Kollo, Niger in 1995 and 1996
Table 5. Panicle nitrogen concentration (g kg-1) of pearl millet under two management levels at Kollo, Niger in 1995 and 1996
Table 6. Panicle phosphorus concentration (g kg-1) of pearl millet under two management levels at Kollo, Niger in 1995 and 1996
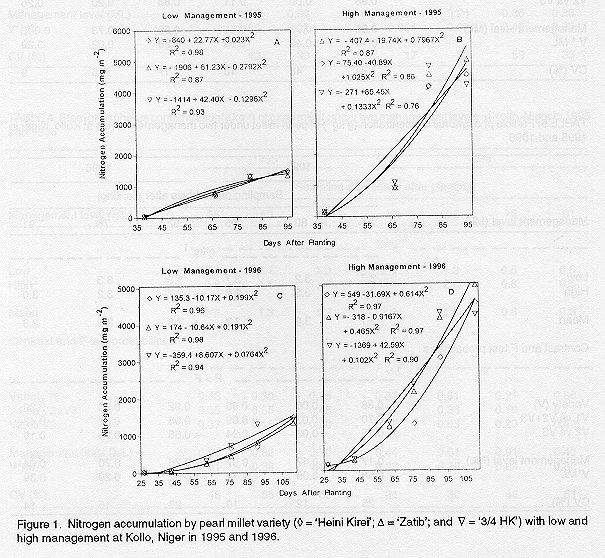
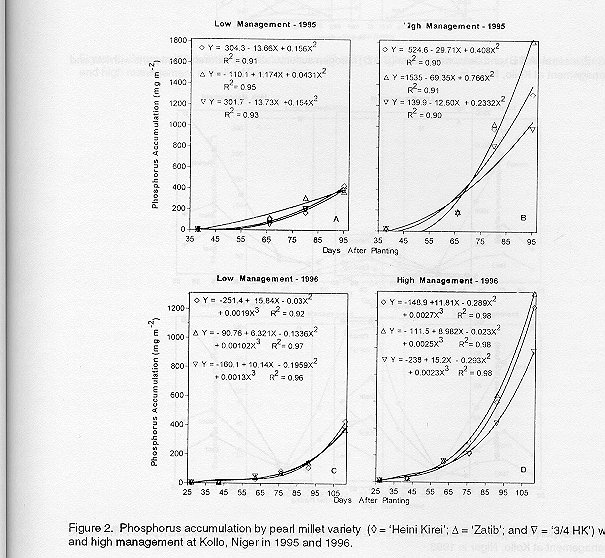
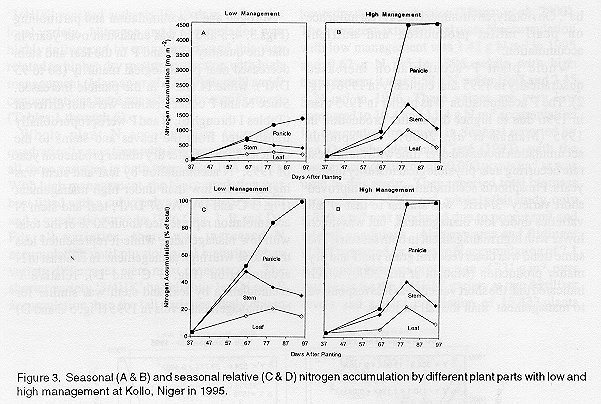
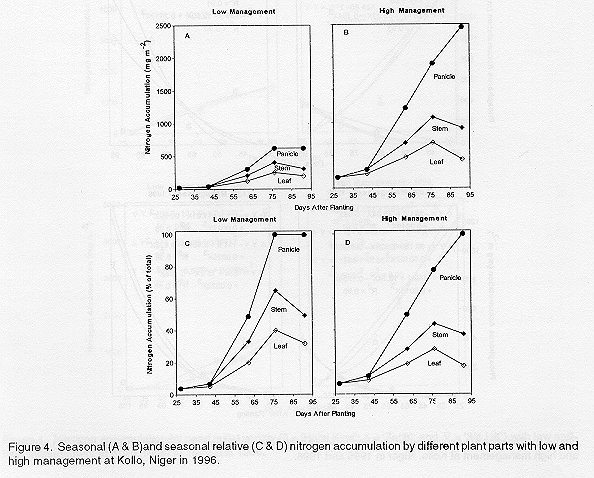
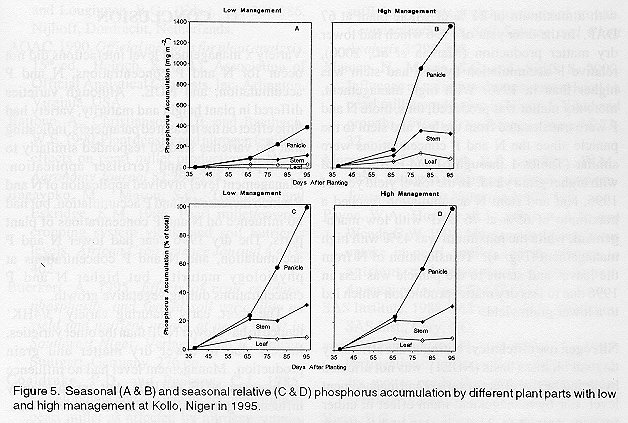
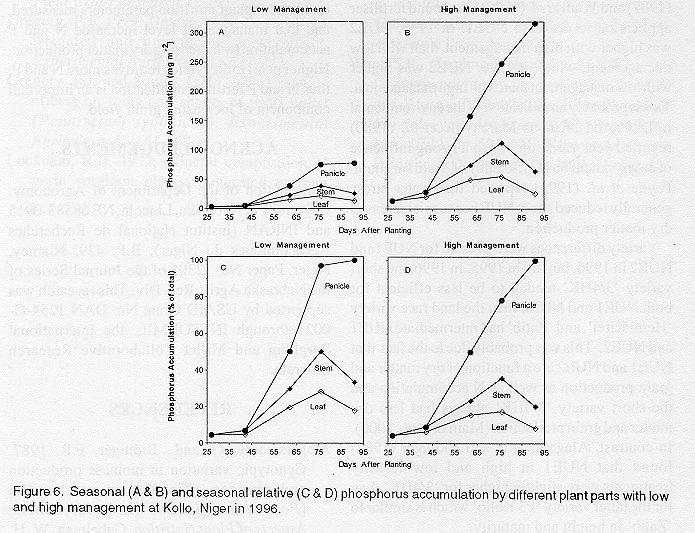
Whole plant N accumulation increased quadratically over time with low management for all three varieties in both years (Fig. 1 A and C). With high management, the N accumulation was best fitted with a cubic polynomial curve in 1995 and a quadratic curve in 1996 (Fig. 1 B and D). For all varieties, there was increased N accumulation until physiological maturity when variety differences were most pronounced. The shorter variety ‘3/4HK’ had slightly less N and P accumulation than the tall varieties likely due to lower dry matter production (Maman et al., 2000). The average maximum total plant N accumulation with low management was 1.42 g N m-2 in 1995 and 0.62 g N m-2 in 1996, while with high management it was 4.58 g N m-2 in 1995 and 2.45 g N m-2 in 1996. These values are very low compared to 10.4 and 11.4 g N m-2 accumulation for the control treatment in Sénégal reported by van Duivenbooden and Cissé (1993), with the same plant population of 30,000 plants ha-1 as was used in this study. They reported total biomass production of >750 g m-2 , while in this study, only < 350 g m-2 was produced due to poorer soil and rainfall conditions. Alagarswamy and Bidinger (1987) reported an average N accumulation of 7.1 g m-2 and a biomass production of 731 g m-2 over two years for the ‘3/4HK’ variety at two fertiliser levels and a plant population of 13,333 plants ha-1. Obviously, environment had a great influence on pearl millet production and nutrient accumulation. Whole plant P accumulation increased quadratically in 1995 and cubically in 1996 (Fig. 2). The P accumulation was higher in 1995 than in 1996 due to higher dry matter production in 1995 (Maman et al., 2000). Phosphorus accumulation increased over time with the highest rate occurring near physiological maturity in both years. Phosphorus accumulation by the improved short variety ‘3/4HK’ was similar to that of tall varieties under low management, but was much lower with high management in both seasons. The same trend was observed with grain yield and dry matter production (Maman et al., 2000) which indicated that the short variety was less responsive to management than the tall varieties. Nitrogen and P accumulation and partitioning (Figs.3, 4, 5 and 6) was consistent over years in that the quantity of N and P in the leaf and stem decreased near physiological maturity (80 to 95 DAP), while N and P in the panicle increased. Since N and P concentrations were not different (Tables 1 through 6), N and P were proportionally translocated from the leaves and stems to the panicle. In the greater dry matter production year of 1995, N accumulation by leaf and stem was higher under low than under high management (Fig. 3 C and D). At 67 DAP, leaf and stem N accumulation represented about 50 % of the total with low management, while it represented less than 20 % with high management. In contrast to N accumulation (Fig. 3 C and D), relative P accumulation by leaf and stem was similar for both management levels in 1995 (Fig. 5 C and D) with a maximum of 21 % of whole plant at 67 DAP. In the drier year of 1996 which had lower dry matter production (Maman et al., 2000), relative P accumulation by leaf and stem was higher than in 1995. With high management, more dry matter was produced; thus, more N and P were translocated from the leaf and stem to the panicle since the N and P concentrations were similar (Tables 1 through 6) and corresponded with higher grain yield. In the lower yield year of 1996, leaf and stem N accumulation reached a maximum of 65% at 76 DAP with low mana-gement, while the maximum was 45% with high management (Fig. 4). Translocation of N from the leaves and stems to the panicle was less in 1996 due to less dry matter production which led to a lower grain yield. Figure 1. Nitrogen accumulation by pearl millet variety (à = ‘Heini Kirei’; D = ‘Zatib’; and Ñ = ‘3/4 HK’) with low and high management at Kollo, Niger in 1995 and 1996. Figure 2. Phosphorus accumulation by pearl millet variety (à = ‘Heini Kirei’; D = ‘Zatib’; and Ñ = ‘3/4 HK’) with low and high management at Kollo, Niger in 1995 and 1996. Figure 3. Seasonal (A & B) and seasonal relative (C & D) nitrogen accumulation by different plant parts with low and high management at Kollo, Niger in 1995. Figure 4. Seasonal (A & B)and seasonal relative (C & D) nitrogen accumulation by different plant parts with low and high management at Kollo, Niger in 1996. Figure 5. Seasonal (A & B) and seasonal relative (C & D) phosphorus accumulation by different plant parts with low and high management at Kollo, Niger in 1995. Figure 6. Seasonal (A & B) and seasonal relative (C & D) phosphorus accumulation by different plant parts with low and high management at Kollo, Niger in 1996. Nitrogen use efficiency. Nitrogen use efficiency on total biomass basis (NUE1) was not affected by the interactive effect of variety and management level nor by management main effect in either year in contrast to Alagarswamy and Bidinger (1987) and Wani et al. (1990) who found fertiliser application to decrease NUE1. In 1995, NUE2 was higher with high management than with low management, while in 1996, NUE2 was higher with low management than with high management. This is probably an indication of the environmental influence on NUE as Maranville et al. (1980) reported year variation due to a strong influence of environment on N efficiency of grain sorghum. Payne et al. (1995) reported that water stress generally reduced shoot NUE because it increased dry matter production. Variety differences were present for NUE1and NUE2 in 1996, but not in 1995. In 1996, the short variety ‘3/4HK’ tended to be less efficient for both NUE1 and NUE2 than the land race variety ‘Heini Kirei’, and ‘Zatib’ had intermediate NUE1 and NUE2. This was probably due to the fact that NUE1 and NUE2 are a function of dry matter and grain production as well as N accumulation and the short variety ‘3/4HK’ always had less dry matter and grain production (Maman et al., 2000). In contrast, Alagarswamy and Bidinger (1987) found that NUE1 in high and low fertility treatments were slightly higher for ‘3/4HK’ than for the taller variety ‘P3 Kollo’ which is similar to ‘Zatib’ in height and maturity. CONCLUSION Variety x management level interactions did not occur for N and P concentrations, N and P accumulation, and NUE. Although varieties differed in plant height and maturity, variety had little effect on the measured parameters, indicating that the varieties studied responded similarly to plant population and fertiliser application. Management level involved application of N and P which increased N and P accumulation, but had no influence on N and P concentrations of plant parts. The dry 1996 year had lower N and P accumulation, and N and P concentrations at physiology maturity, but higher N and P concentrations during vegetative growth. The short, early maturing variety ‘3/4HK’ tended to have lower NUE than the other varieties, largely due to lower dry matter and grain production. Management level had no influence on biomass NUE (NUE1), but inconsistently influenced grain NUE (NUE2) in the two years. This study indicates that variety had little effect on N and P plant nutrition parameters measured, and that management level increased N and P accumulation by increasing dry matter production. Higher pearl millet yields removes more N and P, thus N and P fertiliser application is an important component of increasing grain yield. ACKNOWLEDGEMENTS Contribution of the Department of Agronomy, University of Nebraska, Lincoln, NE 68583-0915 and INRAN (Institut National de Recherches Agronomiques du Niger), B.P. 429, Niamey, Niger. Paper No. 12305 of the Journal Series of the Nebraska Agric. Res. Div. This research was supported by USAID Grant No. DAN 1254-G-0021 through INTSORMIL, the International Sorghum and Millet Collaborative Research Program. REFERENCES
©2000, African Crop Science Society The following images related to this document are available:Photo images[cs00004f.jpg] [cs00004c.jpg] [cs00004a.jpg] [cs00004b.jpg] [cs00004d.jpg] [cs00004e.jpg] | ||||||||||||||||||||||||||||||||||||||||||||||||||||||||||||||||||||||||||||||||||||||||||||||||||||||||||||||||||||||||||||||||||||||||||||||||||||||||||||||||||||||||||||||||||||||||||||||||||||||||||||||||||||||||||||||||||||||||||||||||||||||||||||||||||||||||||||||||||||||||||||||||||||||||||||||||||||||||||||||||||||||||||||||||||||||||||||||||||||||||||||||||||||||||||||||||||||||||||||||||||||||||||||||||||||||||||||||||||||||||||||||||||||||||||||||||||||||||||||||||||||||||||||||||||||||||||||||||||||||||||||||||||||||||||||||||||||||||||||||||||||||||||||||||||||||||||||||||||||||||||||||||||||||||||||||||||||||||||||||||||||||||||||||||||||||||||||||||||||||||||||||||||||||||||||||||||||||||||||||||||||||||
| |||||||||
