 |
| About Bioline | All Journals | Testimonials | Membership | News |
|
||||||
|
||||||
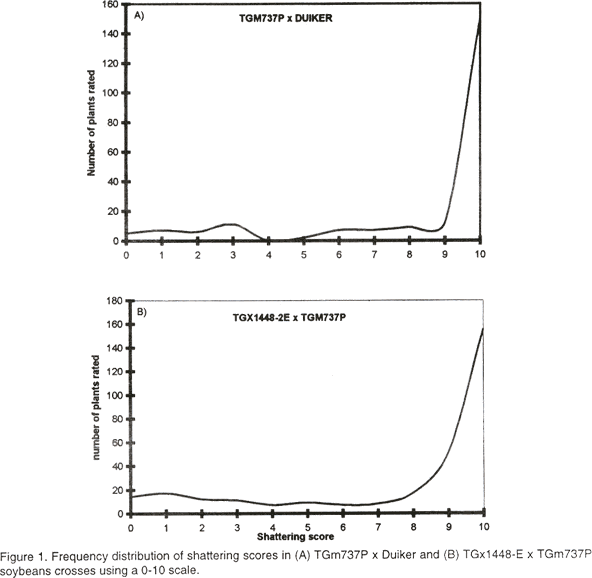
African Crop Science Journal, Vol. 8. No. 3, pp. 203-211 Inheritance of resistance to pod shattering in soybean P.Tukamuhabwa, P.R. Rubaihayo, K. Dashiell1 and E.Adipala (Received 12 November, 1999; accepted 14 June, 2000) Code Number: CS00022 Introduction Pod shattering is the opening of pods along both the dorsal and ventral sutures of the soybean pod ( Glycine max). Shortage of labour and harvesting equipment can postpone harvesting when the farmer is otherwise prepared to harvest, leading to seed losses of 50-100% often associated with pod shattering during dry weather conditions in susceptible varieties (IITA, 1986). Ferraz de Toledo et al. (1994) reported that shattering in soybean was the most important trait among the important characteristics of the soybean plant. Work at the International Institute of Tropical Agriculture (IITA) showed that resistance to shattering was of great economic benefit to farmers in the hot tropics and areas where machines are used for harvesting in terms of reduced yield losses and planning for time and labour (IITA, 1986). Misra et al. (1980) observed that information on genetics of shattering in soybeans was scanty and inconsistent, and little effort had been devoted to improving soybean for resistance to shattering in the tropics where soybean has been observed to shatter easily (IITA,1992). Hoag (1972) estimated losses due to shattering to be as high as 60%, accounting for loss of over 170 m US dollars annually in United States. In field trials at Arlington, USA, Philbrook and Oplinger (1989) observed that shattering contributed 37% of total field loss in soybean. Caviness, (1969) found susceptibility to shattering to be partially dominant but analysis of pod shattering in F1 populations by Tiwari and Bhatnagar (1992) suggested that susceptibility was dominant or partially dominant to resistance. They further observed additive gene action to predominate in the expression of the trait, although dominance also played a major role. According to Caviness (1969) segregation for soybean shattering in F2 was overlapping suggesting polygenic inheritance. Misra et al. (1980) experienced difficulty in estimation of shattering trait of soybean genotypes, which they attributed to absence of discrete observations at F2 generation, suggesting presence of several genes. Suzuki et al. (1981), however, suggested that if the difference between genotype means was small compared to the environmental variance, even one or two genes could result in continuous variation. Carpenter and Fehr (1986) observed discrete classes of shattering scores in segregating populations of soybean involving a susceptible wild relative Glycine soja and two resistant cultivars. They observed shattering frequency to decrease with each generation of backcrossing to the cultivars and concluded that the shattering trait could be completely eliminated by three to four backcrosses, indicating that only a few genes were involved. Caviness (1963) suggested that four major genes were involved in controlling susceptibility to shattering. On the other hand Tsuchiya (1986) suggested that depending on methodology, minimum number of genes controlling shattering in soybean varied between one and two, while Akpan (1988) reported 6 - 12 genes to be involved. In a recent study by Bailey et al. (1997) it was observed that one major quantitative loci, and a few minor QTLs controlled pod shattering in soybean. Average broad sense heritability (h2b) estimate of shattering in soybean was put at 0.9 by Caviness (1969), 93% by Tsuchiya (1987) and 98.8% by Tiwari and Bhatnagar (1991) indicating that the character is highly heritable. Heritability in the broad sense (h2b) in self pollinating crops is less informative than heritability in the narrow sense (h2n) which is a direct measure of additive variance. The narrow sense heritability can be achieved by parent offspring regression if parental values are means of both parents (Kearsey and Pooni, 1997) or from the expected mean squares of the progenies of interest (Brim et al., 1961). The presence of epistasis and dominance tend to inflate values of h2n (Fernadez and Miller, 1985) and thus, heritability determined by the regression coefficient in case of random mating offers a more secure approach to h2n than the partition of variance. The study reported in this paper was carried out to assess the inheritance mechanism of pod shattering in soybean and determine narrow sense heritability and number of genes controlling soybean pod shattering. MATERIALS AND METHODS Eight parental lines were characterised for pod shattering in the field at Namulonge (Uganda) in December, 1996 and their level of resistance to pod shattering confirmed using the oven method (Jiang et al., 1991). Genotypes AGS 292 and TGm 737P were susceptible to pod shattering, Gc81090-48, Duiker, TGx 1448-2E and Roan resistant, and genotypes Kabanyolo1 and Samsoy 1 were intermediate. A total of 15 soybean crosses were made from the eight lines in two sets. The first set comprised of nine crosses; TGm 737P x Duiker, TGx 1448-2E x TGm 737P, TGx 1448-2E x Samsoy 1, TGx 1448-2E x Duiker, Kabanyolo 1 x TGm 737P, Duiker x Kabanyolo 1, Kabanyolo 1 x Duiker, TGx 1448-2E x Kabanyolo 1 and Kabanyolo 1 x TGx 1448-2E. These crosses were made at Namulonge in 1996, second season (October). Their F1 and F2 progenies were planted in 1997 during the first (March) and second (September) seasons, respectively. Seed bulks of each cross were made for all crosses and planted as F2 populations and were grown in a completely randomised design and analysed according to Kearsey and Pooni (1996) to determine heritability, by regressing F2 populations means on value of their mid parents. A second set of crosses consisted of: TGx 1448-2E x AGS 292, AGS 292 x Roan, Gc81090-48 x AGS 292, TGx 1448-2E x TGm 737P, TGm 737P x Duiker and Roan x TGm 737P which were between susceptible and resistant parental lines. Their F1 and F2 progenies were planted in 1998 during the first (March) and second (September) seasons, respectively. F1 plants from the crosses varied from 5 to 12 plants and yielded an F2 plant population of 59 to 310 plants per cross and were used to study the population distribution at F1 and F2 to determine the number of genes controlling pod shattering. Determination of maternal influence. Maternal influence on the inheritance of soybean pod shattering was determined using crosses of TGm 737P x Duiker, TGm 737P x Roan and AGS 292 x TGx 1448 - 2E and their reciprocals. Shattering was evaluated in the F2 and F3 generations. Reciprocal crosses were only available for these three crosses, due to difficulties involved in obtaining enough F1 hybrid seed in autogamous crops like soybean. The means of the crosses and their respective reciprocal crosses were compared using Z test ( Fowler and Cohen,1990) to determine the difference between the mean of each cross and its respective reciprocal. Evaluation procedure for pod shattering. Shattering scores were carried out on the progenies at F1, F2 and F3 generations. The pods in paper bags were allowed to equilibrate for ten days at room temperature after which they were subjected to oven drying at 80 °c for 12 hours. The percentage of pod shattering induced was determined on the 0 – 10 scale used by Bailey et al. (1997) where 0 < 1% = 0, 1-10% =1, 11-20% = 2, 21-30%=3, 31-40% = 4, 41-50% = 5, 51-60%=6, 61-70%=7, 71-80 = 8, 81-90%=9, 91-100%=10. Basing on the scale by Bailey et al. (1997), a 1 - 3 scale was developed in which 0 - 10% shattered = 1, 11 - 70% shattered = 2 and 71 - 100% shattered = 3. Basing on results from the 1 – 3 scale, phenotypic classes were assigned as follows: progenies with the score of 1 were regarded as resistant, progenies with score of 2 as intermediates and 3 as susceptible. A Chi square test to determine the departure of the observed frequencies from the expected frequencies was carried out based on critical values of 4.605, 5.991, 9.210 for two degrees of freedom on the 0.10, 0.05 and 0.01 probability levels, respectively. Determination of number of genes. Estimation of the number of genes controlling resistance for pod shattering in soybean was carried out according to Bjarko and Line (1987) using the formulae: (1) F2 generation: n = (GR)2 [1.5 - 2 h(1 - h)] / 8(VF2 - (VPS + VPR + 2VF1)4) (2) F3 generation: n = (GR)2 / 5.33 [VF3 - (VPR + VPS)/2] GR = Genotype range, estimated as phenotypic range of segregating populations or difference betweenthe two parents (PS - PR) Number of loci were also estimated using the original Castle - Wright’s method (Zeng et al., 1990) as follows: (3) Kcw = D2 / 8VG = D2 / 8(VF2 - VE) RESULTS AND DISCUSSION The shattering scores of F1 hybrids of susceptible and resistant parents and their parental lines are presented in Table 1. All F1 plants indicated a phenotype closer to the susceptible parent than the resistant parent, suggesting partial dominance for susceptibility. Similar results were reported by Caviness (1969). Genetic ratios for levels of pod shattering resistance at F2 are presented in Table 2. A Chi square test on the ratios obtained in all six crosses fitted the 1 resistant: 3 Intermediates: 12 susceptible model, suggesting dominant epistasis to be present and that shattering resistance is controlled by two genes. The frequency distribution of F2 populations for the 0 - 10 scale is shown in Figure 1. Contrary to observations made by Ting (1946) and Caviness (1969) the frequency distribution of F2 was not overlapping in a normal distribution manner but presented a wide and skewed distribution. The complex distribution observed on F2 progenies can be attributed to epistasis which cause deviations from the expected distribution ( Fehr, 1987; Griffith et al.. 1997).
A suggested model for the genetic control mechanism of pod shattering in soybean is presented in Table 3. This model suggests that genes at same locus interact resulting in susceptibility alleles being dominant over alleles for resistance plus non allelic interaction (epistasis). An assumption is made on basis of a two gene model, whose genotypes are represented by A+A+B+B+and A-A-B-B- for homozygous dominant and homozygous recessive parental lines, respectively. The observed ratio of 1:3:12 in which the presence of at least one dominant allele (A+) at one locus masks the expression of both alleles present, results in the dominant phenotype, and presence of (B+) in absence of (A+) results in an intermediate phenotype. The final distribution is a reflection of classical dominant epistasis which causes modification of 9:3:3:1 Mendelian ratio (Kearsey and Pooni, 1996) and fits the proposal that epistasis influences soybean pod shattering (Bailey et al. 1997)
In self pollinating plants like soybean, epistasis is more important than dominance and can generate different phenotypes some of which represent real genetic advance over their parents (Allard, 1960). However, Kearsey (1993) reported that non allelic interactions cause problems when predicting response to selection, by preventing identification of the most promising crosses at an early stage in the breeding programme. Kearsey and Pooni (1996) noted that the effect of epistasis is more profound on means as opposed to variances and epistatic effects of generation means are more amenable to analysis than those of variances. Hallauer and Miranda (1988) recommended identification of loci with favourable epistatic combinations for improvement of economically important traits in crops. When epistasis is important, recurrent selection and reciprocal recurrent selection have been recommended as efficient techniques for selecting favourable epistatic gene combinations (Allard, 1960; Moreno-Gonzalez and Cubero, 1993). The parent - offspring regression analysis indicated a heritability estimate of 0.79 ( Table 4) suggesting that inheritance of resistance to pod shattering was highly heritable. Heritability estimates obtained from regressing offsprings on their mid-parent values are a direct estimate of heritability in the narrow sense (Kearsey and Pooni, 1996), and explains the reason why the estimate is lower than estimates reported by Caviness (1969), and Tiwari and Bhatnagar (1991) which were broad sense estimates. However, the high estimate of heritability in this study may have been inflated by the presence of epistasis (Ferdnadez and Miller, 1985).
Using F2 and F3 progenies, estimates of genes ranged from 1.63 to 2.33 following Bjarko and Lines’ (1987) method ( Table 5). The results suggested a mean of 2.01 genes at F2 and 2.06 at F3 suggesting 2 genes being involved in controlling pod shattering. However, the number of loci varied between 1 and 2 using Castle and Wright’s method which Zeng et al. (1990) observed to underestimate the number of loci. These results are in agreement with the observed phenotypic ratio of 1:3:12 at F2. Similar results were reported by Tsuchiya (1986) while contrary estimates were given by Caviness (1963), who indicated four major genes and Akpan (1988) who reported 6 to 12 genes to be responsible for pod shattering in soybean. Other diverging results were reported by Bailey et al. (1997) who showed shattering to be conditioned by one major gene and a few modifier genes.
The results of the maternal influence are shown in Table 6. There were no significant differences between the crosses and their reciprocals indicating absence of maternal influence on pod shattering in soybean, and suggesting that choice of maternal parent is not important in a hybridisation programme focussing on improvement of soybean for resistance to pod shattering.
In conclusion, pod shattering in soybean is under control of two genes and is partially dominant over resistance. Inheritance of pod shattering is influenced by non allelic interactions resulting in classical dominant epistasis and the pod shattering trait in soybean is highly heritable with narrow sense heritability of 0.79 but is not infuenced by maternal effects, ACKNOWLEDGEMENT The authors thank the National Agricultural Research Organisation of Uganda and the International Institute of Tropical Agriculture for funding the study. REFERENCES
The following images related to this document are available:Line drawing images[cs00022a.gif] | |||||||||||||||||||||||||||||||||||||||||||||||||||||||||||||||||||||||||||||||||||||||||||||||||||||||||||||||||||||||||||||||||||||||||||||||||||||||||||||||||||||||||||||||||||||||||||||||||||||||||||||||||||||||||||||||||||||||||||||||||||||||||||||||||||||||||||||||||||||||||||||||||||||||||||||||||||||||||||||||||||||||||||||||||||||||||||||||||||||||||||||||||||||||||||||||||||||||
| |||||||||
