 |
| About Bioline | All Journals | Testimonials | Membership | News |
|
||||||
|
||||||
African Crop Science Journal, Vol. 8. No. 3, pp. 301-309 VARIATION IN VIRULENCE PATTERNS OF SEPTORIA TRITICI ON TRITICUM AESTIVUM IN KENYA P.F. ARAMA, J.E. PARLEVLIET1, and C.H. VAN SILFHOUT2 (Received 5 March, 1998; accepted 14 March, 2000) Code Number: CS00032 INTRODUCTION The response of wheat cultivars (Triticum aestivum) to isolates of Septoria tritici is assessed by the quantification of symptoms (percentage necrosis and pycnidial coverage). The latter has epidemiological significance in the dissemination of the pathogen whereas the former may express a phenomenon associated with response to the toxic products of the pathogen. Knowledge of the physiologic specialisation of S. tritici is a necessary prerequisite to any reliable breeding programme for disease resistance (Eyal et al., 1973). Many researchers who studied this matter could not identify distinct races of the pathogen (Narvaez, 1957; Arsenijevic, 1965; Shipton et al., 1971; Perello et al., 1991). Physiologic specialisation in S. tritici was elucidated by Eyal et al. (1973) on the basis of the interactions between 14 bread and durum wheat cultivars and five Israeli isolates (from bread and durum wheats). The authors concluded that the significant cultivar x isolate interaction reflects specificity and that differentiation occurs also at the species level. Several reports have provided supportive data to indicate that physiologic specialisation exists in S. tritici and specificity is manifested both by host and pathogen (Yechilevich-Auster et al., 1983; Royle et al., 1987; Saadaoui, 1987; Ballantyne, 1989; van Silfhout et al., 1989; Diaz de Ackermann et al., 1994; Gilchrist, 1994; Kema et al., 1996). In most of these studies the magnitude of the interaction between cultivars and isolates was low and variable but statistically significant. Furthermore, it was strongly affected by the choice of the isolates and wheat differentials, environmental conditions and methodology. There are reports that aggressiveness rather than virulence explains the differences between isolates of S. tritici (Marshall, 1985; van Ginkel and Scharen, 1988). Van Ginkel (1986) used T. durum cultivars and isolates collected from both T. durum and T. aestivum cultivars. Based on percentage necrotic leaf area he could not ascertain a significant isolate x cultivar interaction. In view of the importance of the knowledge of virulence patterns of S. tritici for a sound breeding programme, the present study was undertaken to determine if isolates of S. tritici in Kenya differ in virulence. MATERIALS AND METHODS The pathogen. Diseased leaf samples were collected from all major wheat growing areas in Kenya. From the samples, 13 were selected to represent 13 isolates (Table 1). For comparison, three isolates collected from different regions in The Netherlands that had been previously studied and found to differ in virulence on wheat seedlings (Kema, G.H.J., pers. comm.) were included. For each isolate a leaf segment was attached to a glass slide and placed in a petri dish with filter paper saturated with sterile water on the bottom. The petri dish was closed to provide a moist environment for 4 hrs. The petri dishes were then transferred to a laminar-flow clean air cabinet bench. Oozing pycnidia were located under the stereoscopic microscope. With the help of a fine-pointed sterilised needle, a single cirrus was transferred to V8-juice agar medium in a petri dish for multiplication. The isolates were transferred to cryo-tubes and stored at -80 0C until the time of use. Isolates were grown for 5 days at 20 0C on petri plates of V8-juice medium. Before inoculation the isolates were suspended in distilled water and filtered through a double layer of cheese cloth. The concentration was determined and adjusted to 107 spores ml-1.
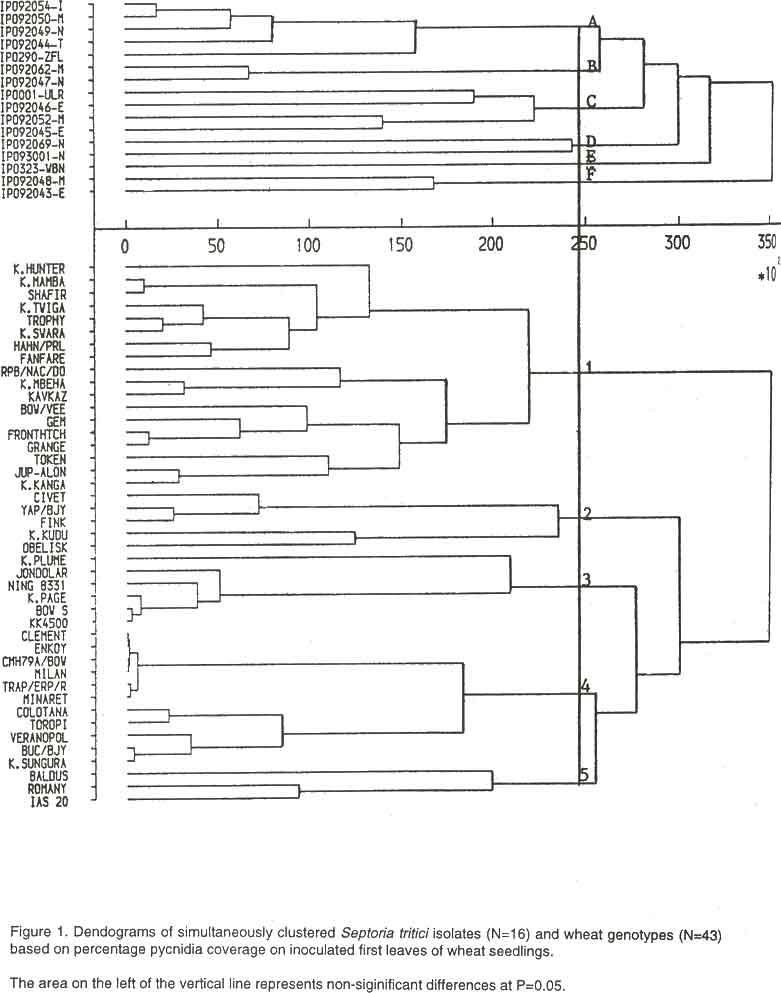
The host. The differential set used consisted of 43 cultivars. These included 14 cultivars that exhibited varying levels of resistance to septoria leaf blotch in the field in Kenya; 16 commercial cultivars from Kenya released between 1960 and 1975; 10 cultivars selected from the septoria differential set used at the Research Institute for Plant Protection (IPO), Wageningen, The Netherlands and three commercial spring wheat cultivars from The Netherlands. Ten to 15 seeds per entry were linearly sown in jiffy pots (7x7 cm) containing sterilised peat/sand mixture. Plants were grown in controlled walk-in climate chambers with similar pre- and post-inoculation conditions with respect to light intensity and day length (56µE sec-1 m-2 for 16 h day-1. Temperature and relative humidity (RH) conditions were 22/18oC (day/night rhythm) and >85%, respectively. Inoculation and disease assessment. The experiments comprised of sets of inoculations and were conducted according to a partially balanced incomplete design with respect to isolates, which allowed execution of three replicates over time. Quantitative inoculations were conducted by spraying spore suspensions, 30 ml/isolate supplemented with two drops of Tween 20 surfactant, on the cultivars that were randomised on a turntable, adjusted at 21 rpm, in a closed inoculation cabinet equipped with interchangeable atomizers and a water cleaning device to avoid contamination. Incubation was conducted under polythene-covered aluminum frames, to provide leaf wetness for 48 h. Emerging leaves were clipped 14 days after inoculation in order to facilitate light penetration to the primary leaves and disease assessment. Disease severity was evaluated 21 days after inoculation using two parameters; necrosis (N) and the presence of pycnidia (P), estimated as percentages of the total primary leaf area of individual seedlings. The values were averaged per pot for further analyses of the disease parameters N and P. Statistical analyses were conducted using the Genstat 5 package (Genstat 5 Committee, 1990) on the untransformed data. In order to reveal structures of the interactions between host and pathogen genotypes, the tables of means were subjected to a hierarchical agglomerative clustering procedure as described by Corsten and Denis (1990). The procedure groups rows and columns in the tables to identify a minimum number of groups that account for the overall interaction. The groups are internally homogenous. In each step of this sequential procedure, the mean square for interaction (MSint) is calculated for all possible sub-tables consisting of a pair of columns of the full table. The pair of rows or columns with minimal MSint is merged, giving an updated table, and the process is repeated. Thus, a sequence of amalgamations of rows and columns is produced, eventually leading to a two-by-two table. In this way the total sum of squares for interaction (S) is built-up from orthogonal increments, each connected with a merge as described to obtain insight into a possible structure of the interaction. Corsten and Denis (1990) formulated an F-test procedure to stop clustering just before S exceeds the critical value c(x) = ns2F(n,f,a), in which n = (number of isolates - 1) (number of cultivars - 1), s2 = an estimate of residual variance obtained independently from the two-way tables subjected to the cluster analysis, and F(n, f, a) = the upper a point of the F distribution with n and f degrees of freedom. This procedure determined which isolates or cultivars were significantly different from each other. RESULTS Cluster analysis of the percentage pycnidia (Fig. 1) indicated that there were six virulence groups A-F at the P=0.05 level of significance. Likewise the 43 cultivars were grouped into at least five resistance groups (1-5). The cultivars were separated into resistant and susceptible groups. The separation point between susceptibility and resistance for necrotic leaf area was 20% as proposed by Eyal et al. (1985) and Saadaoui (1987) whilst that for percentage pycnidia leaf area coverage was 10%. Dendograms in Figure 1 revealed that isolates in the same virulence group were not necessarily from the same location. For instance, isolate IPO92069-N in virulence group D was collected from Narok while IPO93001-N was from Njoro. The same applied to isolates IPO92048-M in virulence group F from Moiben and IPO92043-E from Eldoret. However, some isolates collected in the same location were clustered in the same virulence group like IPO92045-E (group C) and IPO92046-E both collected at Endebess. In Table 2 it was shown that the isolates in virulence groups B, C, D and F were virulent on cultivars in resistance group 1. Also isolates in virulence groups B and E had virulence for cultivars in resistance group 5. There was similarity in virulence for isolate in groups C and F. The three isolates collected from The Netherlands IPO290-ZFL, IPO001-ULR and IPO323-WBN were clustered in virulence groups A, C and E, respectively.
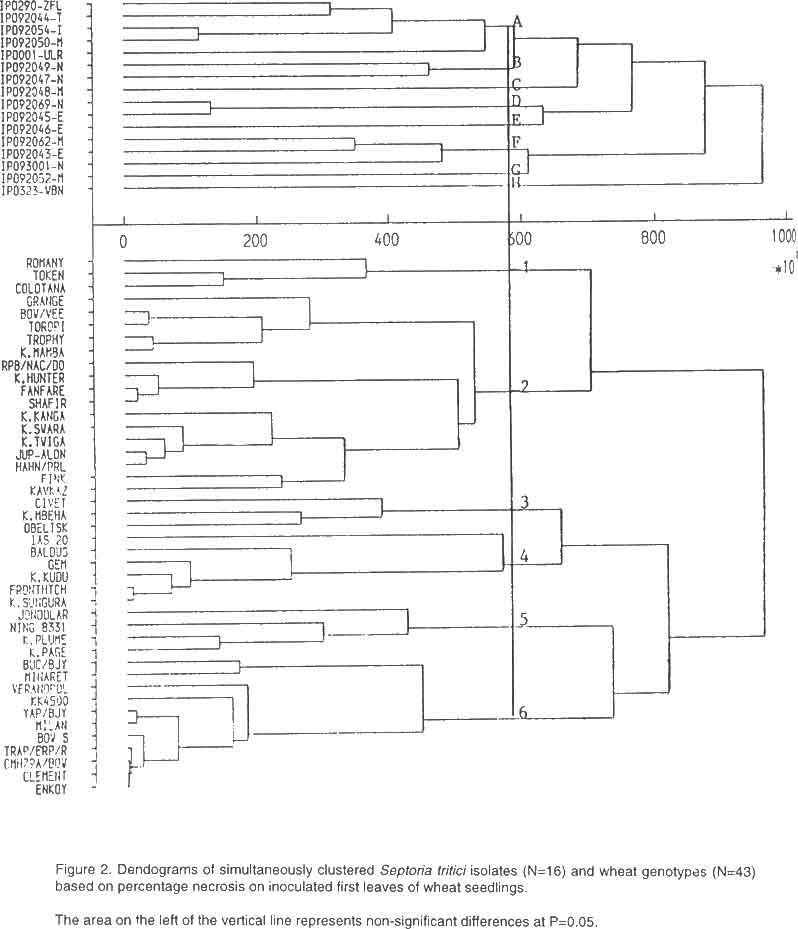
A similar cluster analysis was performed on necrotic leaf area (Fig. 2) The isolates were grouped into eight virulence groups and the cultivars into six resistance groups (P=0.05). The assignment of letters A to F for isolate virulence groups and numbers 1 to 5 for cultivar resistance groups in Figure 1 was independent from those of Figure 2. Grouping of individual isolates and cultivars in Figure 2 was different from that of Figure 1. Isolates IPO92045-E and IPO92069-N were in virulence group D (Fig. 2) and were in virulence groups C and D, respectively, in Figure 1. Another example was isolates IPO92047-N and IPO92062-M in group B (Fig. 1) and were in groups B and D, respectively (Fig 2). The most virulent isolates were in group G and the least virulent were in group E (Table 3). Cultivars in group 6 were resistant to all the isolates.
DISCUSSION The occurrence of pathogenic variation in virulence of S. tritici in Kenya suggests that breeding for resistance to the pathogen may not be as straightforward as previously believed. It is therefore highly advisable to intensify research in such areas as physiologic specialisation, inheritance of resistance and research for effective sources of resistance in order to control this important disease and develop new high yielding wheat cultivars capable of expressing their yield potential. The present study was a preliminary study into the S. tritici population in Kenya since sample studied was small (13). From this sample distinct virulence groups were identified. On further examination of these virulence groups the average disease severity was calculated and classified as susceptible (S) moderately resistant (MR) or resistant (R) (Tables 2 and 3). The variation in virulence in the S. tritici population in Kenya may dictate monitoring the pathogen populations to elucidate their relevance to the national programme. The choice of isolates for screening germplasm then becomes of special importance. In the germplasm screening for resistance to septoria tritici blotch at Njoro Research Centre, an isolate collected from the fields in the area represented by IPO93001 in virulence group F (Table 3) is often used for artificial inoculations. In such a situation the cultivars in groups 5 and 6 would be selected for their high resistance reaction based on percentage necrosis (Fig. 2 and Table 3). If these cultivars were later released as commercial cultivars and grown in areas where isolates in virulence groups D, E and G occur, they would be susceptible. The resistance provided by a specific cultivar should be investigated under a relevant virulence spectrum over time prior to its incorporation into a breeding programme. The relevance of virulence spectra can be assessed by monitoring the pathogen populations on a standard set of differential cultivars selected from national and international programmes. Such a standard set of cultivars has been suggested and composed by Gilchrist (1994) and is called the Septoria Monitoring Nursery (SMN). While this set of cultivars may form the basis for virulence studies in the future, supplemental cultivars of national importance should be included. In a previous study (Arama et al., 1989) no clearly distinguishable pathogenicity groups amongst Kenyan isolates could be detected. This could have been due to the cultivars used in the differential set which was composed of cultivars originating mainly from South America and Israel. It is likely that the pathogen population in Kenya is more adapted to the cultivars grown by the farmers. In that case the larger number of cultivars from Kenya used in this study enabled a better differentiation of the isolates from Kenya than in the previous study. Apart from lack of an agreed-upon standard differential set of cultivars, there are still a lot of inconsistencies in methodology, environmental conditions, culturing of isolates and cut-off points for separating resistance from susceptibility. This makes comparison among results obtained here, and elsewhere, difficult. The differences in groupings of isolates into different virulence groups when pycnidia and necrosis were analysed separately in this study suggested that the two parameters were independent of each other and may be influenced by different genes. Kema (1996) observed cultivar/isolate interactions with high necrosis-low pycnidia coverage and other interactions of high necrosis-high pycnidia in similar studies. Such interactions were also observed in this study (Table 4). The cultivar/isolate combination of Kenya Kudu and IPO92069 produced high necrosis accompanied with high pycnidia coverage. On the other hand, isolate IPO92054 produced high necrosis with low pycnidia coverage on Kenya Plume.
In conclusion, it is advisable to identify an isolate that represents the pathogen virulence of a region so that it can be effectively used to screen for resistant germplasm in the greenhouse or in the field. This study gives an insight into the virulence spectrum of S. tritici in Kenya. It is important to note that the number of isolates studied are quite few and it is possible that if a larger number of isolates was studied, a continuum of reactions between resistant and susceptible may be found. ACKNOWLEDGEMENTS This work was supported by the Kenya Agricultural Research Institute (KARI) and by the Dutch Ministry for International Co-operation (DGIS). The authors wish to thank the technical and support staff at each participating research institutes for their important role in trial execution and data collection. REFERENCES
The following images related to this document are available:Photo images[cs00032b.jpg] [cs00032a.jpg] | |||||||||||||||||||||||||||||||||||||||||||||||||||||||||||||||||||||||||||||||||||||||||||||||||||||||||||||||||||||||||||||||||||||||||||||||||||||||||||||||||||||||||||||||||||||||||||||||||||||||||||||||||||||||||||||||||||||||||||||||||||||||||||||||||||
| |||||||||
