 |
| About Bioline | All Journals | Testimonials | Membership | News |
|
||||||
|
||||||
African Crop Science Journal, Vol. 9. No. 2, pp. 401-409 The impact of close spacing on yield of arabica coffee under contrasting agro-ecologies of Ethiopia Taye KUFA, Tesfaye SHIMBER, Alemsged YILMA, Anteneh NETSERE and Endale TAYE (Received 10 October, 1999; accepted 17 December, 2000) Code Number: CS01022 INTRODUCTION Coffee (Coffea arabica L.), a perennial crop of high genetic diversity originated in the forest ecosystem of the south and South-western Ethiopia. It is cultivated within the elevation range of 1,000 to 2,100 meters above sea level (m.a.s.l.) where the average yearly precipitation is 1,500 to 2,000 mm. These offer the characteristic features for its sustainable cultivation as semi-wild or spontaneous and naturalised coffee plantation (Workafes and Kassu, 2000). That is why, on traditional smallholder coffee production farms, is a norm than exception and occupy an estimated area of about 350,000 hectares, which provide 95 to 97 % of the national production. The rest is obtained from modern coffee plantations of some 50,000 ha (Workafes and Kassu, 2000). In specific terms, more than 60% of the production is from the semi-forest coffee, 35% from small holdings and 2 to 3% from the plantations under the state farms. On the whole, coffee is considered the most important single commodity of the country since it contributes 60-70% of the foreign exchange earnings and 30% to direct governmental revenue. The crop is, thus, of cardinal importance with 8.4% output to the agricultural sector and on which 25% of the population depends for livelihood. The activities revolve around its production, processing and marketing. Yet, despite its important role in the national economy and given the wealth of genetic diversity and climatic suitability, the national yield average is 450-472 kg ha-1 of clean coffee (Workafes and Kassu, 2000). This stems from several production constraints, among which the most important could be the heavy dependence on unimproved coffee cultivars produced under poor management practices, including the low-density coffee planting patterns. This in the face of the scarce potential farmlands, largely aggravated by the rapidly increasing population pressure, will ultimately enhance horizontal expansion of coffee cultivation to marginal lands. In addition, the majority of coffee farmers in the country practice the old traditional cropping patterns, where the limited available farmlands remain less efficiently utilised. With this concern many research attempts have been made to generate technologies which help to attain high productivity per unit area by taking into account different crop intensification practices under distinct coffee growing environments (Yacob et al., 1996). In this regard, several multiple cropping patterns and coffee spacing trials have been conducted for the approved coffee berry disease (CBD)-resistant selections with three broad canopy spatial arrangements of open, intermediate and compact types (Yacob et al., 1993). The results, revealed consistently increased yield level with increasing population densities from 4,000 to 6,000 tree ha-1 and number of bearing heads (IAR, 1996; Yacob et al., 1996). This paved way for further progress towards investigating high density planting as an alternative option of coffee intensification under Ethiopian conditions. The physiological aspects and yield benefits of high tree population have been documented in Ethiopia (Yilma, 1985) and elsewhere in the major coffee growing countries (Browning and Fisher, 1976; Kumar, 1978; Wringley, 1988). Though there is immense potential of genetic and environmental components in most coffee growing areas, the benefits of high density planting pattern is, however, not fully exploited in Ethiopia. Yet preliminary findings show better vegetative growth performances of two distinct coffee cultivars planted using a high density planting system at Jima (Taye, 1996). Maximum coffee yield due to increasing number of bearing heads has been documented by Yacob et al. (1993). The advantages of close spacing in tree crops, however, depend on several factors among which are climatic conditions, coffee variety, soil fertility, pruning systems, cropping patterns and level of management inputs to be applied. Given this background and with the view to achieve yield benefits from high density planting, a research was initiated to identify the best suitable coffee spacing for a given agroecological zones. Hence, the present work was designed to investigate some of these aspects by evaluating the yield performance of coffee berry disease (CBD) resistant Arabica coffee cultivars under a wider range of population densities. The specific objective of the study was to assess the effectiveness of close spacing towards promoting the productivity of Arabica coffee cultivars at three agro-ecological zones of the country. MATERIALS AND METHODS The experiment was conducted for eleven years (1988/89 - 1998/99) at three Coffee Research Centres that are found in the major coffee growing ago-ecological zones of the country. These include Tepi (1200 m a.s.l.), Wenago (1850 m a.s.l.), and Gera (1900 m a.s.l.), representing low, medium and high altitude areas, respectively. Except for Wenago in southern Ethiopia with bimodal rainfall, the others are located in southwestern part of the country where mono-modal rainfall is the main feature. Nitosols are the dominate coffee soils in Ethiopia (Paulos, 1997). A summary of the environmental attributes and the long-term meteorological data of the study sites are shown in Table 1.
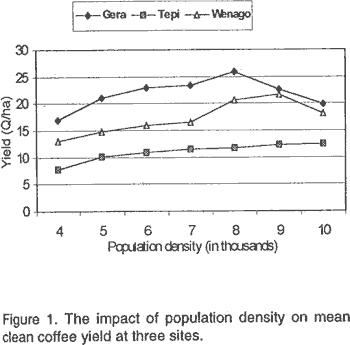
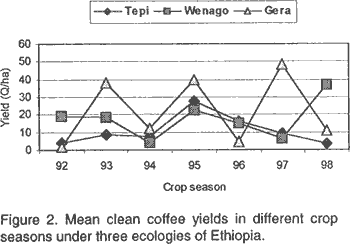
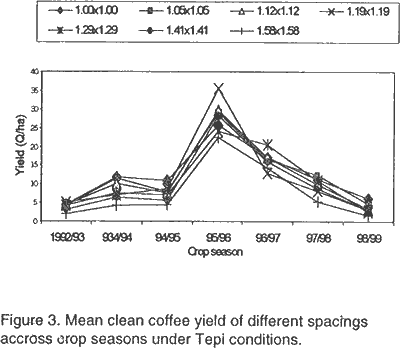
A randomised complete block design was used, whereby the yield response of CBD-resistant coffee selection under different close spacing or high population density was evaluated. The spacings included: 1.0 m x 1.0 m, 1.05 m x 1.05 m, 1.12 m x 1.12 m, 1.19 m x1.19 m, 1.29 m x1.29 m, 1.41 m x1.41 m, 1.58 m x 1.58 m giving population densities of 10,000, 9,066, 7,974, 7,062, 6,010, 5,030 and 4,006 trees ha-1, respectively. A known coffee cultivar, which is adaptable as well as the best suitable to high density planting systems was planted at each study site. The treatments were replicated three times with a plot consisting of 12 trees. In this case, an intermediate coffee type (7454) at Gera and Wenago and a compact type (74110) at Tepi were evaluated for yield responses under high density planting system. Except for the experimental variables, all routine field management activities were uniformly and timely applied as per the recommendations of each agro-ecological zone (IAR, 1996). These include frequent weeding, inorganic fertiliser applications, partial pruning, shade regulation and other operations. The trees on each plot were allowed to freely growth with a view to determine the efficiency of close spacing and, thus, identify optimum period of cycle conversion under different field conditions. Depending on the localities, the trees started to bear the first crop after the third to fourth years of field transplanting and red fresh cherries were harvested from each plot and weighted. The result was multiplied by a factor (0.166) to convert into a clean coffee yield and reported in quintal per hectare (Q ha-1), where 1Q equals 100 kg. The yield data recorded for each crop season were analysed using an MSTAT-C computer programme and the combined analysis was made according to the procedures described by Gomez and Gomez (1984). Treatment mean separation was accomplished according to Fisher’s least significant difference test at 5% probability level. RESULTS AND DISCUSSIONS Tepi. Coffee yield data of close spacing treatment for each crop season are shown in Table 2. The results revealed that at the early crop year (1992/93), low and non-significant yield levels were obtained. However, yield increased with increasing population densities from 4,006 to 10,000 trees ha-1 with the highest value (5.06 Q ha-1) recorded for a population density of 7,062 trees ha-1. Thereafter, the treatments had significant effects for three consecutive years (1993/94-1995/96) when yield still continued to increase due to close spacing. Thus, the highest values were recorded in 1993/94 and 1995/96 at the closest spacing of 1.0 m by 1.0 m or 10,000 trees ha-1 (Fig. 1). During the subsequent two crop years of 1996/97 and 1997/98, the impact of spacing, however, disappeared and yield tended to decline, giving the respective yields of 16.33 to 9.45 Q ha-1 (Table 2; Fig. 2). The adverse effect of the highest population densities were more noticed during the latter crop season with low values recorded under all spacing treatments, except the closest spacing of 1.0 m by 1.0 m with mean clean coffee yield of 6.24 Q ha-1 (Table 2; Fig. 3). In other words, low yield performances even below the national average yield level of 5 Q ha-1 were recorder with decreasing population density or increasing spacing. Consequently, the least mean yield of 3.50 Q ha-1 was obtained during the seventh crop season (1998/99), indicating the reduced efficiency of close spacing for a compact coffee cultivar-74110 at this stage. This, therefore, suggests the need to thin out trees to a population density not exceeding 5,000 trees ha-1 and, thus, minimise the risks of dark respiration or competition for the available resources. Otherwise, high management inputs should be applied with the aim to maintain optimum vegetative and reproductive capacity of the trees and, thus, sustain the present yield benefits under the hot warm humid lowland Tepi conditions. This is quite similar to the findings of Kumar (1978) in Kenya and Akunda et al. (1979).
The results of the combined analysis of variance also revealed highly significant yield variations among crop seasons and its interactions with spacing (Table 2; Fig. 1). The yield performance of coffee trees due to spacing was, however, non-significant, though yield levels tended to increase with decreasing population densities. Accordingly, the overall mean yields ranged between 7.73 Q ha-1 and 12.45 Q ha-1 at a population density of 4,006 and 10,000 trees ha-1, respectively. Wenago. Maximum and highly significant yield variations due to population densities were noticed at the early stages of the stand. Consequently, yield increased with decreasing spacing, with the highest values recorded above population density of 7,974 trees ha-1. In contrast, the lowest yield was obtained at the third crop year with mean yield of 3.76 Q ha-1, when there was no-significant differences among the spacing treatments (Table 3). This could partly be attributed to the early heavy crop bearing of the trees and biennial bearing nature of the crop with ultimate maximum yield levels for the next two consecutive crop years, when the treatments had also more than 7,062 trees ha-1. Such treatment difference, however, did not occur during the 1997/98 crop season where very low yields were obtained perhaps due to reasons mentioned earlier. The best yield performance was recorded at tree populations ranging between 7,062 and 7,974 trees ha-1, with the respective mean values of 7.79 and 12.66 Q ha-1 (Table 3). Non-the-less, these densities may not be preferred, as the yield performances over years were not consistent. Hence, it seems that a population density of 7,062 trees ha-1 with minimum seasonal variation could be preferred to the other spacing treatments. On the other hand, significant and maximum yield response occurred during the last crop season of 1998/99, with the highest yields recorded for the closest spacing or highest population densities (Fig. 1). This indicated prolonged efficiency of close spacing at this particular site.
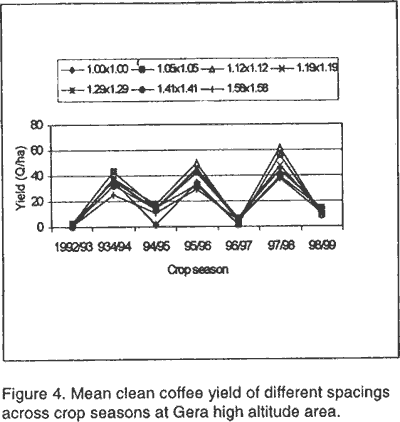
The results of the combined analysis revealed that yield responses differed highly for crop seasons where the highest yield was obtained in 1998/99 (37.07 Q ha-1) and in 1995/96 (22.44 Q ha-1) (Table 3; Fig. 2), largely indicating the biennial bearing nature of the trees. Yield variation arising from spacing and spacing by crop season interaction was not significant. However, the yields increased with increasing density planting, where maximum values were recorded at populations greater then 7,974 trees ha-1 (Table 3). Here, the reduced yield variability at high population densities also shows the improved yield advantages of close spacing pattern under the mid-altitude Wenago areas. Similar results have been reported by other authors (Browning and Fisher, 1976; Mitchell, 1976; Kumar, 1978), who indicated the improved efficient utilisation of closely spaced coffee trees in relation to the use of the major external yield limiting variables such as light, water and plant nutrients. Gera. Yield results show similar trends to those of Tepi, where low and non-significant response was noted at the early crop stage. The effect of spacing was evident and highly significant starting from the second crop and continued upto the fourth. Thereafter, yields differed non-significantly and were inconsistent. However, in 1996/97, populations that ranged from 4,006 to 7,062 trees ha-1 had yields greater than the overall mean yield of the year (4.36 Q ha-1) (Table 4). In contrast, maximum values were obtained at all spacing treatments in the following year (1997/98), especially at the closest spacing with population density ranging from 7,062 to 10,000 trees ha-1 and the highest value (61.84 Q ha-1) was recorded at 7,974 trees ha-1. Consequently, more production was recorded due to high population density planting in coffee at Gera. Under the Tepid to cool sub-humid high altitude of Gera, the biennial bearing nature of coffee trees was also noticed with the highest mean clean coffee yield of 48.69 Q ha-1 obtained at the sixth crop season in 1997/98 , followed by the fourth, second and third cropping years (Table 4; Fig. 2).
There were highly significant yield differences due to crop year, spacing and their interactions. The fourth and sixth crops had higest values compared with the rest of the years (Table 4; Fig. 4). This largely indicates the biennality problems that is evidenced from the high yield variations observed at high population densities. This could partly show the slow vegetative growth rates of coffee tree with reduced competition even during the latter crop year. In other words, the intermediate coffee cultivar-7454 did not close up and, thus, its yield remains increased due to close spacing. Such benefit at high population density under humid Gera conditions could be attributed to, not only the slow vegetative growth rate of coffee trees with minimum adverse competition effects even during the latter crop year, but also to the sufficient amount of soil moisture and plant nutrients (Paulos, 1997). The present findings support the results of Kumar (1978). Thus, the cycle conversion for the coffee cultivar 7454 at the seventh crop year is uneconomic, some other optimum management activities could be applied to maintain the efficiency of close spacing on the yield of coffee trees in the area. Similarly, the overall mean yields decreased with decreasing population densities with the highest yield of 25.84 Q ha-1 recorded at a population density of 7,947 trees ha-1 (Table 4; Fig. 1). The low yield level obtained at the lowest populations could partly be attributable to the reduced efficiency of coffee trees in terms of exploiting natural resources under such micro-climates (Gathara and Kiara, 1985; Terene et al., 1991). SUMMARY AND CONCLUSIONS Close spacing significantly promoted the yield responses of Arabica coffee cultivars under three contrasting coffee growing areas during the different crop seasons. Increased yield levels up to the last crop season, except at Tepi lowland areas were recorded. The impact was greater when the trees bore heavy crops. At Wenago where the trees carried heavy crops at the early stage, yield tended to decline at the later periods, fourth and sixth crop years, though maximum yield levels were recorded at the last crop year. Here, the overall mean yield results did not differ due to spacing and spacing by crop year interactions. This was in contrast to the other two sites where such early yield performance was not observed, probably due to the use of compact coffee cultivar and slow vegetative growth natures at Tepi and Gera, respectively. Consequently, consistent and maximum yield was noted at population density ranging between 7,062 and 10,000 trees ha-1, though it varied for each site. As a whole, yield benefits of close spacing varied according to crop bearing capacity of the tree, suggesting the options either to earn high early investment or to promote the productive life span of the farm. At Tepi, a hot to warm area, reduced efficiency of close spacing for the compact coffee cultivar was noticed after about the sixth crop season and, thus, optimum cycle conversion techniques to a population density not exceeding 5,000 tree ha-1 should be sought. Whilst, at Gera and Wenago, the results showed more yield benefits of close spacing and it would be more sustained if optimum management inputs are applied to minimise biennial bearing natures of the trees. This would not only ensure high productivity, but also prolong the lifespan of coffee trees. However, investigations should continue to further evaluate the response of different coffee cultivars in the pipeline, largely by considering such aspects as the number of bearing heads, canopy spatial arrangements and yield responses in relation to soil moisture and nutrients. Thus, it is still necessary to determine the optimum cultural practices including the right stage of cycle conversion as well as the agronomic and economic feasibility of high density planting in coffee under the major coffee growing agro-ecological zones of Ethiopia. REFERENCES
The following images related to this document are available:Line drawing images[cs01022a.gif] [cs01022b.gif] [cs01022d.gif] [cs01022c.gif] | ||||||||||||||||||||||||||||||||||||||||||||||||||||||||||||||||||||||||||||||||||||||||||||||||||||||||||||||||||||||||||||||||||||||||||||||||||||||||||||||||||||||||||||||||||||||||||||||||||||||||||||||||||||||||||||||||||||||||||||||||||||||||||||||||||||||||||||||||||||||||||||||||||||||||||||||||||||||||||||||||||||||||||||||||||||||||||||||||||||||||||||||||||||||||||||||||||||||||||||||||||||||||||||||||||||||||||||||||||
| |||||||||
