 |
search
for |
| About Bioline | All Journals | Testimonials | Membership | News |
|
||||||
|
||||||
African Crop Science Journal, Vol. 9, No. 1, March 2001, pp. 17-23
G. Abalo, J. J. Hakiza1, R. M. Kakuhenzire1, R. El-Bedewy2
and E. Adipala
Code Number: CS01030 ABSTRACT Twelve potato genotypes including two checks were evaluated for yield and resistance to late blight. Weekly assessments of late blight severity were done using a 1-9 CIP scale and percentage leaf area affected. In 1998A all genotypes yielded better than the local checks (Kisoro and Victoria) except for 391558.16 that yielded lower than Victoria. In 1998B only 4 genotypes (389685.2, 389698.12, 389584.33 and 391557.1) performed better than the local checks, while in 1999A only 3 genotypes performed better than the local checks. Better yields were recorded in 1999B, which ranged from 15.2 to 44.7 Mt ha-1. The average yields for the genotypes in four seasons were 21.7, 16.7, 20.2 and 29.8 Mt ha-1, respectively. All genotypes showed higher levels of resistance to late blight than Victoria (28.8%), except 389484.20 in 1998B with AUDPC of 28.8%. Field evaluation at the two sites in 2000B generally showed a similar trend. The promising clones are undergoing multilocational trials in different parts of Uganda. Key Words: Genotype evaluation, late blight resistance, Kisoro, Victoria, Uganda RÉSUMÉ Douze génotypes de pomme de terre comprenant deux témoins ont été évalués pour le rendement et la résistance au mildiou. Des évaluations hebdomadaires de la sévérité du mildiou ont été faites à base d'une échelle de 1-9 du CIP et le pourcentage de la surface foliaire affectée. En 1999A, tous les génotypes ont eu de bons rendements plus que les témoins locaux (Kisoro et Victoria) à part le génotype 391558.16 qui eut un rendement inferieur à celui de Victoria. En 1999B, seulement 4 genotypes (389685.2, 389698.12, 389584.33 et 391557.1) ont eu des rendements meilleurs plus que les témoins locaux, alors qu'en 1999A seulement 3 genotypes ont eu des performances supérieures à celles des témoins. Les meilleurs rendements ont été observés en 1999B variant de 15.2 à 44.7 Mt ha-1. Les rendements moyens de tous les génotypes à travers les 4 saisons étaient de 21.7, 16.7, 20.2, et 29.8 Mt ha-1 respectivement. Tous les génotypes ont montré un niveau de résistance élevé au mildiou plus que Victoria (28.8%), excepté 389484.20 en 1998B ayant un AUPD de 28.8%. L'évaluation des champs pour les deux sites en 2000B a montré une situation générallement similaire. Les clones prometteurs sont entrés d' être évalués dans les essais multilocaux dans les différentes parties de l'Uganda. Mots Clés: Evaluation des génotypes, résistance au mildiou, Kisoro, Victoria, Uganda INTRODUCTION The potato (Solanum tuberosum L.) is the world's fourth most important food crop (Fehr, 1987), but with increasing production in most of the developing countries. Over the past decade, both the area planted and the production of potato has increased faster than the human population in sub-Saharan Africa. This is quite different from the picture for maize and other grains, for which production has not kept pace with demand (PRAPACE, 1998). Potato has become an important staple and cash crop in highland production zones, and is a highly preferred food in urban areas (Akimanzi, 1982; Low, 1997). The highland areas of Western Uganda (Kabale, Kisoro, Mbarara, Kasese), Eastern (Mbale, Kapchorwa) and north western (Nebbi, Arua) are the main potato growing areas in Uganda although some mid elevation areas like Mityana, Masaka and Rakai are increasingly growing the crop (Sikka et al., 1991; Hakiza et al., 1997a). Yields per unit area at farm level are still disappointingly low in Eastern Africa, with a mean range of 2.7 t ha-1 in Kenya to as high as only 8.0 t ha-1 in Ethiopia (PRAPACE, 1998) and 7.0 t ha-1 in Uganda (FAO, 1999; Adipala et al., 2000). However, there is still high potential for growth, as indicated by the big yield gap. For example, in the case of Uganda, FAO (1999) gives average yield estimate of 7.0 Mt ha-1, as compared to 25 Mt ha-1 under good management (Hakiza et al., 1997b), 15 Mt ha-1 under improved management and 5 Mt ha-1 under poor management (PRAPACE, 1998). Yet there is increasing demand for potato, as a result of spiraling population increase in the region, urbanisation and development of specialised potato processing plants. In most parts of the East African highlands, efforts to obtain high potato yields are being curtailed by limited availability of good quality seed at affordable prices and severe epidemics of late blight caused by Phytophthora infestans (Mont.) De Bary (Hakiza et al., 1997b; Adipala et al., 2000). In response to these problems and the demand for increased potato output, evaluation and selection of late blight resistant and high yielding genotypes remain the focus of most national potato breeding programmes in eastern, central and southern Africa (Hakiza et al., 1997b; PRAPACE, 1998). In collaborative research between the Uganda's Ministry of Agriculture, International Potato Centre (CIP) and Makerere University to improve potato production in Uganda, Kalengyere Research Station receives a diverse pool of potato genotypes from CIP. In 1992 Kalengyere Research Station received 113 potato clones in the 389 series and 119 in the 391 series from CIP, Lima. These underwent a series of evaluation and subsequent selections on basis of high yield potential, desirable growth, tuber characteristics and resistance to potato viruses X and Y. By the end of 1997, 5 promising genotypes were selected for advanced yield trials from each of the series and the rest discarded on the basis of low yield, late blight susceptability and poor agronomic characters. This paper presents the results of the advanced yield trial whose aim was to identify late blight resistant and high yielding potato genotypes among the selected genotypes. MATERIALS AND METHODS The study was conducted in Southwestern Uganda at Kalengyere (2450 m above sea level) and Kachwekano (2200 m above sea level). Ten potato genotypes; 389484.20, 391558.16, 391558.5, 391558.13, 389698.12, 389701.34, 391557.1, 389685.2, 389558.11 and 389584.22, and two local checks (Kisoro and Victoria) were used. The experiments were established in a randomised complete block design (RCBD) with four replications. A spacing of 70 cm x 30 cm in 4-row-plots of 4.5 m was adopted at both sites. The trial was conducted during the first season (A) and second (B) seasons of 1998 and 1999 for Kalengyere and only during the first season of 1999 at Kachwekano. Normal agronomic practices were carried out including regular weeding, earthing-up and 2 prophylactic sprays of Dithane M45 (Mancozeb 80% WP) were administered. To test the resistance of the genotypes without the prophylactic sprays, the experiment was repeated in 2000B at both locations. A susceptible variety (Victoria) was planted 2 weeks earlier as guard rows and was inoculated artificially with a zoospore suspension of P. infestans at a rate of 5 x 10⁻⁴ zoospores ml-1 based on an earlier study (Singh and Bhattacharyya, 1995). Weather data were recorded at each site (Fig. 1). Disease and yield assessment. Weekly assessments of late blight severity were done using a 1-9 CIP scale where 1 is equivalent to no infection and 9 is 100% infection (Henfling, 1987). Late blight scores were used to calculate areas under disease progress curves (AUDPC) which were subsequently standardised to give relative AUDPC (Campbell and Madden, 1990). At harvest, tuber yields were assessed based on number of tubers per plant and mean tuber weight (g); these values were used to calculate the overall yield (Mt ha-1). AUDPC values and yield data were then subjected to analysis of variance (ANOVA) using the Mstatc computer package (Russell, D. Freed, Michigan State University, USA). Where the "F" statistics indicated significance, the means were separated using Fisher's protected Least Significance Difference test (LSD) at P= 0.05. RESULTS The 1998 and 1999 trials. The analysis of variance (ANOVA) results for AUDPCs and yield indicated significant differences among the genotypes within and across seasons (Table 1). There was also a significant interaction between season and genotypes for both AUDPC and yield and hence, data are presented for these interactive effects (Tables 2-4 ). Late blight infection occurred in 1998 and during 1999B seasons. However, LB occurrence in 1999A was negligible. In 1998A five of the genotypes showed high levels of resistance to late blight (relative AUDPC values below 13 %) and the other five moderate levels of resistance with relative AUDPC values ranging from 18 to 26.7 % (Table 2). The latter showed better resistance to late blight than the check (Victoria) whose relative AUDPC value was 28.8%. In 1998B, all the genotypes showed high levels of resistance to late blight except 389484.20 with relative AUDPC of 28.8%. Generally, however, the AUDPC values in 1999B were low and ranged from 2.3 to 16.1%. The across season analysis showed that all the genotypes had higher levels of resistance to late blight than Victoria (Table 2). In all the four seasons of the trial, yields varied significantly (P = 0.05) among the genotypes and seasons (Table 3), and ranged from 15.8 to 30.5 Mt ha-1, 2.8 to 26.3 Mt ha-1, 3.6 to 15.7 Mt ha-1 and 15.2 to 44.7 Mt ha-1, respectively. Across seasons analysis revealed that five genotypes had higher yields than the checks. The least yield (14.0 Mt ha-1) was registered by genotype 391558.16 while genotype 389685.2 recorded the highest (25.3 Mt ha-1). Tuber multiplication rates also varied significantly (P = 0.05) within and across the seasons (Table 3). The highest rate was recorded in 1999B, with 4 to10 tubers plant-1. Mean tuber weights were highest in 1999B, ranging from 82.4 to 137.1g tuber-1. The second site (Kachwekano) had significantly higher yields than those obtained at Kalengyere (Table 4). The average yield for the season at Kachwekano ranged from 18.2 to 61.2Mt ha-1, in comparison to 15.2 - 44.7 Mt ha-1 for the same season at Kalengyere. At Kachwekano, only three genotypes had higher yields than the two local checks. There was no late blight infection at Kachwekano during the season. The 2000B trial. Late blight infection occurred in both locations during
the season. The guard row Victoria had a relative AUDPC of 35.8% but the test
genotypes registered low AUDPC values. In both locations, the genotypes, even
under artificial inoculation, showed high levels of resistance to late blight
than the local checks, but there was no consistent trend at Kachwekano (Table
5). The AUDPC values of the test genotypes ranged from 5 to 18.9% (at Kalengyere)
and 7.4 to 14.4% (at Kachwekano) and were not significantly different from the
range of the mean AUDPCs for the 3 seasons (i.e., 1998A, 1998B and 1999B) at
Kalengyere. Of the10 genotypes, those from the 389 series showed higher levels
of resistance to late blight as compared to those from the 391 series although
the difference was not significant at Kachwekano. DISCUSSION The variations in the yields from season to season were due to variation in weather conditions and different levels of late blight epidemics. The lowest yields realised in1999A were due to short period of rain followed by dry weather which hindered tuber bulking. The genotypes reacted variably to late blight, resulting in a high coefficient of variation (51.2%). Similar results were reported by Martin et al. (1995) and Hakiza et al.(1997b). The higher yields realised in 1999B were partly due to ample long rains during the season and also due to low levels of late blight epidemic. The higher yield recorded at Kachwekano in the same season was due to complete absence of late blight and enough moisture for bulking. Interestingly, during 2000B, late blight severity and potato yields were lower at Kachwekano than at Kalengyere but this was due to the lower rainfall at Kachwekano. The best genotype yielded on average 25.3 Mt ha-1 and the poorest, 14 Mt ha-1 which were all higher than the current national average yields of 7.0 Mt ha-1 (FAO, 1999; Adipala et al., 2000). Only four genotypes had yields lower than Victoria, but the difference was not significant (P >0.05). Late blight relative AUDPC and yield were highly and negatively correlated (r = -0.54: P = 0.01) which implied that the disease was probably contributing to significant yield reduction (Martin et al., 1995). Genotypes 389584.22, 389685.2, 389698.12, 391557.1, 389484.20, and 3891558.11 were ranked the best based on yields and levels of resistance to late blight. The 2000B experiment which was carried out with artificial inoculation using late blight oospores and without any prophylactic application, was to confirm resistance levels of the genotypes. The results confirmed that the genotypes have high levels of resistance to late blight given the high disease pressure they were exposed to and in relation to the disease on the susceptible check (Victoria). However, the lower yields recorded were partly due to late planting. This was apparent from the high yields (20.3 Mt ha-1) obtained at Kachwekano from the Victoria guard rows planted 2 weeks earlier and had high AUDPC (35.8%); it yielded significantly higher than the Check Victoria (5.0 Mt ha-1) planted 2 weeks later and with lower AUDPC (10.9%). The significant differences in performance of the genotypes across seasons and locations could be due to differences in environmental conditions, and indicate a significant genotype by environment interaction (Ngeve, 1993; Vargas et al., 1999). For a country with many diverse agroecologies like Uganda, selecting for broad adaptability may be of limited value when genotype x environment interactions (G x E) are present. G x E studies are therefore paramount in the specific environment where the genotypes are expected to be grown by farmers (Ortiz and Ilse de Cauwer, 1999). Since the data presented were generated in southwestern Uganda, the promising genotypes are undergoing multi-location evaluation to test their adaptability and reaction to late blight in different potato growing environments of the country. ACKNOWLEDGEMENT
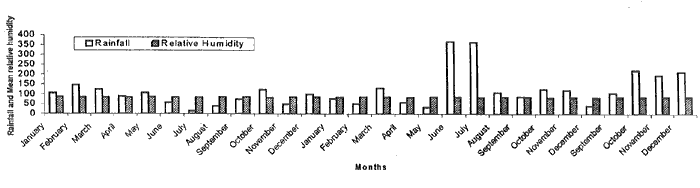
Figure 1. Rainfall and mean relative humidity during 1998/99 and 2000B. TABLE 1. Summary of ANOVA for across seasons evaluation of 12 potato genotypes for resistance to late blight and yield
* Significant at P < 0.05; AUDPC = Area under disease progress curve
TABLE 2. Relative area under disease progress curves (AUDPC) for late blight on twelve elite potato gnotypes at Kalengyere during first (A) and second (B) seasons of 1998 amd second season on 1999.
* Negligible late blight developed during first season of 1999 at Kalengyere
TABLE 3. Yield performance of 12 potato genotypes at Kalengyere during the first (A) and second (B) seasons of 1998 and 1999
TABLE 4. Yield performance of 12 potato genotypes at Kachwekano during the second season of 1999
* No late blight development during 1999B
TABLE 5. Relative areas under disease progress curves of late blight on 12 potato genotypes at Kalengyere and Kachwekano during 2000B
TABLE 6. Yield performance of 12 potato genotypes at Kalengyere and Kachwekano during 2000B
The following images related to this document are available:Line drawing images[cs01030a.gif] | |||||||||||||||||||||||||||||||||||||||||||||||||||||||||||||||||||||||||||||||||||||||||||||||||||||||||||||||||||||||||||||||||||||||||||||||||||||||||||||||||||||||||||||||||||||||||||||||||||||||||||||||||||||||||||||||||||||||||||||||||||||||||||||||||||||||||||||||||||||||||||||||||||||||||||||||||||||||||||||||||||||||||||||||||||||||||||||||||||||||||||||||||||||||||||||||||||||||||||||||||||||||||||||||||||||||||||||||||||||||||||||||||||||||||||||||||||||||||||||||||||||||||||||||||||||||||||||||||||||||||||||||||||||||||||||||||||||||||||||||||||||||||||||||||||||||||||
| |||||||||
