
|
African Crop Science Journal
African Crop Science Society
ISSN: 1021-9730 EISSN: 2072-6589
Vol. 9, Num. 3, 2001, pp. 577-590
|
African Crop Science Journal, Vol. 9. No. 3, pp. 577-590
SHORT COMMUNICATION
THE EFFECT OF LIGHT INTENSITY ON THE GROWTH, DEVELOPMENT
AND YIELD OF SOYBEAN IN SOUTHWEST NIGERIA
F. O. ODELEYE, A.O. TOGUN and T.O. TAYO1
Department of Crop Protection and Environmental Biology, University of Ibadan,
Ibadan, Nigeria
1College of Plant Science and Crop production, University of Agriculture,
Abeokuta, Nigeria
Received 10 September, 1999
Accepted 1 February, 2001
Code Number: cs01076
ABSTRACT
Soybean (Glycine max (L.) Merrill) is an important cheap
source of plant protein in Nigeria. Its production is constrained by low light
intensity in the southern rainforest ecology due to cloud cover during the production
season. Understanding the physiological basis of performance under low light
intensity is therefore central to efforts geared towards the crop's productivity
improvement in the zone. Soybean plants were subjected to two weeks of 75 and
50% daylight regimes at the vegetative (V4-5); early flowering (R2); and pod
filling (R5) stages of growth. Full exposure or 100% daylight served as the
control. In the field and pots, the 75% and 50% light intensities (obtained
by covering cages with one or two layers of 1mm mesh net, respectively) significantly
enhanced the vegetative growth over plants grown under 100% light intensity.
Plants grown under 50% light reduction (L2 plants) had significantly (P=0.05)
higher leaf area plant-1, stem height plant-1 and number
of branches plant-1 than plants grown under 75% light intensity (L1
plants). Similarly, L1 plants had higher values of these vegetative parameters
than plants grown under 100% light intensity (L0 plants). Generally, the results
of the pot and field trials were similar. Reduced light regimes led to a higher
accumulation of dry matter in the various plant parts particularly when imposed
at the vegetative stage of growth. Additionally, reduced light regimes led to
reduced leaf chlorophyll concentration and a general reduction in yield. The
highest reduction in yield resulted from 50% light intensity imposed for two
weeks at the pod filling stage of growth. In pots the seed dry weight plant-1
of L0, L1 and L2 plants were 40.6g, 30.4g and 23.3g, respectively. While for
the field trials, the seed dry weight plant-1 for L0, L1, L2 plants
were 37.3g, 34.3g and 32.5g, respectively. The seed dry weight plant-1
for light reduction at the vegetative stage (35.5g) was similar to that at the
early flowering stage (35.5g) but was significantly higher than the seed dry
weight plant-1 at the pod filling stage (33.2g). Results reveal that
reduced light intensity was most damaging to soybean performance at the pod
filling stage and the lower the light intensity the greater the yield reduction.
Key Words: Chlorophyll content, Glycine max, light intensities,
soybeans, stage of growth, yield
Résumé
Le soja (Glycine max (L.) Merrill) est une source importante et bon marché
de proteines végetales au Nigeria. Sa production est contrainte par la
faible intensité lumineuse dans l'écologié de forêt
pluvieusedu sud due à la couverture des nuages pendant la saison de production.
Comprendre les bases physiologiques de la performance sous la faible intensite
lumineuse est par consequent centrale pour l'amélioration des efforts
dans la zone. Les plantes de soja ont été soumises à deux
semaines de 75 et 50% de régime de lumierè du jour a l'étape
de croissance végétative (V4-5); defloraison precoce (R2) et de
remplissement de gousses( R5), 100% de la lumiere journaliere a servi de contrôle.
Sur le champs et dans les pots, les 75% et 50% d'intensité lumineuse(obtenue
par cages couverte avec une ou deux couches de 1mm mailles de filet, respectivement)
d'une manière significative ont accrue la croissance végétale
par rapportux plantes poussant sous 100% d'intensité lumineuse.
Les plantes poussant sous 50% de lumière réduite (plantes L2)
ont eu de manière significative (P=0.05) le nombre élevé
de feuilles par plante, surface de feuilles par plante, hauteur de tiges par
plantes et le nombre de branches par plante que les plantes cultivées
sous 75% d'intensit' lumineuse (plantes L1). Similairement, les
plantes L1 ont eu des valeurs élevées de ces paramètres
végétaux que les plantes poussant sous 100% d'intensite
lumineuse (plantes L0). Généralement, les résultats des
essais des pots et du champs étaient les mêmes. Les régimes
lumineux réduits ont entrainé une grande accumulation de la matière
séche dans les differentes parties des plantes particulièrement
quand où impose l'etape végétative de dévelopement.
Les régimes lumineux réduits ont conduit à la réduction
de la concentration de la chlorophylle par feuille et en générale,
la réduction en production. La plus grande réduction en rendement
a résulté de 50% de lumière imposée en deux semaines
à l'tape du development du remplissage des gousses. Dans les pots,
le poids des graines par plant de plantes L0, L1 et L2 ont été
de 40.6g, 34.4get 23.3g, respectivement. Alors que sur le champs, la matière
séche des graines par plante pour la réduction lumineuse à
l'etape végétative (35.5g) était similaire à
celle des plantes à l'etape de floraison précose (35.5g)
mais significativement élevée que les poids de graines par plante
de l'étape de remplissement des gousses (33.2g). Les résultats
ont montré que l'intensité lumineuse réduite pour
deux semaines étaient plus destructive à la performance du soja
à l'étape de remplissement de la gousse et plus faible était
l'intensité lumineuse, plus grande était la reduction de
rendement.
Mots Clés: Le contenu en hlorophylle, Glycine max, intensités
lumière, soja, stode croissance
INTRODUCTION
Soybean,(Glycine max (L.) Merrill) is a food legume of considerable
nutritional potential in Nigeria where animal protein is inadequate in human
diets. Soybean provides oil for domestic cooking and cakes for animal feeds
(Knipscheer and Ay, 1992) as well as snaks for human consumption (Uwaegbute,
1999). Milk extracted from soybean is a cheaper alternative to cow's
milk. Through N2-fixation, soybean is able to contribute N to the
soil through the mineralisation of its residue left in the field thereby building
up the N status of the soil (Muyinda et al., 1998). It is therefore
being considered for soil fertility improvement (Carsky et al., 1997).
In spite of the vast potentials of soybean, its production is constrained
by a number of problems which include limitations posed by soil and other
environmental factors. The low light intensity prevalent in the forest zone
of south west Nigeria in the rainy season has been identified as responsible
for reducing crop productivity. Crop yields for instance in the forest zone
are consistently lower than in the savanna zone (Ezedinma,1973; Kassam and
Kowal, 1973). Most soybean in Nigeria is produced in the savanna zone where
higher light intensity abound compared to the southern part, yet total production
is still relatively low. The level of soybean production in the country can
be improved by extending soybean production to the southern forest zone. Before
this can be successfully done, however, the response of soybean to reduced
light intensity occasioned by shading by taller intercrops in this area, needs
to be studied.
Light is an important resource in crop production because of its roles in
photosynthesis and morphogenesis. It is therefore important to grow crops
under light intensity that will maximise growth, development and yield. More
often than not however, plants do not receive optimum light intensity during
cultivation as a result of factors such as dense cloud covers and shading
by taller intercrops (Evans,1972). Field grown soybean in Nigeria is generally
intercropped with maize (Zea mays) and cassava (Manihot spp.).
This particular cropping system has been reported to reduce the yields of
soybean by up to 60% in Indonesia (Surmano,1987). This study therefore was
undertaken to determine the response of three soybean cultivars to varying
light intensities at various stages of growth and development, in south west
Nigeria.
MATERIALS and METHODS
A study was conducted in the field and in pots. Both experiments (field and
pot) were conducted under caged conditions. The three soybean varieties used
for this study were obtained from the International Institute of Tropical
Agriculture (IITA), Ibadan, Nigeria. The soybean varieties and their characteristics
are as follows:
TGx 1485-1D: Early maturing (95 days after planting) erect, determinate type,
TGx 849-313D: Medium maturing (103-105 days after planting), semi-determinate
type, and
Malayan: Late maturing (110-115 days after planting), semi-determinate type.
Cage construction. The cages used for the pot and field trials were
made of 5cm x 5cm wood. The internal dimensions of each cage were 1.8m x 1.2m
x 1.3m. The wooden frames were covered on all sides with single or double
layers of synthetic,green,1mm mesh net to reduce light intensity by 25% or
50%, respectively. The light intensities within and outside the screens were
measured using a light meter Model 4555 type C (Megatron, England).
Pot experiment. Seeds of the soybean varieties were sown in 675 plastic
pots (5 litre capacity having 20cm rim diameter),each containing 3.95kg soil
obtained from the plot where the field trial was to be carried out. Planting
was done on 6 September, 1992.Three days before this, N P K (15:15:15) fertiliser
was applied at the rate of 50 kg NPK per hectare, and thus 1.47g of fertiliser
were added to each pot. Sufficient numbers of pots were planted to take care
of unforeseen events during experimentation and for extraction of chlorophyll.
Five seeds were sown per pot at a depth of 3cm. The resulting seedlings were
thinned to one per pot two weeks after sowing.
The pots were arranged in a split - split plot layout on the roof top garden
of the Department of Crop Protection and Environmental Biology, University
of Ibadan. The soybean varieties served as the main plots; stage of growth
as sub-plots; and light regimes as sub - sub plots, with five replicates.
Randomisation was done according to the procedures of Gomez and Gomez (1984).
Two light regimes (75 and 50% daylight) were imposed for two weeks on the
soybean varieties at the vegetative (V4-5, when the plants had four to five
nodes on the main stem beginning with the unifoliolate node);early flowering
stage (R2,when the plants flowered at the node immediately below the uppermost
node with completely unrolled leaf);and the pod filling stage (R5,when the
seeds were beginning to develop and can be felt when squeezed at one of the
four uppermost nodes with a completely unrolled leaf) (Fehr and Caviness,1977).
Water supply and weeding were carried out as required. Sixty five pots of
the early maturing variety and eighty pots each of the medium and late maturing
varieties were removed at the vegetative stage of growth and arranged inside
the cages. At the flowering and pod filling stages, fifty pots of early maturing
variety and 65 pots each of the medium and late maturing varieties were transferred
into the cages. The plants remained inside the cages for two weeks at each
stage of growth.
Sampling and measurement. The treated plants were removed from the
cages after two weeks and returned to the open roof top. Sampling commenced
a day after the expiration of treatment and continued at fortnightly intervals
thereafter. On each sampling occassion, five plants per treatment were evaluated
for leaf area, stem height, number of branches and number of pods. The dry
weights of leaves, stem, roots, pods and the total dry weight plant-1
were also determined.
At final harvest (plant maturity),data were also taken on the following yield
characters: number of seed-bearing pods plant-1 number of empty
pods plant-1 total seeds plant-1 and seed dry weight
plant-1. The height of the shoot apex from the ground was measured
and recorded as the plant height while leaf area was determined by the graph
paper method. The dry weights of the various plant parts were measured using
the mettler balance P1210 after oven drying the samples at 80°C
for 48 hr.
Leaf chlorophyll. Chlorophyll was extracted from the second and fourth
leaves obtained from the plants under the various light regimes. The standard
procedures of Arnon as used by Hang et al. (1984) were used for the
chlorophyll extraction. The absorbances of chlorophyll extracts were measured
against 80% acetone blanks using Pye-Unicam SP6-250 visible spectrophotometer.
The amounts of chlorophyll a and b in the leaves of the plants were determined
using Arnon formula (Hang et al., 1984) described below:
C= (20.2 x D645+ 8.02 x D663)x 50/1000x100/5x1/2
Where C = chlorophyll concentration (mg g-1)
D645= absorbance at 645nm (chlorophyll a)
D663= Absorbance at 663 nm (Chlorophyll b)
Soil analysis. Pre-cultivation soil analysis was done according to
the procedures of Udo and Ogunkunle (1986).
Field experiment. The experiment was carried out at the Teaching and
Research Farm, University of Ibadan. The layout consisted of three main plots,
nine sub-plots and twenty-seven sub-sub plots, replicated five times. Each
main plot measured 4.2m x 6.0m,each sub-plot measured 1.4m x 6.0m while each
sub-sub plot measured 1.4m x 2.0m. The main plots were separated by 1m rows
on all sides; sub-plots were demarcated by pegs while sub-sub plots were separated
by gaps created along the rows of soybean plants after emergence. The varieties
were randomly allocated to main plots, stage of growth to sub plots and light
regimes to sub sub- plots. The experimental design was therefore a split-split
plot.
Planting was done on 19 July,1994. The seeds were drilled along each row.
Spacing was 60cm x 5cm which is the recommended spacing for soybean growing
farmers in south west Nigeria. Thinning was done 10 days after sowing (DAS).
The plots were weeded at 3, 6 and 10 weeks after sowing. Fertiliser (NPK 15:15:15)
was applied at a rate of 50kg ha-1, two weeks after sowing. Light
reducing cages were reassembled on the field and treatment imposition on the
soybean plants as well as the sampling methods and data collection were as
in the pot experiment.
Statistical analysis. The data gathered from the pot and field trials
were separately subjected to split-split plot analysis of variance using the
statistical analysis system (SAS) computer software. Comparisons of the various
treatment means were done using the least significant difference (L.S.D)at
the 5% level of significance.
RESULTS
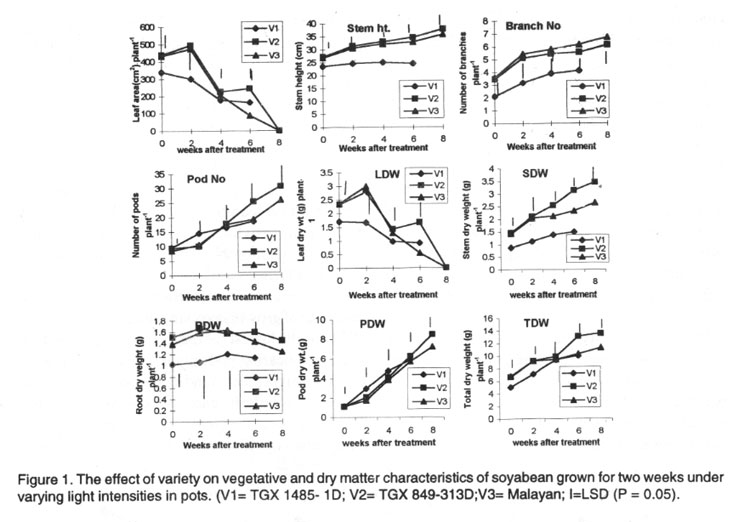
Pot experiment. The late maturing variety (V3) had a larger leaf area
than the medium (V2) and early (V1) maturing varieties one day after treatment.
However, six weeks after treatment (WAT) V1 and V2 had a greater leaf area
than V3. The number of branches of V3 plants was significantly higher than
those on V1 and V2 after treatment. The stem heights of V3 and V2 were similar
but significantly higher than that of V1plants. The number of pods was highest
in V2 and lowest in V1 plants at maturity (Fig.
1).
The leaf dry weight of V3 plants was initially higher than those of V1 and
V2 plants but at 6 WAT, the leaf dry weight of V2 plants was the highest and
that of V1 lowest. The stem and root dry weights of V2 plants were significantly
higher than those of V3 and V1with V1 having the lowest values throughout
the sampling period (Fig.1).
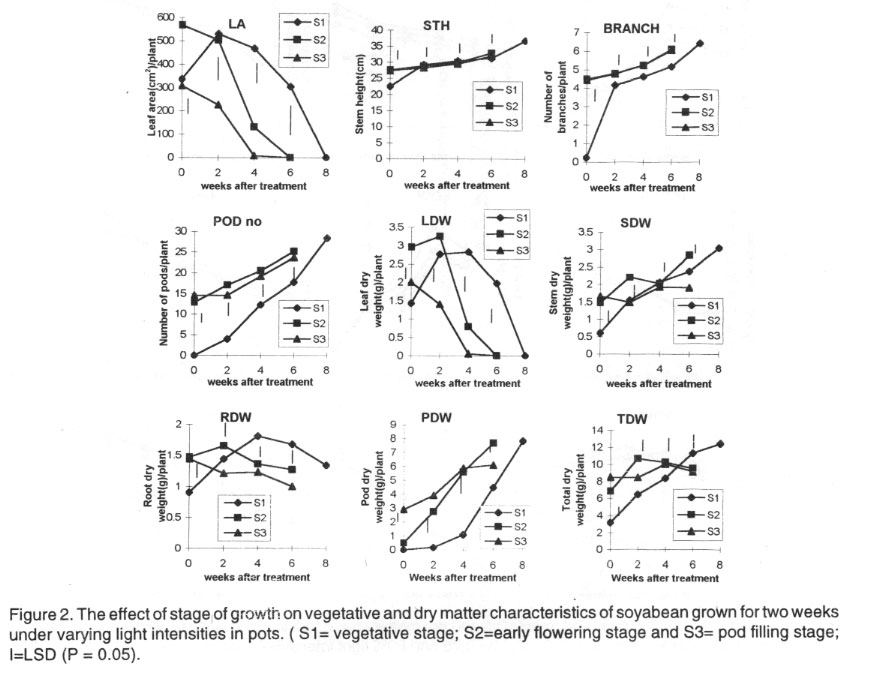
Initially, the soybean plants treated at the flowering stage (S2) had significantly
larger leaf area than plants treated at the vegetative (S1) and pod filling
(S3) stages of growth. Later S1 plants had larger leaf area than S2 and S3
plants. Stem height and branch number were similar in S2 and S3 plants although
the plants had significantly more branches than S1 plants. The S1 plants had
the lowest number of pods while S2 plants had the highest from 2-6 WAT. However,
pod number was lowest in S3 plants and highest in S1 plants at maturity (Fig.
2).
The dry weights of the various plant parts were initially lower in S1 plants
than S2 and S3 plants. The dry weight later increased in the various parts
of S1 plants such that they had the highest total per plant at final harvest
(Fig. 2).
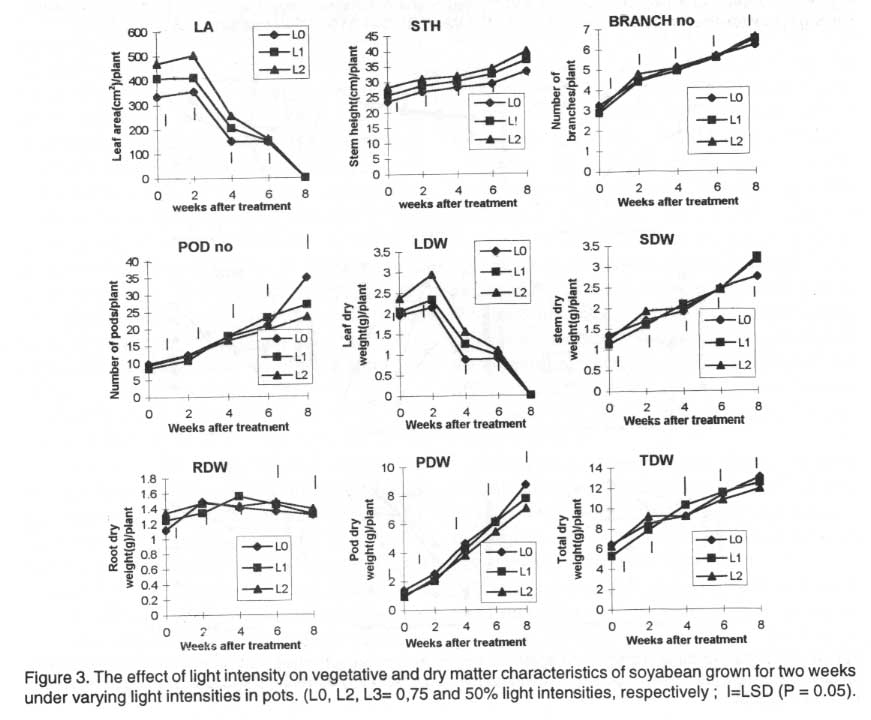
Plants grown under reduced light regimes had significantly larger leaf area
than plants grown in the open. Throughout, the tallest plants were those grown
under 50% light intensity (L2 plants) while the shortest were those grown
under 100% light intensity (L0 plants). Plants grown for two weeks under 75%
light intensity (L1 plants) had intermediate values. At maturity L0 plants
had significantly more pods than L1 and L2 plants. The number of pods per
plant exposed to L0, L1and L2 treatments were 34.9g, 26.9g 23.3g, respectively.
The differences were significant (Fig. 3).
Plants subjected to L2 treatment had significantly higher leaf, stem and
root dry weights than L0 and L1 plants, for most of the growth period after
treatment. Pod dry weight and total dry weight plant-1 for L0 treated
plants were significantly higher than under L2 at plant maturity (Fig.
3).
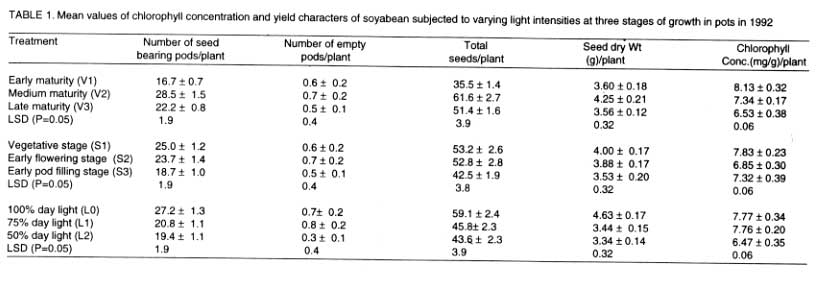
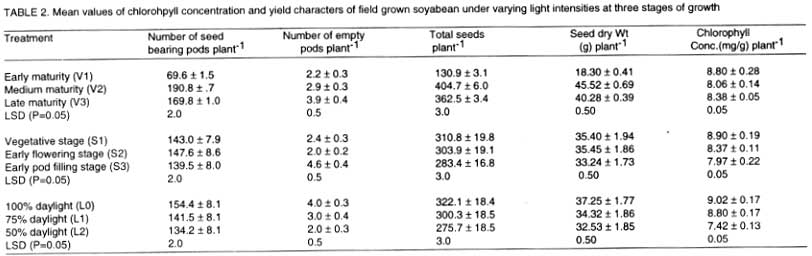
Medium maturity variety had significantly higher values of seed-bearing pods
plant-1, total seeds plant-1 and seed dry weight plant-1,while
V1 had the lowest values for these parameters. All these differences were
significant. Plants subjected to light intensity treatments at pod filling
(S3) had the lowest values of these yield parameters. These parameters were
also significantly higher in L0 plants than in L1 and L2 plants, with L2 plants
having the lowest values. The greatest number of empty pods were in S3 and
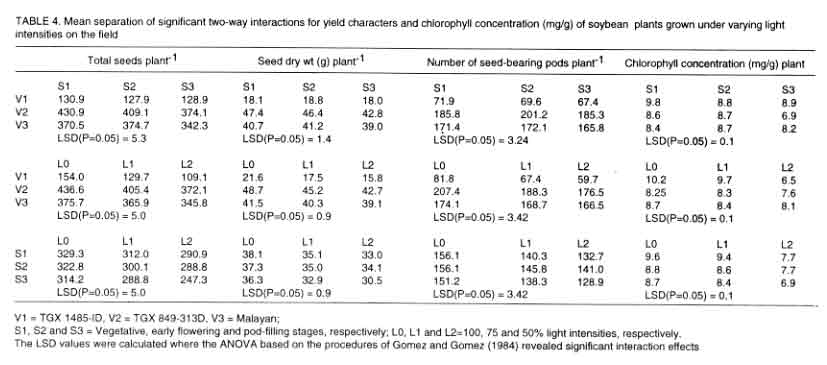
L0 plants (Tables 1 and 2).
Chlorophyll concentration was highest in V1 and lowest in V3. Plants treated
at vegetative stage (S1) had significantly higher chlorophyll concentration
than S2 plants, which in turn had higher chlorophyll concentration than S3
plants. The order of chlorophyll concentration was L0 > L1 > L2 (Tables
1 and 2).
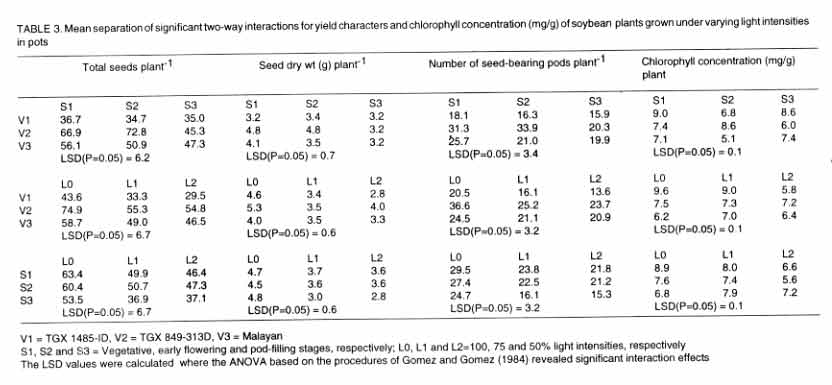
The values of the interaction effects for variety and stage of growth involving
the pod filling stage (S3) was the lowest for the three yield parameters (i.e.,
seed bearing pods plant-1, total seeds plant-1 and dry
weight plant-1) and chlorophyll considered (Table
3). Similarly, each of the varieties had the lowest values of the yield
parameters at the lowest light intensity. The combination of the lowest light
intensity at the pod filling stage produced the most depressing effects on
the yield parameters and chlorophyll concentration (Table
3).
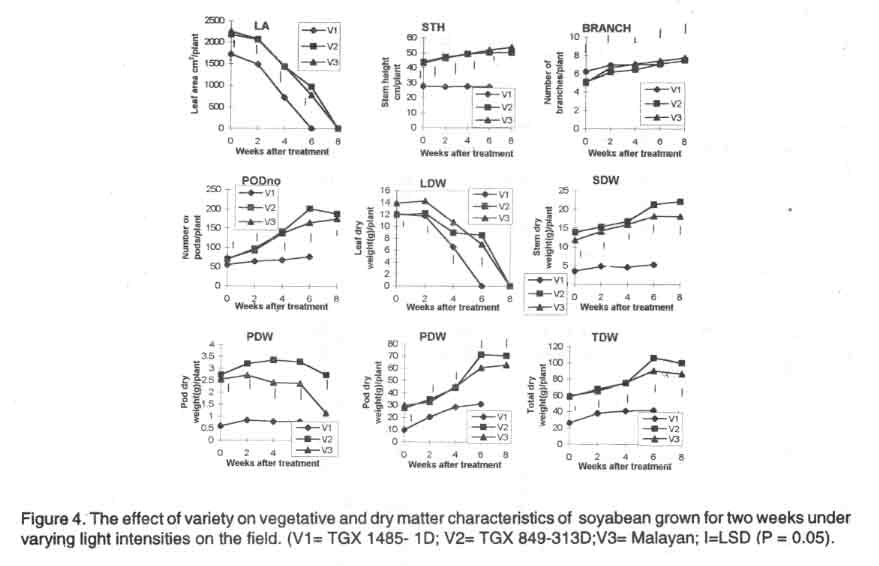
Field experiment. Initially, V3 plants had a bigger leaf area than
V1 and V2 plants but at 6 WAT V2 had a higher leaf area than V1 and V3. The
late maturing variety (V3) also produced more branches than V1 and V2 plants
for most of the post treatment period. Both V2 and V3 were significantly taller
than V1 throughout the post treatment period but V3 was significantly taller
than V2 at maturity. The medium maturing variety (V2) had significantly more
pods than V3 plants which also had significantly more pods than V1 plants
at maturity (Fig. 4).
The leaf dry weight of V2 was highest at 6 WAT. The stem and root dry weights
of V2 were significantly higher than those of V1 and V3 throughout the post
treatment period. The pod and total dry weights of V2 were also significantly
higher than those of V1 and V3 plants. The early maturing variety (V1) had
the lowest pod dry weight (Fig. 4).
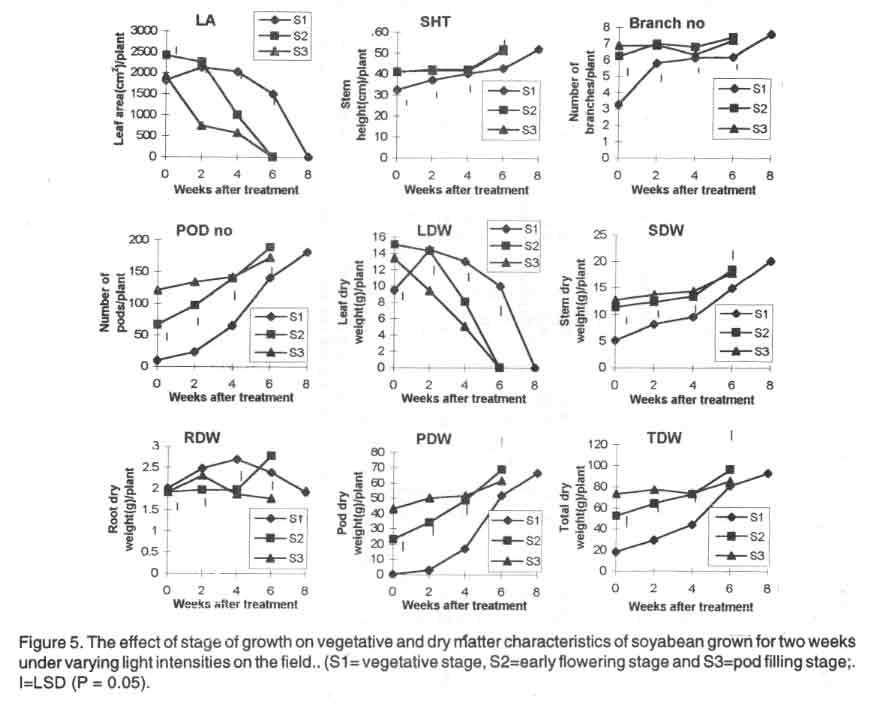
From 4 - 6 WAT, S1 plants had bigger leaf area compared with S2 and S3 plants.
The heights of S1, S2 and S3 plants were similar at maturity. Also,
the number of branches of all the treated plants were not significantly different
at maturity. The lowest number of pods was produced by S3 plants (Fig.
5).
Plants that received treatment at flowering stage (S2) had the highest values
of root, pod and total dry weights while S1 plants produced the highest dry
weight of stem and leaves at 4 and 6 WAT. The differences were significant
(Fig. 5).
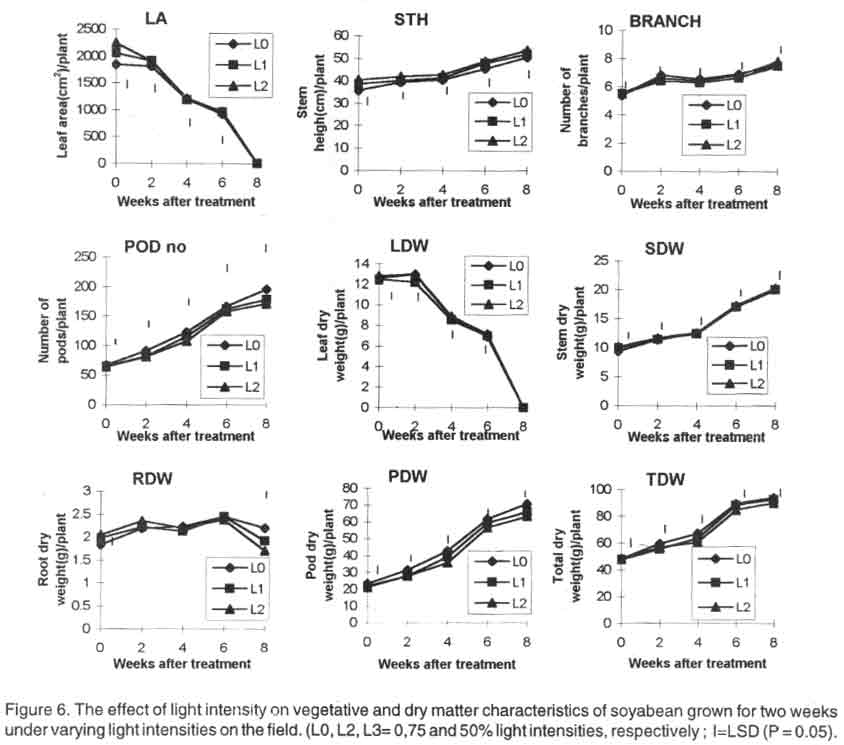
Plants grown for two weeks under reduced light regimes had significantly bigger
leaf area than plants grown in the open. Throughout the growing season, L2
plants were the tallest while L0 plants were the shortest. Plants exposed
under 75% light intensity (L1) had intermediate heights. Branch number was
similar for all treatments. At plant maturity, L0 plants had significantly
more pods than L1 and L2 plants. The number of pods of L0, L1 and L2 plants
averaged 166, 161 and 157, respectively (Fig.
6).
Towards maturity, L0 plants had significantly greater leaf and stem dry
weights than L1 and L2 plants. Root dry weight was highest for plants under
L0 at crop maturity. The L0 plants also produced the heaviest pods. The order
of pods and total dry weights as influenced by light intensity treatments
were L0 > L1 >L2. The yield characteristics and leaf chlorophyll concentration
of field-grown plants were similar to that obtained in the pot experiment
(Table 4).
For interaction effects, the observation in pots was accentuated. For instance,
the seed dry weight of V2xS3 was significantly lower than those of V2xS1 and
V2xS2. Similarly,the seed dry weight of V3xS3 was significantly lower than
that of V3xS1. The interaction of the lower light intensities led to lower
seed dry weight compared to varietal interaction with L0 (Table
4).
DISCUSSION
Reduced light intensities imposed for two weeks at the vegetative stage significantly
enhanced the vegetative growth of soybean cultivars used in this study. Such
plants that were grown under subdued light had more leaf area and grew taller
as compared to plants grown in the open throughout the growing season. This
is attributed to the tendency of such plants to grow more vigorously under
better illuminated conditions (Fitter and Hay, 1977). Mohr (1972) reported
possible involvement of phytochrome in the control of internodal lengthening
of these plants. The increased leaf area under subdued light was probably
response intended to maintain photosynthetic assimilation at a lower photon
flux density coupled with the need to maximise interception of the little
available light. This supports reports of Sunarlim (1985), Taiz and Zeiger
(1991), Mohr and Schopfer (1995).
The low light levels available for shaded plants might have also caused a
restriction of their genetic potential resulting in the modification of their
growth pattern. The larger leaf area of plants grown in the open throughout
the growing season compared with plants under reduced light regimes for two
weeks at the pod filling stage (S3) was due to the rapid loss of leaves in
the S3 plants because at the pod filling stage ageing had set in and thus,
the rate of renewed vegetative growth after treatment could not match the
rate of senescence during treatment.
Total dry matter accumulation was highest in plants grown in the open at
the three stages of growth considered in this study. Even though plants grown
under reduced light intensity initially (just after treatment) had higher
stem, leaf and root dry weights compared with plants grown in the open, the
latter plants eventually had the highest values of these parameters especially
at harvest maturity. It is clear, therefore, that plants grown under subdued
light for two weeks at different stages of growth were unable to recover from
the effects of growth under reduced light intensity and hence the lower dry
matter accumulation which invariably probably led to reduced yields in these
plants.
Results of this study reveal that yield reduction was obtained when light
intensity was reduced for two weeks at the vegetative, early flowering and
pod filling stages of growth. However, yield reduction was lowest with light
reduction at the vegetative stage. The reduced yield at all stages stemmed
directly from lower number of pods plant-1, reduced seed weight
plant-1 and lower chlorophyll concentration plant-1.
The lower leaf chlorophyll concentration observation is in agreement with
reports of Sunarlim (1985) who recorded lower chlorophyll contents in leaves
of plants grown under subdued light intensities. Since chlorophyll is sensitive
indicator of photosynthesis that reflects photosynthetic carbon assimilation
capacity(Sivak and Walker,1985), it follows that leaves with lower chlorophyll
concentration will have lower assimilates available for seed growth and development
and hence giving low yields.
The greatest yield reduction obtained by shading at the pod filling stage
contrasts with findings of Prine,(1976) who recoreded slight reduction in
seed weight with minimal changes in seed number. Differences in the varieties
used in this study and those used by Prine may account for the varying observations
of the two experiments. Besides, differences in the prevailing environmental
conditions of Prine's experiment and that of this study could also have
contributed to the observed variations. Varietal differences in maturity period
as well as growth habit might have influenced source/sink relationships such
that late maturing varieties having indeterminate growth habit might be less
affected by reduction in light intensity at the pod filling stage. Generally,
at pod filling growth stage, most assimilates produced by the plants are used
for pod filling so that reduced net photosynthesis due to shading at this
time must have reduced the amount of assimilates available for pod filling
hence the highest reduction in yield.
The increased vegetative growth under reduced light intensity did not ultimately
translate into higher yields. This was because the enhanced vegetative growth
was more of reduced senescence than actual leaf production. It is known that
reduced reproductive development of sinks moderate source activities such
that reduced photosynthesis (in reaction to reduced demand) can lead to longer
leaf area duration (LAD) later. Reduced light intensity, in effect, reduced
reproductive development of induction of floral primordia (for shading in
the vegetative phase) and/or number of reproductive nodes(for shading in the
early reproductive phase). Soybean production in south west Nigeria is affected
by low light intensity. To counteract or limit this effect, it is suggested
that soybean should not be cultivated with taller intercrops particularly
if they have a longer growth cycle. This is important in order to avoid shading
in general and particularly at the pod filling stage. In addition, cultivation
of soybeans should be such that the most critical stage (R5) does not coincide
with the period of heavy over cast skies. This can be achieved by planting
soybean at a period that allows the R5 stage coincide with the month of August
when there is usually less rainfall and hence clearer skies in south west
Nigeria. The suitability and adoption of this suggestion will, however, depend
on the onset of the rains and the maturity period of the variety to be cultivated.
REFERENCES
-
Carsky, R.J., Abaidoo, R., Dashiell, K.E. and Sangiga,
N. 1997. Effect of soybean on subsequent maize grain yield in the Guinea
savanna zone of West Africa. African Crop Science Journal 5:31-38.
-
Evans, G.C. 1972. The quantitative analysis of plant growth.
Blackwell Scientific Publications (1982) Oxford.
-
Ezedinma, F.O. C.1973. Seasonal variations in vegetative
growth of cowpeas (Vigna unguiculata(L.) Walp) in relation to insolation
and ambient temperatures in Nigeria. Proceedings of the first IITA Grain
Legume Improvement Workshop 1973 pp. 38-5.
-
Fehr, W. R. and Caviness, C. E. 1977. Stages of soybean
development. Iowa Agric. Experimental Station Special Report 80 Ames. In:
soybean yield component responses to a light interception gradient during
the reproductive period.
-
Fitter, A. H. and Hay, R.K.M. 1977. Environmental physiology
of plants. NewYork Academic Press. pp. 29- 67.
-
Gomez, K. and Gomez, A. 1984. Statistical Procedures for
Agricultural Research. Second Edition. John Wiley and Sons pp. 12.
-
Hang, A. N., McCloud, D. E., Boote, K. J. and Duncan, W.
G. 1984. Shade effects on growth, partitioning and yield components of peanuts.
Crop Science 24:109-115.
-
Kassam, A. H. and Kowall, J. M. 1973. Productivity of crops
in savanna and forest zones of Nigeria. Savanna 2:37-47.
-
Knipscheer, H. C. and Ay, P. 1982. The potential of soybean
in Nigeria and the results of an IITA survey in two principal production
areas (Benue state and Zonkwa-Abuja).Discussion paper N. 1/ 82 pp. 1- 46.
-
Mohr. H. 1972. Lectures on photomorphogenesis. (springer-Verlag)
pp.1-12.
-
Mohr, H and Schopfer, P . 1995. Plant physiology. MacMillan
publishing Company, Springer. pp. 345-373.
-
Muyinda, K., Karamanos, R.E. and Haloran, I.P.O. 1988. Yields
of wheat in rotation with maize and soybean in Zambia. Canadian Journal
of Soil Science 6:747-753.
-
Prine, G. M. 1976. Low light intensity effects on yield
components of field grown soybean Agronomy Abstracts. Madison Wis.
American Society of Agronomy. 8 pp.
-
Sivak, M. N. and Walker, D. A. 1988. What can be learned
about the regulation of photosynthesis from multiple measurements. State
of the art and perspectives. In: Regulation of sources and sinks in crop
plants. Monogragh 12:
-
Jeffcoat, B., Hawkins, A. F. and Stead, A. D. (Eds.), pp.
1-115. British Plant Growth Regulator Group, Bristol.
-
Sunarlim,N. 1985. Soybean development, yield and yield components
responses to shade level and time of shading. Dissertation Abstracts International.
B 46(3):710-711.
-
Surmano, S. A.1987. Soybean breeding for Indonesia cropping
systems. In: soybean varietal improvement (Proceedings of the International
Workshop, Jakarta Indonesia 21-22 July 1984 pp. 9-13.
-
Taiz, L. and Zeige, E. 1991. Plant physiology (Ed.), pp.
249-263. John Wiley and sons.
-
Udo, E. J. and Ogunkunle, J. A. 1986. Laboratory manual
for the analysis of soil, plant and water samples 2nd Edition. pp. 1-74.
-
Uwaegbute, A.C. 1999. Development, Acceptability and proximate
composition of snaks based on soybean (Glycine max) and yam (Dioscorea
spp.). Tropical Oil Seed Journal 4:102-109.
© Copyright 2001, African Crop Science Society
The following images related to this document are available:
Photo images
[cs01076f6.jpg]
[cs01076t4.jpg]
[cs01076t2.jpg]
[cs01076f4.jpg]
[cs01076f5.jpg]
[cs01076t3.jpg]
[cs01076f3.jpg]
[cs01076f1.jpg]
[cs01076t1.jpg]
[cs01076f2.jpg]
|
