 |
| About Bioline | All Journals | Testimonials | Membership | News |
|
||||||
|
||||||
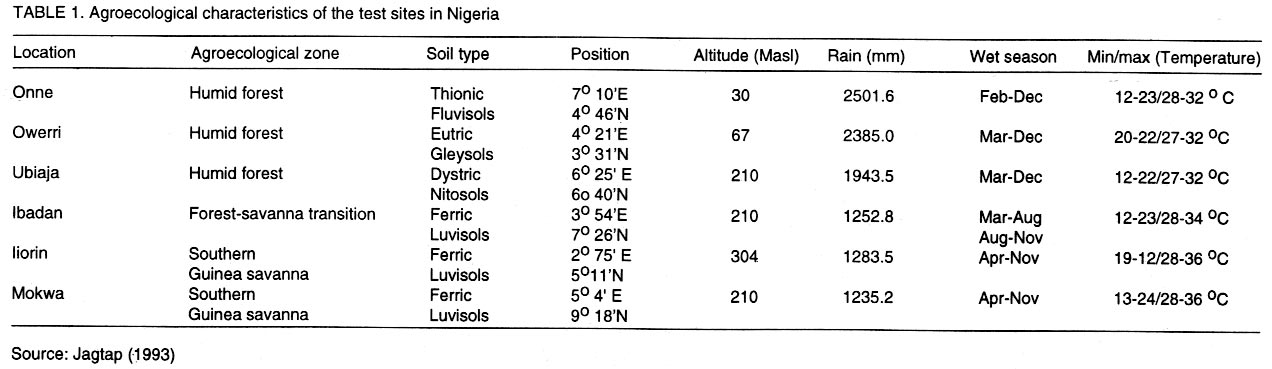
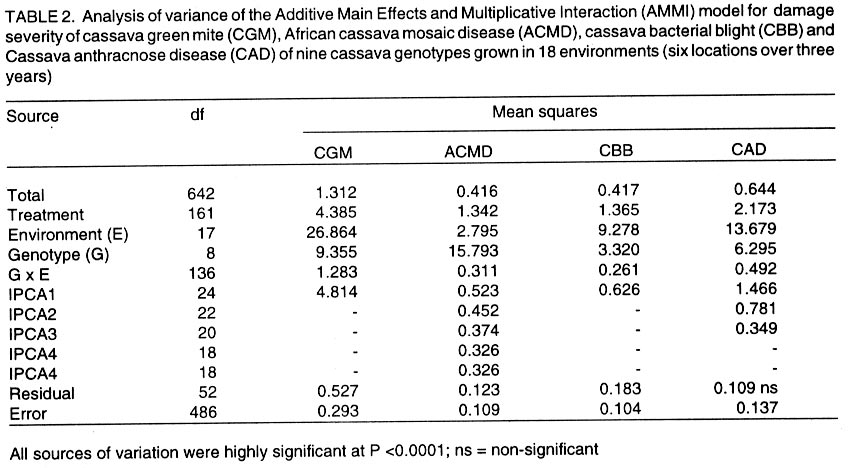
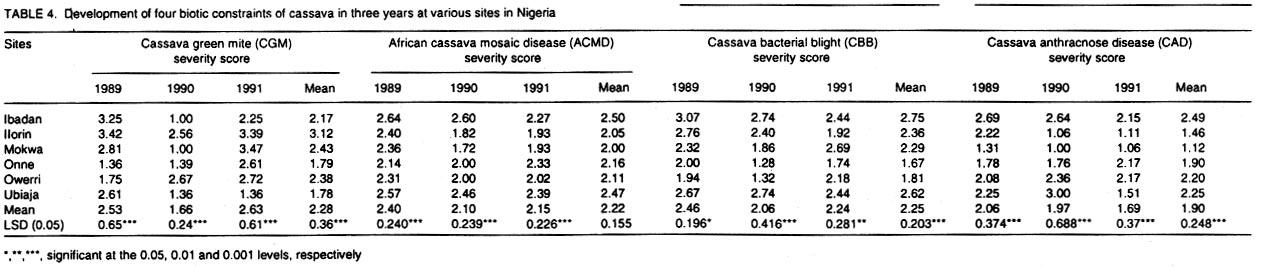
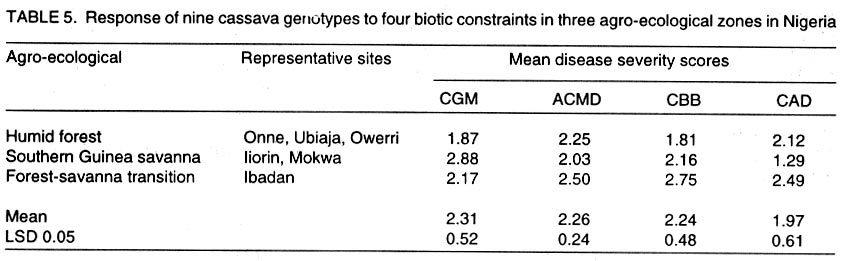
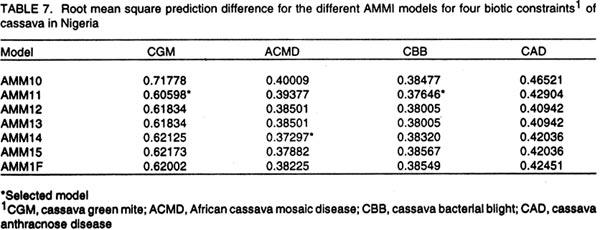
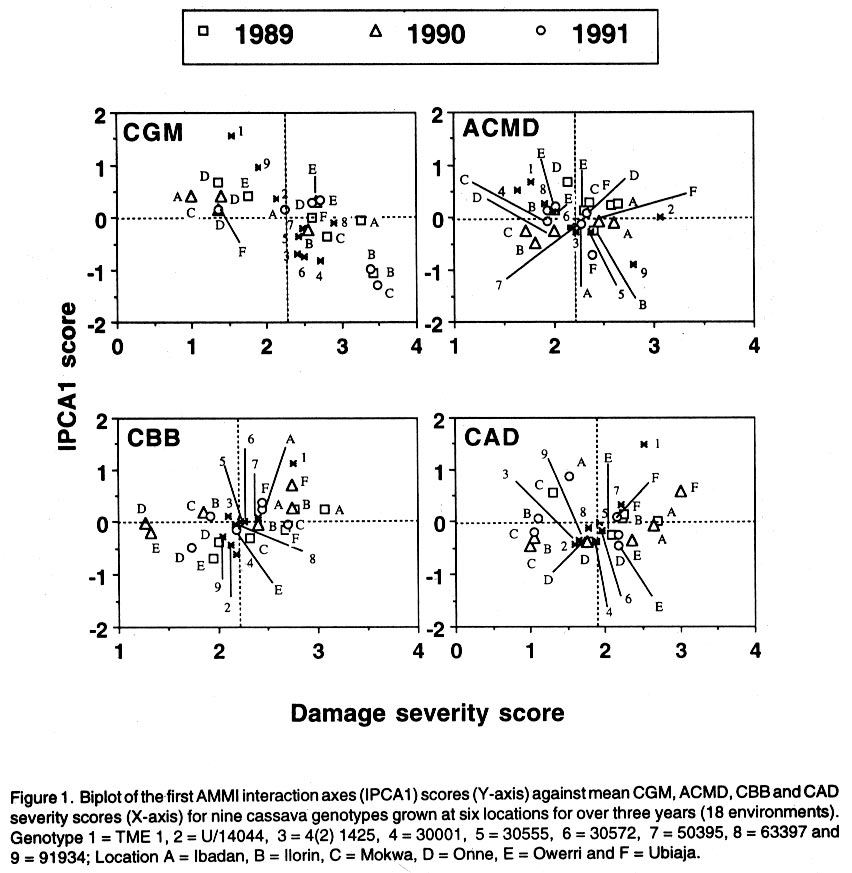
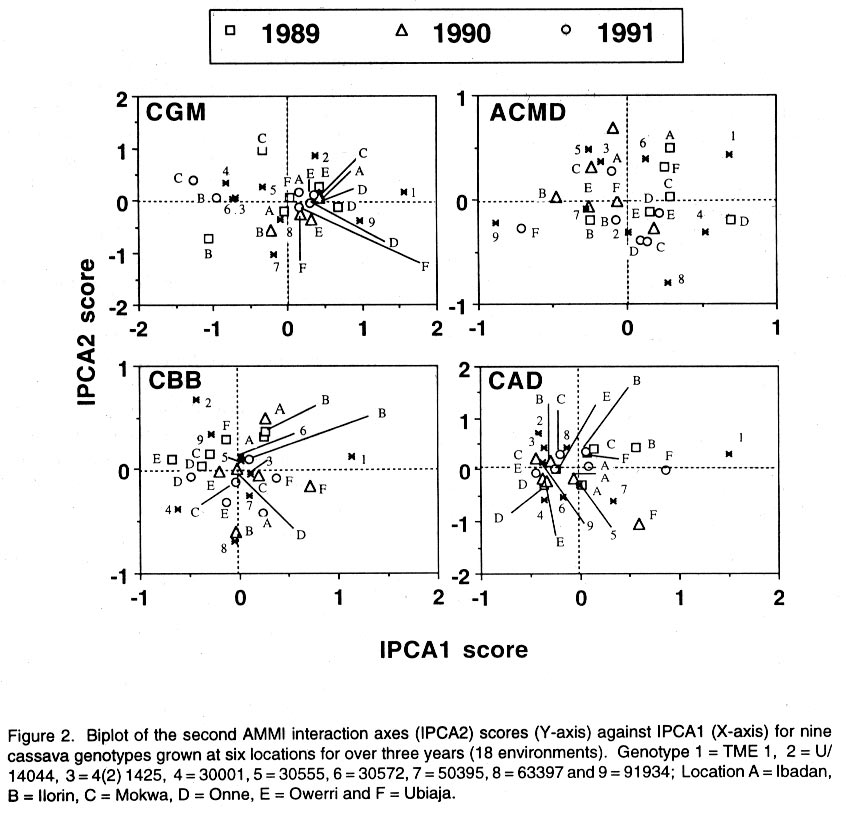
African Crop Science Journal, Vol. 10. No. 1, 2002, pp. 11-21 RESPONSE OF CASSAVA GENOTYPES TO FOUR BIOTIC CONSTRAINTS IN THREE AGRO-ECOLOGIES OF NIGERIA A.G.O. Dixon, J.M. Ngeve1 and E.N. Nukenine2 International Institute of Tropical Agriculture, PMB 5320, Ibadan, Nigeria (Received 13 February, 2001; accepted 14 November, 2001) Code Number: cs02002 ABSTRACT Eight improved cassava (Manihot esculenta Crantz) genotypes and one local variety were grown over three years in three agro-ecological zones of Nigeria, to study their response to natural infestations of African cassava mosaic disease (ACMD), cassava bacterial blight (CBB), cassava anthracnose disease (CAD) and cassava green mite (CGM). Additionally, genotypes with stable resistance using the Additive Main Effects and Multiplicative Interaction (AMMI) statistical model was identified. Environments, genotypes and genotype x environment (G x E) interactions were highly significant (P < 0.0001) for the pests, implying that the G x E effects were sufficiently high to mask differences among genotypes. The local variety, TME1, was more tolerant (30% severity) to cassava green mite across sites, compared to other clones, while clone 30001 exhibited the highest susceptibility to the pest (54%). Genotypes (30001, TME1 and 30573) gave lowest severity scores for ACMD. Clones used in the study, especially U/41044, 4(2) 1425 and 63397, showed tolerance to CBB and CAD with severity ratings as low as 2.0. Across test sites, CGM had the highest severity scores (3.12) averaged over 3 years in Ilorin (in the Southern Guinea savanna ecology). The lowest severity scores of this disease were observed in Ubiaja and Onne. The severity of ACMD and CBB was highest in Ibadan and Ubiaja and lowest in Onne and Owerri. Cassava anthracnose disease was more severe in Ibadan (score of 2.5) and least severe in Mokwa (1.12). For CGM the highest severity was recorded in the Southern Guinea savanna (score 2.88) and lowest in the humid forest zone. Correlation coefficients calculated between pairs of biotic constraints revealed that cassava bacterial blight was negatively correlated (r=-0.78) with the green mite but positively correlated with anthracnose disease (r=0.94). The AMMI model selected AMM11 for CGM and CBB, and AMM14 and AMM13 for ACMD and CAD, respectively, as the best predictive models since these models had the smallest actual root mean square prediction differences (0.60598 and 0.37646 for CGM and CBB, respectively and 0.37297; and 0.40929 for ACMD and CAD, respectively. Genotypes 30572, 63397, 50395 and 4(2)1425 with low ACMD scores and low IPCA1 scores were the most stable to environmental changes as they combined resistance with stability of response. Such genotypes would be most appropriate in breeding programmes. Key Words: African cassava, anthracnose, bacterial blight, green mite, mosaic disease RÉSUMÉ Un essai a été mené sur huit clones améliorés de génotypes de manioc et une variété locale, dans trois zones agro-écologiques du Nigéria, pour étudier leur comportement à la mosaïque, bactériose, anthracnose et acarien vert du manioc. L'étude s'était étalée sur une période de plus de trois ans. Additionnellement, les génotypes à résistance stable étaient identifiés en utilisant la méthode statistique des effets principaux additifs et intéractions multiplicatives. Les effets de l'environnement, du génotype et l'intéraction génotype et l'environnement (GXE) étaient significativement élévées (P<0.0001) sur les quatre pestes, suggérant que l'intéraction génotype-environnement était suffisamment élévée pour masquer les différences parmi les génotypes. La variété locale, TME1, était plus tolérante (sévérité 30%) à l'acarien vert de manioc aux travers les sites comparé aux autres clones pendant que le clone 30001 a exhibé la sensibilité la plus élévée aux pests (54%). Les génotypes (30001, TME1 et 30573) ont donné des scores sévérement bas pour la mosaïque. La plupart des clones, spécialement U/41044, 4(2) 1425 and 63397, ont montré une tolérance à la bactériose et l'anthracnose avec des taux sévérement bas de 2.0. Au travers les sites testés, l'acarien vert avait le plus grand score (3.12), pour une moyenne de plus de trois ans, dans Ilorin (dans la savanne du Sud Guinnee). Les scores les plus bas pour cette maladie étaient observés dans l'Ubiaja et dans Onne et Owerri. La sévérité du mosaïque et la bactériose. La maladie d'anthracnose de manioc était plus sévère dans Ibadan et moins sévère dans Mokwa. Pour l'acarien vert la sévérite la plus élévée était enregistrée dans la savanne du sud Guinnée (score 2.88) et la plus basse dans la zone forestrière humide. Les coéfficients de corrélation calculés entre paires et contraintes biotiques ont revélé que la bactériose était négativement corrélée à l'acarien vert du manioc (-0.78) mais positivement corrélée à la maladie l'anthracnose (r=0.94). Le modèle AMMI a séléctionné AMM11 pour l'acarien vert et la bactériose, AMM12 et AMM13 pour le mosaïque et l'anthracnose comme meilleurs modèles. Ils ont présenté des racines des carrés moyens faibles; 0.60598, 0.37464, 0.37297 et 0.40929 pour l'acarien vert, la bactériose, le mosaïque et l'anthracnose, respectivement. Les génotypes 30572, 63397, 50395 et U(2)1425 avec bas scores; le mosaïque et bas scores IPCA1 étaient en majorité stable aux échanges environnementaux comme ils ont combiné résistance avec stabilite des réponses. Pareils génotypes seront les plus recommendés dans un programme de sélection. Mots Clés: Manioc Africain, anthracnose, bactériose, acarien vert, mosaïque INTRODUCTION Cassava (Manihot esculenta Crantz) is an important root crop and a staple food for approximately 800 million people living in the tropical world (Bokanga and Otoo, 1994). Its roots are also used for animal feed and in starch production for cosmetic and pharmaceutical industries. Cassava is a hardy crop which is relatively tolerant to many biotic and abiotic stresses. However, the crop suffers heavy yield losses in some areas as a result of pest infestations and disease attack. In Africa, the most important diseases are the African cassava mosaic (ACMD), cassava bacterial blight (CBB) and cassava anthracnose (CAD) (Geddes, 1990; Lozano, 1992). The cassava green mite (CGM), however, is the most serious arthropod pest. The use of host plant resistance is the most suitable control strategy against these biotic constraints. There is need, therefore, to identify improved cultivars that are high yielding and exhibit stable resistance. An improved cassava genotype should produce high storage root yields as well as show stable resistance to economically important biotic constraints in a range of environmental conditions. Genotypic reaction to pests and diseases is best measured by symptom severity (Shaffii et al., 1992). This index is high when a genotype is grown in an environment to which it is not adapted. Cassava is widely adapted to a variety of environmental conditions, but usually the adaptability of most varieties is narrow and shows large genotype x environment (G x E) interaction effects (Dixon et al., 1994: Tan and Mak, 1995; Dixon and Nukenine, 1997). The GxE interaction effects, may arise when genotypes are grown in diverse environments. A significant GxE interaction posses significant limitations in the selection of superior genotypes, and thus, reduces the usefulness of subsequent analysis of means and inferences that would otherwise be valid (Shaffi et al., 1992). The objectives of this investigation were to (i) study the response of cassava genotypes to four economically important cassava biotic constraints (grown under natural infestation) (cassava green mite, cassava mosaic, bacterial blight and anthracnose diseases) grown under natural infestation (humid forest, southern Guinea savanna, and forest-savanna transition) in Nigeria, (ii) determine the influence of genotype x environment (G x E) interactions on cassava response to the pest and disease infestation, and (iii) identify genotypes with stable resistance to the pests using the AMMI model. MATERIALS AND METHODS The study was conducted during 1989- 1991 at six sites, namely, Ibadan, Ilorin, Mokwa, Onne, Owerri and Ubiaja in Nigeria, representing major cassava growing areas in the country (Table 1). Eight improved cassava clones, namely, U/41044, TMS 4(2) 1425, TMS 30001, TMS 30555, TMS 30572, TMS 50395, TMS 63397 and TMS 91934) and one local variety TME 1, were used in the study. The experiment was set up in a randomised complete block design, with four replicates of each grown under rainfed conditions. Each plot consisted of 40 plants in four rows. The ridges, spaced at 1 m apart, were 30 cm high and 10 m long. The two middle rows were used for data collection. Stem cuttings, about 30 cm long, were planted 1 m apart on the ridge crests. Plant population density was, thus, 10,000 plants per hectare. Each year, planting was done at the onset of rains (May/June) and harvested 12 months later. No fertilisers or herbicides were applied during the course of the study. Hand-weeding was done whenever necessary. Data on the African cassava mosaic disease were collected using a symptom severity scale of 1-5, where 1 indicates apparent field resistance and 5 - severe mosaic, severed distortion of four fifths or more of the leaflets, twisted leaves, and severe reduction of leaf size, including leaf strapping (IITA, 1990). Response to infestation of genotypes by cassava bacterial blight (CBB) was recorded based on symptom expression 3 and 6 months after planting, using a scale of 1-5. In this case, 1 = apparent field resistance; and 5 = extensive wilting, blighting, defoliation, gum exudation, complete die-back, abortive lateral shoot formation and severe stunting). Anthracnose disease (CAD) scoring for symptom expression was done 6 and 9 months after planting, using a scale of 1-5 (1 = apparent field resistance; 5 = dramatic wilting, constriction and distortion resulting in death of young plants). Cassava green mite damage was assessed 6-7 months after planting, conciding with the dry season (December/January) and scored using a scale of 1-5 (1 = no damage; 5 = severe damage) (IITA, 1990). The data were subjected to analysis of variance using the SAS statistical package (SAS, 1993) and treatment means separated, where applicable, using standard errors and Fisher's Least Significant Differences (LSD) test. The Analysis of variance (ANOVA) model, although widely employed in the analysis of two-way data (Shafii et al., 1992), is only useful in identifying the significance of sources of variation and provides no insight into genotypic response. Furthermore, because it is additive, it does not determine the extent and nature of G x E interactions. These interactions (i.e., the residual's from the additive model) require techniques such as Principal Component Analysis (PCA), to identify underlying relationships. The Additive Main Effects and Multiplicative Interaction (AMMI) model is a powerful hybrid statistical model that incorporates both attributes, thereby, identifying GxE interaction effects of a two-way data structure (Shafii et al., 1992; Gauch, 1993; Romagosa et al., 1996). From the ANOVA, the AMMI model separates the additive from the multiplicative variance (interaction) and then applies Principal Component Analyses (PCA) to the interaction (residual) portion from the ANOVA to extract a new set of co-ordinate axes, which describe more effectively the interaction patterns. Pearson Linear Correlation Coefficients were then calculated between pairs of dependent variables. The AMMI statistical model (MATMODEL Version 2.0; Gauch, 1993) was used to exploit genotype x environment interaction patterns. The AMMI model is: Yger = m + ag + be + Sln ggn den + pge + Eger Where Yger= yield of genotype g in environment e for replicate r; µ = grand mean; ag = mean deviation of the genotype g (genotype mean minus grand mean); be = mean deviation of the environment mean e; ln = the singular value for IPCA axis n; ggn = the genotype g eigen-vector value for IPCA axis n; den= the environment e eigen-vector value for IPCA axis n; pge = the residual; and Eger = the error. Data were also summarised using the biplot technique. The biplot is an aid in interpreting the G x E interaction effects (Zobel et al., 1988). It summarises information on the main effects and the first principal component scores of the interaction (IPCAI) of both genotypes and environments simultaneously (Gauch, 1982, 1988; Kempton, 1984). RESULTS AND DISCUSSION Combined analyses of variance showed that all sources of variation were highly significant (P<0.0001) for the four biotic constraints (Table 2). Environments accounted for 64.7, 22.0, 71.8 and 66.5% and genotypes for 10.6, 58/5, 12.0 and 14.4% of the treatment sums of squares (SS) for cassava green mite (CGM), African cassava mosaic disease (ACMD), cassava bacterial blight (CBB) and cassava anthracnose disease (CAD), respectively. The higher contribution of the environment to the treatment sums of squares indicates that the environment had a greater influence on symptom severities for the biotic constraints, compared to genotypes. The genotype x environment (G x E) interaction effects accounted for 24.7, 19.5, 16.2 and 19.1% of the treatment SS for CGM, ACMD, CBB and CAD, respectively. Also, mean squares were highly significant (P<0.0001) indicating that there was differential response among genotypes, to pest and disease infestations across environments. This implies that variation due to G x E was sufficiently high to mask differences among genotypes. Genotypic rankings with respect to their reactions to pests were different from environment to environment, complicating the selection of superior genotypes for resistance to these botic constraints, and thus reducing the correlation between genotype and phenotype. Higher magnitudes of G x E interaction effects in cassava have also been observed for other traits (Otoo et al., 1994; Dixon and Nukenine, 1997). The local variety exhibited the highest tolerance (severity of 1.5) to cassava green mite across sites, whereas clone 3001 was most susceptible to the pest (2.7). Mean pest reaction of the other clones ranged between 2.10 and 2.5 for the 3-year period of study (Table 3). Three genotypes (30001, TME1and 63397) had the lowest severity scores for ACMD, whereas 4(2) 1425 and 91934 were the most susceptibility (about 60% symptom severity) (Table 3). The other clones were moderately tolerant to the disease. Seven clones showed tolerance to CBB, with severity ratings as low as 2.0%. The other two clones (TMEI and 50395) had significantly higher severity ratings (Table 3). More than two-thirds of the clones showed tolerance to CAD, with severity ratings of less than 2.0. Clones U/41044 and 4(2) 1425 showed the highest tolerance to anthracnose, whereas the local variety, TME1, was the most susceptible to the disease (Table 3). Pest and disease severity data for various test sites are presented in Table 4. Cassava green mite was the most severe disease, with a mean severity score of 3.12 in Ilorin, but was least severe in Ubiaja (1.78) and Onne (1.79). Cassava mosaic disease (ACMD) was most severe in Ibadan and Ubiaja, and cassava bacterial blight (CBB) while the most in Ibadan and Ubiaja and least in Onne and Owerri. Cassava anthracnose disease (CAD) was more severe in Ibadan but least severe in Mokwa. Anthracnose disease has commonly been observed to be more severe in the humid forest zone than in savannah ecologies (Akonumbo, 1995). Cassava green mite was more severe in the southern Guinea Savanna (score 1.88) and least in the humid forest zone (Table 5). African cassava mosaic, cassava bacterial blight and the anthracnose disease, on the other hand, were most severe in the forest-savanna transition zone. Bacterial blight was least severe in the humid forest, whereas CAD was less in the southern Guinea savanna. Bacterial blight has been reported to be more prevalent and severe in the savanna zone (Persley, 1979). Linear correlation coefficients calculated between pairs of cassava pests showed that cassava bacterial blight (CBB) severity was negatively correlated with the green mite severity in 1989 and 1991, while in 1990 the converse was true (Table 6). Also, there were significantly positive correlations between CBB and CAD severity in 1990 and 1991. There was no significant correlation between the other biotic constraints. The AMMI model selected AMM11 for CGM and CBB, and AMM14 and AMM13 for ACMD and CAD, respectively as the best predictive models (Table 7), since these models had the smallest actual root mean square prediction differences of 0.60598, 0.37646, 0.40929, 0.37297, for CGM, CBB, ACMD and CAD, respectively. In addition, the treatment SS accounted for by the higher IPCA axes for ACMD and CAD were very small. The biplot (Fig. 1) captured 91% of the total variation, 75.3% of which was due to the main genotypic and environmental effects and 16.4% due to their interaction effects for the cassava green mite. For African cassava mosaic disease, the biplot detected 86.2% of the total variation, 80.4% due to the main effects and 5.8% due to interactions. For CBB and CAD, the biplot detected 6.9 and 10% of the variation to be due to interactions (Fig. 1). For instance, four genotypes (30572, 63397, 50395 and 4(2) 1425 had low ACMD damage scores and low IPCA1 scores. These genotypes were, thus, the most stable to environmental changes as they combined resistance with response stability. Such genotypes would be most appropriate in breeding programmes and for release to growers. The biplot of the first two IPCA axes (Fig. 2) demonstrates the relative magnitudes of the G x E interaction effects for specific genotypes and environments, since the G x E interaction effects are determined by the product of the correct IPCA scores and should be close to the centre of the axes. This is demonstrated by genotypes such as 30555 and 63397 for CGM, U/14044 and 50395 for ACMD, 30555, 30572 and 63397 for CBB and 30555, 4(2) 1425 and 63397 for CGM (Fig. 2). By contrast, the local variety TME1 exhibited a larger interaction effect and, thus, lay further from the centre of all the four biotic constraints (Fig. 2). Clones 4(2)1425 and 63397 were the best genotypes in terms of stability to disease because they combined small IPCAI scores with low damage ratings. The rest of the clones were considered unstable because they showed high disease scores and instability to disease across environments. For instance, clone 91934 had the lowest damage but also had only a moderate IPCAI score, while U/41044 with below average CAD damage score had larger interactions. Clones such as 4(2)1425 and 63397 will be most useful in breeding programmes because they would be successful parents for resistance breeding against CAD in diverse agro-ecological zones. The cassava green mite (CGM) was least severe in Ubiaja and Onne. These two sites are in the humid forest zone where rainfall is high and evenly distributed. Green mite is a dry season insect causing greatest damage when cassava plants suffer from drought stress. When rainfall is heavy, growth is luxuriant and pest attack is reduced substantially. The observation that ACMD was most severe in Ibadan and Ubiaja could be due to increased whitefly activity in those sites, or that propagation materials, although collected from apparently healthy stakes, were actually infected, and led to increased symptom expression during growth. Contrary to earlier reports, CBB was observed to be more severe in Ubiaja (a humid forest site). In an earlier study (Ngeve,1999),CBB was shown to be more severe in the savanna zone of the forest-savanna transition area. Thus, environmental factors or a combination of these with infected cuttings could have been responsible for the high symptom expression in the humid forest site in Ubiaja. There was significantly less CAD in Mokwa and Onne than in Ibadan and Ubiaja. It has been observed (Akonumbo, 1995) that CAD is more severe in the humid forest region, where disease is often spread by rain splash and wind. In addition, Akonumbo (1995) also observed that there were more anthracnose pathotypes in that ecology. Mokwa is in the Guinea savanna zone where CAD, in general, is relatively less severe. However, the fact that Onne (in the humid forest region) also had less disease in 1989, shows that factors other than rainfall amount and distribution, may be responsible for anthracnose severity on cassava. From the test clone stand point, our study shows that genotype x environment interactions are large for cassava response to the four biotic constraints, and these can mask differences among genotypes and complicate selection of suitable genotypes across environments. The study identified some clones such as U/41044, 4(2)1425 and 91934 which are resistant to the four biotic stress and others such as 4(2)1425 and 63397, which carry both resistance and stability of resistance to the economically important pest and disease constraints in several agro-ecological zones in Nigeria. In addition, the study found locations, such as Ibadan and Ubiaja, which combine small genotype x environment interactions with high disease pressure suitable for screening cassava genotypes for resistance to economically important pests and diseases. The lack of correlation between ACMD and CBB is in contrast with the report of Hahn et al. (1980), who observed correlated resistance between the two diseases. This study has shown that correlation in resistance between ACMD and CBB probably depends on genotype and prevailing environmental conditions. The AMMI statistical procedure was able to use the smallest actual root mean square prediction difference to determine stability of genotypes and environments, revealing that this procedure could be a suitable adjunct to the ANOVA technique in determining the significance of genotype x environment interaction effects and stability of genotypes across environments. REFERENCES
©2002, African Crop Science Society The following images related to this document are available:Photo images[cs02002t4.jpg] [cs02002f1.jpg] [cs02002t3.jpg] [cs02002t6.jpg] [cs02002t1.jpg] [cs02002t5.jpg] [cs02002t7.jpg] [cs02002f2.jpg] [cs02002t2.jpg] |
| |||||||||
